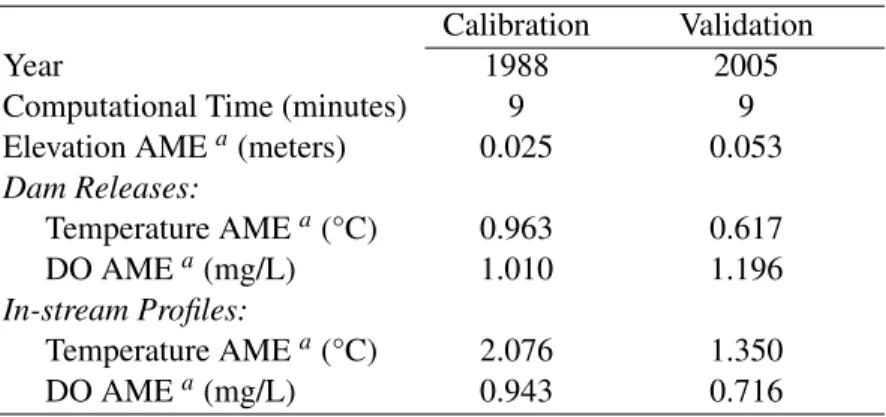
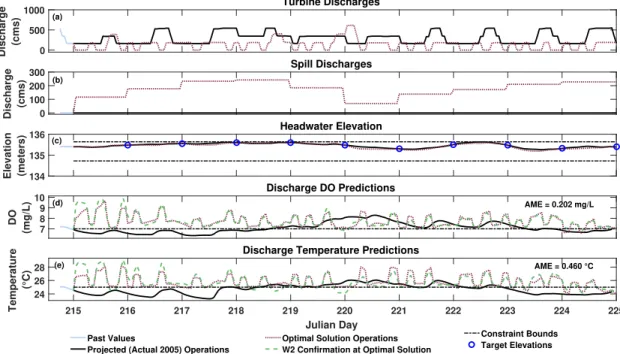
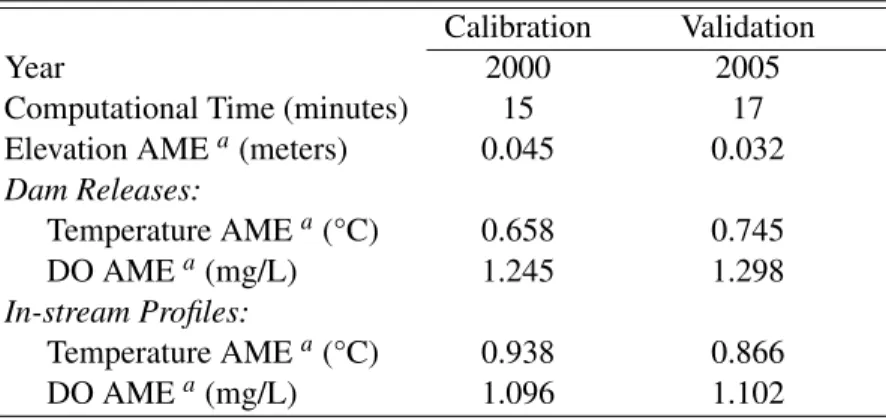
Thanks to Heather Smith Sawyer for helping me learn the ins and outs of CE-QUAL-W2. AME values represent the absolute average error between the NARX and CE-QUAL-W2 model predictions at the optimal solution.
Plan of Research
The limited number of water quality studies have not used state-of-the-art two-dimensional, high-fidelity water quality models (WQMs), but instead incorporated one-dimensional coarse-grained models or minimum flow requirements that are considered to support sufficient water. quality (Jager and Smith, 2008). Research is being conducted into the sensitivity of downstream water quality to changes in upstream activities.
Reservoir Modeling and Operations
Environmental Mitigation Techniques for Hydropower Systems
In the early 1990s, TVA implemented the Reservoir Release Improvement program to improve water quality and ensure a minimum constant flow rate on 20 TVA river system projects. Shirangi et al. (2008) combined a water quality simulation model with conflict resolution theory to determine improved operational strategies for selective reservoir withdrawal.
Hydrodynamic and Water Quality Modeling for Rivers and Reservoirs
Xu et al.(2008) used RMA2 and RMA4 to model and predict water quality for a Chinese tidal river network. Using a CE-QUAL-W2 model of Shasta Lake in northern California, Bartholow et al. (2001) used multivariable testing, a structured design-of-experiment method, to minimize computational cost while analyzing the potential effects of adding a temperature control device (TCD) selective withdrawal structure.
Decision Support Systems
RiverWare was coupled to the MODFLOW three-dimensional groundwater model and applied to the middle Rio Grande basin in New Mexico (Valerio et al., 2010). Salinity is externally estimated at four water quality stations with an artificial neural network (ANN) previously trained using a one-dimensional finite-difference hydrodynamic model of the channel system (Draper et al., 2004).
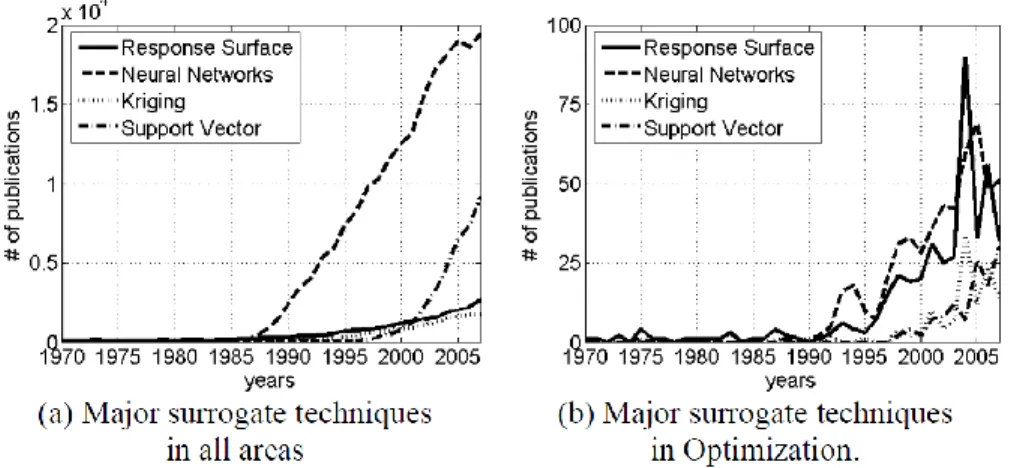
Surrogate Modeling Techniques
Design of Experiments
Search spaces can become very large for high-dimensional problems, resulting in a large number of training points to adequately cover the space (Razavi et al., 2012a). RBFs can handle a larger number of training points, but the process of tuning the correlation parameters can become a computational challenge (Razavi et al., 2012a).
Function Approximation Models
Considering this, kriging models can be either exact or imprecise emulators depending on parameter choice (Elsayed et al., 2012). SVR can be considered an extension of RBF and kriging methods due to many similarities (Forrester et al., 2008).
Analysis Frameworks
Otherwise, failure modes similar to those occurring in an adaptive-recursive framework are possible (Razavi et al., 2012a). If this is not met, the evolutionary optimization algorithm cannot find a global solution (Broad et al., 2005).
Response Surface Surrogate Usage in Water Resources
Mugunthan et al. (2005) tested two RBF-based function approximation methods (Regis and Shoemaker, 2004; Gutmann, 2001) within different optimization algorithms for autocalibration of the biodegradation of chlorinated ethene in an aquifer. Cooper et al. (1998) also developed a simulation/regression/optimization model for the optimization of the oil extraction process from groundwater, which evolved into a non-stationary problem.
Optimization of Hydropower Systems
Classic Methods
Georgakakos et al.(1997) used a combination of dynamic programming and optimal control method modules to maximize fixed energy production of the Lanier-Allatoona-Carters hydropower system across multiple time scales (instantaneous, hourly, and daily). Wang et al.(2005) were able to solve a problem by combining multi-objective optimization (hydropower, water supply and flood control), a multi-reservoir system (three reservoirs in parallel) and stochastic inflows using a combination of modifications.
Heuristic Algorithms
Ahmed and Sarma (2005), Chang and Chang (2001), and Cheng et al. (2008) each used different forms of GA to determine optimal reservoir operations. Jalali et al.(2007) used a special version of the ACO algorithm to overcome ACO's difficulty in dealing with continuous problems.
Gaps in the Literature and Research Advancement
The main reason for this lies in the high computational costs of high-fidelity WQMs and their structure being unsuitable for direct use in complex optimization problems. However, this approach has not yet been applied to solve the optimization of hydropower operations in real time, subject to the constraints informed by high-reliability WQMs.
Introduction
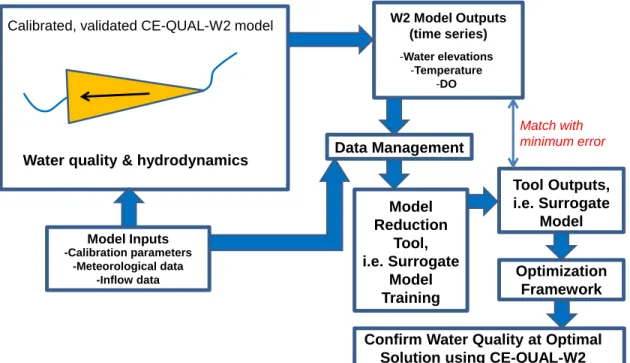
This architecture makes it possible to incorporate water quality constraints into the decision-making process and to make comparisons between the resulting optimal schedules and current operating procedures, all with high spatial and temporal accuracy. To date, such an approach does not exist on an operational time scale with a resolution that captures water quality gradients in dynamic, stratified reservoirs.
Case Study Description
This provides stratified reservoir operators with a means to determine preferred discharges on an operational time scale, maximizing power output while minimizing spill volumes necessary to maintain water quality standards. QUAL-W2 hydrodynamic and WQM for Old Hickory reservoir, allowing them to more accurately estimate water quality at compliance points to include discharges and locations (both depth and river miles) of sensitive species; however, they do not currently incorporate the model directly into decision support systems for reservoir operations.
Optimization Problem Formulation
Objective Function and Soft Constraint
This limits the solution from draining to the bottom of the energy pool at the end of each optimized daily subproblem. The penalty coefficient is greater the closer the target water level height is to the bottom of the energy pool.
Hard Constraints
Dividing by |S| takes into account the fact that during times when there are no discharges from the turbines or the flow field, the discharge water quality is undefined. This approach also makes it easier to compare members of the population that are not fully viable for water quality by having a single measurement to compare.
Methodology
Linear regression, Gaussian process, radial basis function, and Shepard's method were unable to mimic CE-QUAL-W2's highly nonlinear and dynamic water quality predictions (Shaw et al., 2013). If the current iteration achieves a minor water quality violation, it becomes the new best iteration.
Experimental Setup
An exhaustive combination of all variables, excluding the paired leakage and turbine inputs as explained, resulted in a total of 729 CE-QUAL-W2 model simulations. Each box represents 1% of the total set of CE-QUAL-W2 simulations resulting from the design of experiments.
Results
Experiment 1: Trade-Offs Between Water Quality and Energy Production . 80
The optimization constraint values were set to those listed in Table III.4, with the addition of a lower DO (ol) drain constraint. The optimization constraint values were set to those reported in Table III.4, with the addition of lower constraints for DO discharge (ol=7 mg/L) and temperature (tl=25 °C).
Discussion
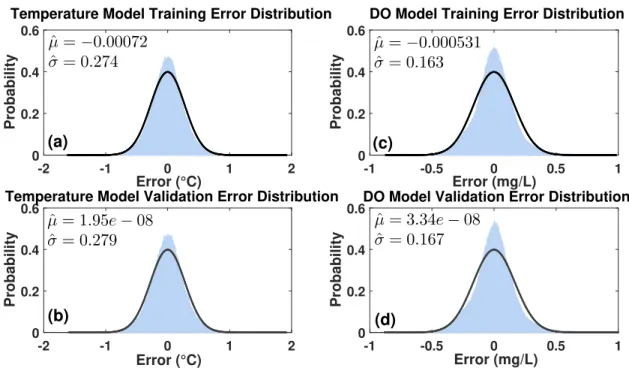
Surrogate water quality forecasts cannot replicate the CE-QUAL-W2 forecasts with zero error, but temperature and DO surrogate models successfully captured overall trends and provided improved “peaks and valleys” forecasts. CE-QUAL-W2 construction, calibration and validation should be performed by an experienced modeler with knowledge of the river system.
Conclusions
Introduction
Building on Shaw et al.(2017), we demonstrate how the adjustment quality of a surrogate WQM embedded within a population-based hydropower optimization routine improves. We know of no previous work using adaptive ANNs for constraint formulation within a GA routine, let alone for a hydropower optimization application.
Adaptive Linked Neural Network-Genetic Algorithms
Adaptive surrogate model updating within an optimization process balances exploration of the decision space and exploitation in regions of suspected optima. The authors note that this approach improved ANN capability for a particular desired use rather than overall generalization (i.e., the goal of off-line, one-step ANN training).
Case Study Description
Optimization Problem Formulation
To demonstrate the adaptive ANN training approach, a single water quality constraint (representing a lower bound on DO) was applied and no temperature constraint was considered.
Methodology
Resampling for ANN Adaptation
The extent of the predictive power of the WQM surrogate depends on the training data set on which it is based. This not only provides additional training data for the ANN, but also eliminates prediction errors at these points in the future.
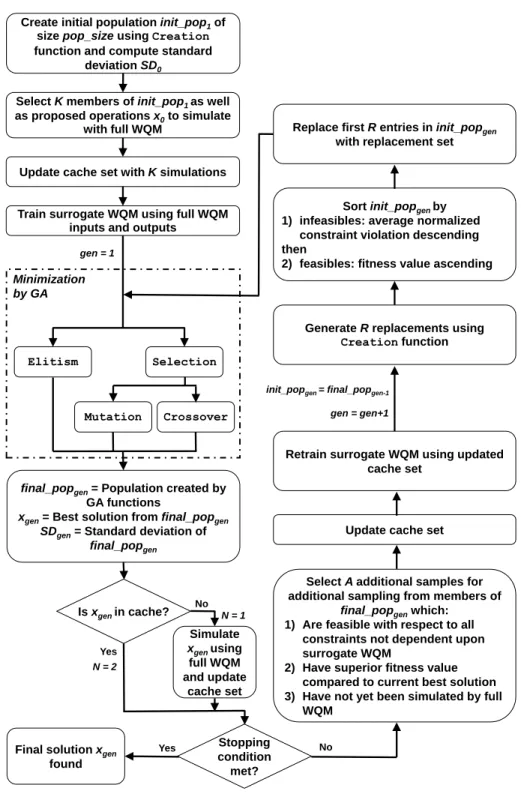
Random Immigrants Replacement
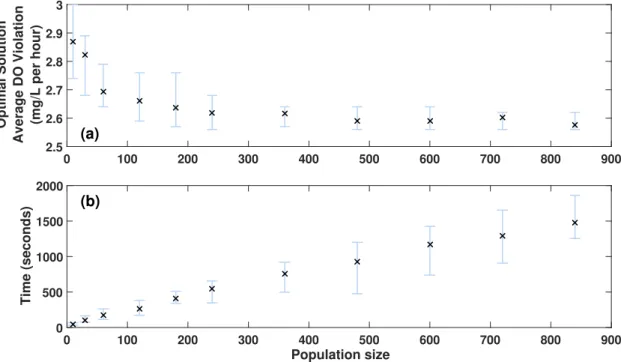
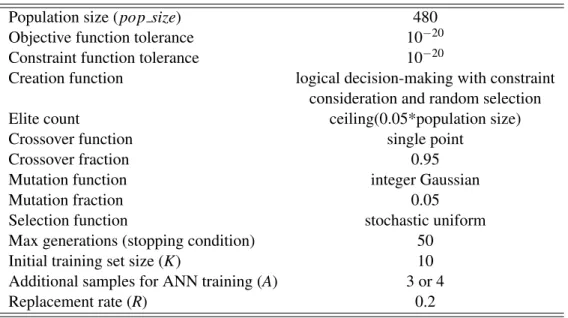
The replacement rate is the percentage of the population members that must be replaced in each generation. The optimizer then replaces the earliest (i.e., least desirable) R percentage of the current population with new members generated by the creation function used to generate the initial population.
Experimental Setup
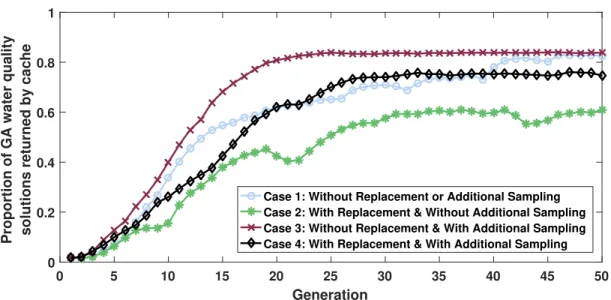
Alternatively, random immigration is a method in which a portion of the population is routinely replaced with new members, inspired by immigrants entering a biological population. Replacement retraining is performed in all four scenarios; this means that the surrogate model changes between each generation, but the retraining is affected by introducing additional training data beyond xgen in cases 3 and 4.
Results
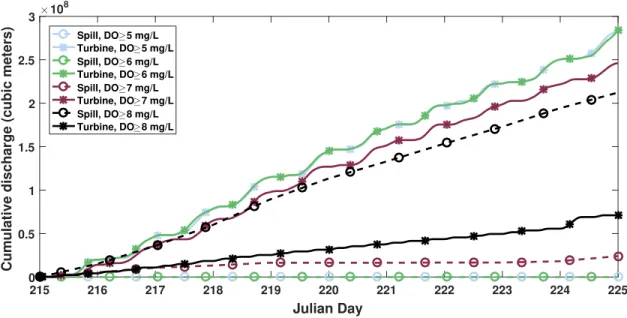
The problem was solved by four approaches: (i) without random immigrant replacement or adaptive sampling (other than simulating the best solution xgen after each generation), (ii) with replacement but without additional sampling, (iii) with additional sampling but without replacement, and (iv) full adaptive framework shown in Figure IV.1, including additional sampling and random replacement of immigrants. Adding either random immigrants to the population pools or adaptive additional sampling improved solutions.
Discussion
Using a surrogate model instead of the full CE-QUAL-W2 model yielded computational savings. Without using a powerful computing cluster, so many evaluations of the full CE-QUAL-W2 model (which in this case takes 1-3 minutes to evaluate on a desktop computer) would not be feasible for real-world operational planning .
Conclusions
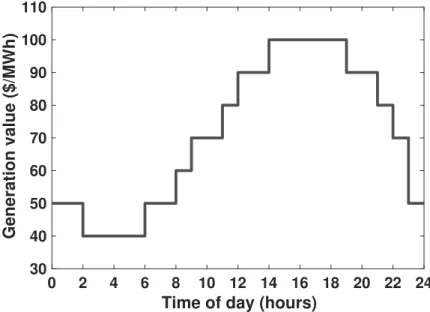
This reveals an even greater potential for additional hydro generation at times of peak demand than shown in Shaw et al. (2017), which translates into additional income generation, without having a negative impact on water quality. Hydropower producers are often required to make trade-offs between power production and water quality objectives (Loftis et al., 1985).
Introduction
Other studies use sensitivity analyzes to explore water body response to extreme boundary conditions, such as climate change scenarios (e.g. Van der Linden et al.(2015)). Quantifying model output uncertainties first requires identifying and characterizing all sources of uncertainty (Eslick et al., 2014).
Case Study Description
Here we wish to extend the work of the previous chapters to a system of reservoirs by conducting a necessary exploration of the feedforward water quality relationship between two series-connected reservoirs. The sensitivity of the quality of released water in the downstream reservoir to changes in the upstream boundary condition (i.e., upstream dam operations) is investigated.
Methodology and Experimental Setup
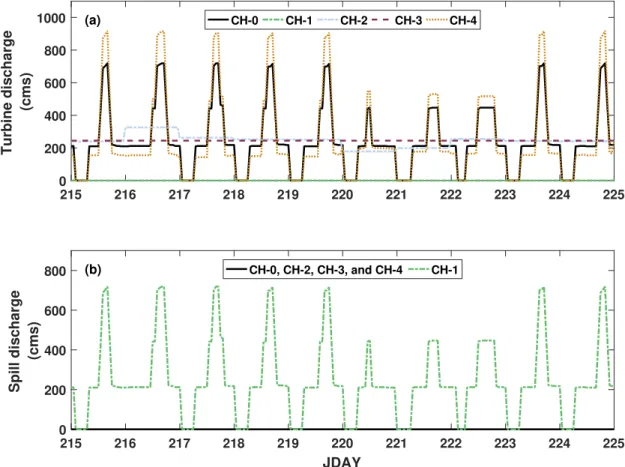
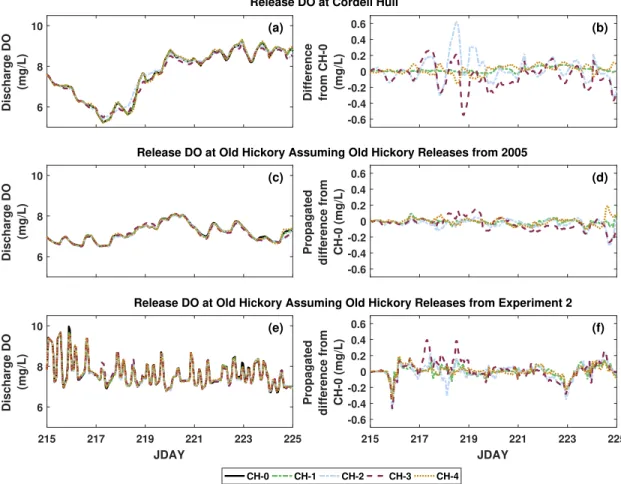
Experimental outflows and discharge temperatures and DO concentrations at Cordell Hull then replaced old-growth hickory mainstem inflows, resulting in changes in old-growth hickory tailwater temperature and DO concentrations. We did this twice, first assuming actual old-growth hickory runoff from 2005 and then using old-growth hickory runoff from Experiment 2 in Chapter III, with concurrent constraints on DO and temperature (see Subsection III.6.2 for additional information).
Results
The maximum difference at any time at the Cordell Hull release is approximately 0.6 mg/L and at the Old Hickory release is 0.3 mg/L. Due to the system's forward water quality conditions, Old Hickory releases the impact of the Old Hickory release water quality, while Cordell Hull releases the shock release water quality at both reservoirs.
Discussion
These results indicate that Old Hickory reservoir discharges are quite independent of the operating pattern at the upstream reservoir over this time period. Therefore, a segmented approach to optimizing the Cordell Hull-Old Hickory connected system, where reservoirs are optimized independently with assumed boundary conditions, is likely to result in minimal errors in downstream water quality predictions.
Conclusions
Future work should extend this sensitivity analysis to explore the impact of boundary condition flow differences on water balance (and thus hydropower production). We formulated this sensitivity analysis around the current case study system with the goal of optimizing operations over a concise 10-day period, with water quality considerations exclusively at a tailwater location.
Conclusions
For two reservoirs with hydropower capacities connected in series, we assessed the sensitivity of the downstream reservoir's discharge water quality in response to the upstream reservoir's discharge pattern. If a fixed volume of water is fed through the upstream Cordell Hull Reservoir, these results indicate minor impacts on downstream water quality predictions.
Future Work
Store all in one structure for input to optimization problem 291 ohl_temp_narx.Inputs=Inputs.discharge_temp;. 293 ohl_temp_narx.Discharge_temp_no0s=Discharge.temp_no0s; %stores the interpolated string ,→ in case the initial condition on input is NaN.
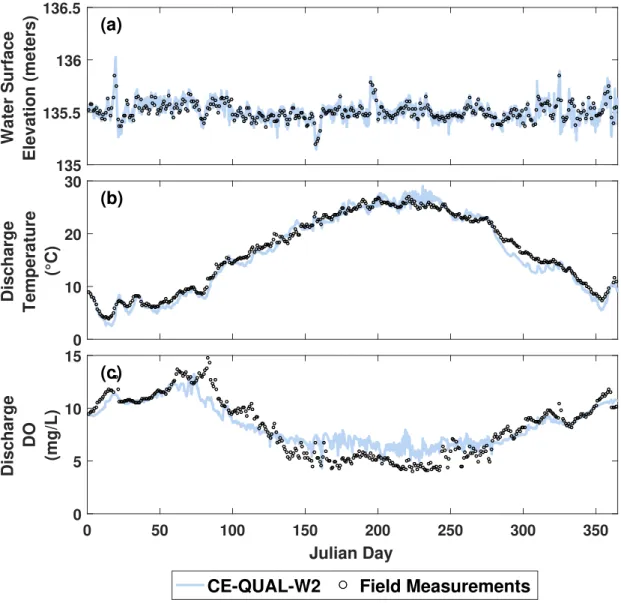
Summary of Old Hickory CE-QUAL-W2 model calibration and validation results
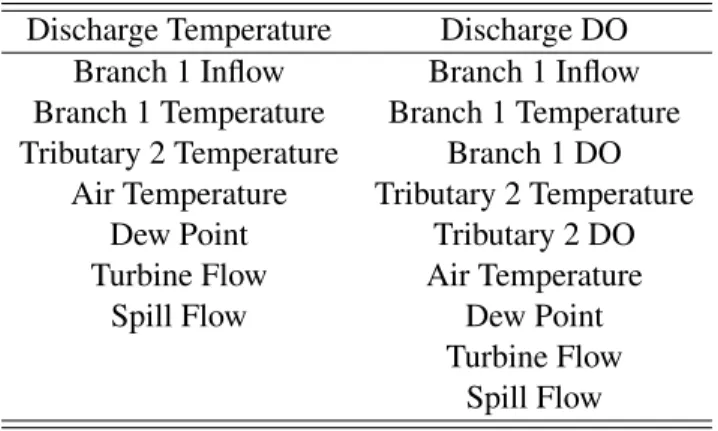
Exogenous variables lists for Old Hickory discharge NARX models
Optimization parameter settings
Optimization constraint values
Summary of Experiment 1 and Experiment 2 results
GA and overall framework settings
Power values for best feasible solutions found by the four approaches in eight trials. 98
Cordell Hull release scenarios used in sensitivity analysis
Cordell Hull and Old Hickory release temperature and DO concentration differ-