Does brand image resonance as the determinant factor in cosmetic purchasing decision? A Case Study at Sari Ayu Cosmetic
Rai Namira1, Parlagutan Silitonga2 STIE Pariwisata Internasional
Abstract
The research aims to propose a model that can increase customer purchase decisions and propose a series of efforts to achieve that goal. The solution proposed in this study is rooted in the R-A theory by accelerating news sharing capability. Consumers are aware of the latest developments about the product, the quality, which leads to the resonance of a company's brand image. The population in this study was the buyer of cosmetic Sariayu Martha Tilaar. The sample used in this study was 100 respondents by purposive technique. Data collection technique by accidental using the designed questionnaire. The questionnaire has been tested for its validity and reliability before distribution. The regression analysis started with the classic assumption test (normality, multicollinearity, heteroskedasticity, and linearity test) afterward by multiple linear regression analysis. The model determined by the hypotheses testing applied F test, t-test, correlation test, and the coefficient of determination R2 . The results showed that none of the single variables stand alone. All independent variables in weak significant effect individually. Therefore, it is suggested that the Sari Ayu Cosmetic management should make a significant effort to pay attention to brand image resonance and price perception in line with the needs and wants of their potential customers.
Keywords: Product of Quality, Brand Image Resonance, Price Perception, Purchase Decision
Introduction
Resource advantage theory of competition has been widely used in increasing the use of resources owned by a company (Eloranta & Turunen, 2015; Fahy et al., 2004; Ghapanchi et al., 2014; Shafeey & Trott, 2014) to achieve objectives, primarily with the increasingly tighter business competition. Competition is part of the life of a business. Before a business is started, competition is identified. All industries follow the pattern of competition, including well-known brands. The cosmetic industry is experiencing increasingly fierce competition day by day (Gupta et al., 2016). Competition for quality, price, and the echo image of a brand with product variants is an exciting competition arena. Companies that win these three variables can penetrate a broader market regionally and internationally. Competition for product quality has been carried out by many previous researchers (Hunt, 1997; Vargo, 2007).
Businesses need a vast network in regulating the availability of raw materials upstream (Ghapanchi et al., 2014; Hughes & Morgan, 2007). Meanwhile, efficiency and effectiveness in the midstream are being implemented as a competitive advantage (Fahy et al., 2004). All efforts are made, such as partnering with other parties aims to find synergy. One of the problems faced by a company is the stagnation of information from the company to its customers (Brashear- Alejandro et al., 2016) or consumers. Expensive and stagnant information from a company is stated in the Resource-Advantage theory (R-A theory) to maximize internal strength to gain
competitive advantage. However, none of the large industries rely on their strengths; therefore, this study is based on an observation of the inconsistency in the finding that, on the one hand, the quality of products and services is not significant. Research shows that adequate training guarantees the quality of a product or service (Bilanakos et al., 2018). The following research found that product quality is inferior in providing customer satisfaction (Arifiansyah et al., 2020). Thus the researcher asked the following research questions:
Research Questions:
What efforts should be made to increase customer satisfaction
Based on the research questions above, the researcher aims to propose a model that can increase customer satisfaction and propose a series of efforts to achieve that goal. The solution proposed in this study is rooted in the R-A theory by accelerating news sharing capability. Consumers are aware of the latest developments about the product, the quality, which leads to the resonance of a company's brand image. The urgency of this research, researchers chose a well-known cosmetics company in Indonesia that focuses its products on the middle class as its target market. The trademark Sari Ayu knows the company. At the same time, the name of the legal entity is P.T.
Sariayu Martha Tilaar.
Review of Theory and Hypothesis Development Product quality
Product quality is one of the primary positioning means for marketers. Quality has a direct impact on the performance of the product; therefore, quality is closely related to customer value and satisfaction (Farzad et al., 2020; Yu et al., 2020), especially on sophisticated technology.
Product quality is one of the main dominant factors to export destinations (Curzi et al., 2020) to influence purchasing decisions and become consumer considerations. Companies need to make innovations or variations to develop the quality of their products to be even better and more able to provide customer satisfaction to widen the market reach and increase sales of these products.
In modern marketing, cosmetics are a daily necessity that society needs, especially for women who want to look beautiful and attractive. Also, cosmetics have a vital role in increasing one's self-confidence. That is why cosmetic products are currently a need that is increasing from year to year. There are now more types of product variants in cosmetic products, and if the echo of the brand image is getting higher, the acceptance in the market will be higher. Productive information disclosure and regular monitoring from the authorities on each benefit attribute and usage rules need to be present (Y. Liu et al., 2020; H. Zhang et al., 2021) so that consumers avoid the dangers of use. This includes the control of gloss additives in cosmetics or flavor enhancers in the food industry.
Moreover, excessive benefits will lull potential consumers to buy cosmetic products or other products that are often excessive and ineffective. Declaration of benefits is essential but should not be excessive to keep consumer confidence. Consumers will use cosmetic products, which in their opinion, are best because they are effective and safe. The development of the cosmetics industry in Indonesia shows that this industry has good prospects and has intense competition due to an increase in cosmetics, especially the decorative category. Technological advances have brought rapid and significant changes to this industry (Z. Zhang et al., 2020), including honesty and producer responsibility. Using modern technology, the industry can now produce a wide range of products on an extensive economic level on a huge scale. Public consumption of cosmetic products tends to continue to increase, along with changes in people's
lifestyles, including consumption patterns (Piveteau & Smagghue, 2019). This means that product quality is a priority for producers and users, even though the quality is correlated with the selling price. However, product quality that can provide satisfaction to consumers will ensure the sustainability of a business or brand and make it easier for consumers to make purchasing decisions (Rybaczewska et al., 2020). Thus the following hypothesis is conveyed:
H1 Product quality has a positive effect on customer satisfaction
Brand image resonance
The brand is the identity of a company. Products are introduced through brands. Products that are sold to consumers repeatedly foster an image. Brand image resonance which in turn becomes the strength of brand image which leads to corporate equity (Burmann et al., 2009). However, the management of brand image resonance in all business processes must be vigilant to avoid bad impacts (Huber et al., 2010). The company will create several product variants with a different brand. This strategy examines the preferences and choices of target markets according to buyers' or consumers' demographics, geography, and socioeconomic status. The more frequent purchases are made, the more there is a sign that the buyer has a preference and conforms to their needs and wants. The frequency of repeated purchases will lead to customer loyalty (Allender & Richards, 2012; Buil et al., 2013). This loyalty can establish a relationship between companies with brand image resonance with consumers, which is defined as customer (Hasan et al., 2014). However, marketers must be wary of consumer resistance to a brand image because of the resonance that has been desperately defended (Cheng et al., 2012). It is natural for consumers to be loyal to a particular brand and not to the image of another brand because they are used to and then love that brand.
On the other hand, price elasticity also affects disruption of loyalty, mainly supported by new echoes (Byun et al., 2018). This is triggered by the influence of price, design, and function of a product or price. Thus, the brand's resonance as the bearer of the name, image, and liking that leads to purchase decision cannot be denied. This is separated from the presence of new players who introduce product differentiation.
A study has proven the effect of brand image resonance on the decision to buy a product (Buil et al., 2013). The echo of a brand must be followed by marketing content in all advertisements, electronic publications (Ahmad et al., 2016) to answer whatever is requested or needed by consumers. The creativity of content creators is required to make it easier and easier to increase consumer engagement. If the brand's promotional content is unpleasant for consumers, it can have fatal consequences for the brand itself. It is therefore, the brand resonance, and the content quality shall be in place. Based on the description above, the following hypothesis is presented:
H2 Brand image resonance has a positive effect on purchasing decisions
Perceived price
It is the art of marketing to predict the positive reaction of consumers to product quality, the resonance of brand image, and price perception. Consumers have great confidence in certain brands that are known as quality (Baumert & de Obesso, 2021) and therefore are willing to pay more than similar products that are not yet cool. The oddity continues because previous research states that when a product such as food that does not include a price on the food list is perceived as an expensive product and lacks quality. The pricing strategies related to packaging, content, and usability are closely linked (Kim et al., 2021). Price management games can increase
company revenue. However, it can also disappoint customers if price management is too dynamic. Dynamic prices are practiced with drastic changes over time (C.-H. S. Liu & Lee, 2016). Suppose someone tells you that yesterday he bought a television in a particular shop and his neighbor bought it at a different time in a matter of hours on the same day, with a much different price. In that case, one feels benefited, and the other feels disadvantaged.
This may not be very pleasant if the price differences are significantly due to the dynamic pricing policy earlier.Indeed, there are several levels of brands, such as brands that cannot build a brand, inevitably reducing the cost of brand nutrition (Huang & Huddleston, 2009) at the expense of profit margins. Low prices can be perceived as lower quality. In this case, the costs incurred in building brand nutrition are rewarded favorably compared to companies that sell low prices but never provide nutrition to the brand. There is also the experience of buyers who are satisfied and tell their friends that certain brands are cheap and of good quality and get a discount. This word of mouth has a positive effect on purchasing decisions because testimony obtained from trusted friends has the power to have a positive effect. Purchases that involve customers in two-way communication provide space and options for the buyer to determine the price he wants (Ferguson et al., 2017). Some buyers find it easier to make purchasing decisions if the price offered is fixed (Benigno & Karantounias, 2019). Based on the theoretical review above, the authors convey the following hypothesis:
H3 Perceived price has a positive effect on purchasing decisions
Purchase decision
Each decision determines the course of action and its consequences. Anyone can make up his mind on what he thinks and chooses. There is a risk to bear and an expected benefit. No matter
the small thing or the big thing, all actions are based on decision-making. For example, decision- making is carried out at the management level through a complicated and careful process, so the first question on the stated benefits.
Additionally, what are the roles of the goods or services purchased (Steinhauser et al., 2019), not to mention quality, of course? The process and decision-making for purchasing sophisticated goods such as artificial intelligence are even more complicated (Filice et al., 2020) because it involves experts and considers the cost, effective and safety of its use. Of course, this vigilance aspect is strived to avoid adverse risk, or the minor sacrifice aims to achieve a more significant profit, if not the greatest profit. Some make comparisons of a new thing that will be decided with an old thing that has already been decided. Some follow the routine of good decisions that have been made repeatedly. What value can be obtained by an action that has been decided? This comparison makes it easy to calculate risk and return.
In purchasing goods or services, of course, the first thing to compare is the quality of the product, the benefits, then the price, and then the delivery of the goods or services to be agreed upon. Some ask friends or remember previous experiences (Rybaczewska et al., 2020). However, some immediately question the brand image of an item or the reputation of a service provider.
The matter of price and delivery is not a significant issue when considering purchasing decisions.
Buyers feel safe and prestigious when possessing goods or services from owners that echo a well-known brand image. Formal sources of information from print and electronic media are used as a reference. Lately, medical equipment and kitchen furniture products are often sold by live chat on television (Lv et al., 2018) because buyers immediately see the real goods they will buy, and purchase decisions are faster and feel safe because the endorser is known or well- known. But lately, in the digital era as it is underway, information from social media has become
a determining source in making comparisons. Word of mouth from social media is a decision- making process for consumers. Dynamic change is easier and faster by using social media as long as the offering content is informative, exciting and the results are encouraging. It is faster than any above-the-line advertisement. News dies in one day through a newspaper or any electronic media (Guo et al., 2020). Based on the theoretical review, the author proposes the following hypothesis:
H4 Product quality, brand image resonance, andperceived price influence the purchase Decision
Research methodology Unit analysis, population and sampling technique
The research instrument has been tested for validity and reliability first to 20 respondents.
Respondents consisted of Sari Ayu products; afterward, the research was conducted from January to March 2020. The population consisted of buyers at Sari Ayu outlets during that period. The sampling technique uses a purposive method for efficiency and limited purchases due to the Covid-19 pandemic. The questionnaire was given to 150 buyers (Sugiyono, 2017).
The questionnaire was given accidentally to guests as respondents who were willing to fill out 150 questionnaires, but only 100 were filled in completely.
Method of analysis
Quantitative analysis with multiple regression was preceded by a classic test using SPSS version 20. After that, the F test, t-test, correlation, and determination test were carried out to ensure the model's suitability and the model significance of each variable.
Analysis and results Table 1. Here
Using the Kolmogorov Smirnov test, with a fundamental level, the significance value of the Smimov Columnogrov test in the table above shows that the significance value is 1,000> 0.05.
Thus the data is normally distributed because it finds a significance value> 0.05. Based on the analysis results above, the conclusion is that the data normality assumption has been fulfilled.
Heteroscedasticity Test
The heteroscedasticity test is used to test whether there is an inequality of variance from the residuals from one observation to another in the regression model. If the dots spread out in an unclear pattern and are below the number 0 on the Y axis, then there is no heteroscedasticity problem.
Figure 1. Here
From figure 1, it can be seen that the dots spread with an unclear pattern above and below the number 0 on the Y-axis. So it can be concluded that there is no heteroskedasticity problem in the regression model.
Multicollinearity Test
Variable showing symptoms of multicollinearity can be seen from the VIF (Variance Inflation Factor) value. If the VIF value is less than 10 and the Tolerance value is more than 0.1, it can be
concluded that the regression model does not have multicollinearity problems. Following are the results of the Multicollinearity test:
Table 2. Here
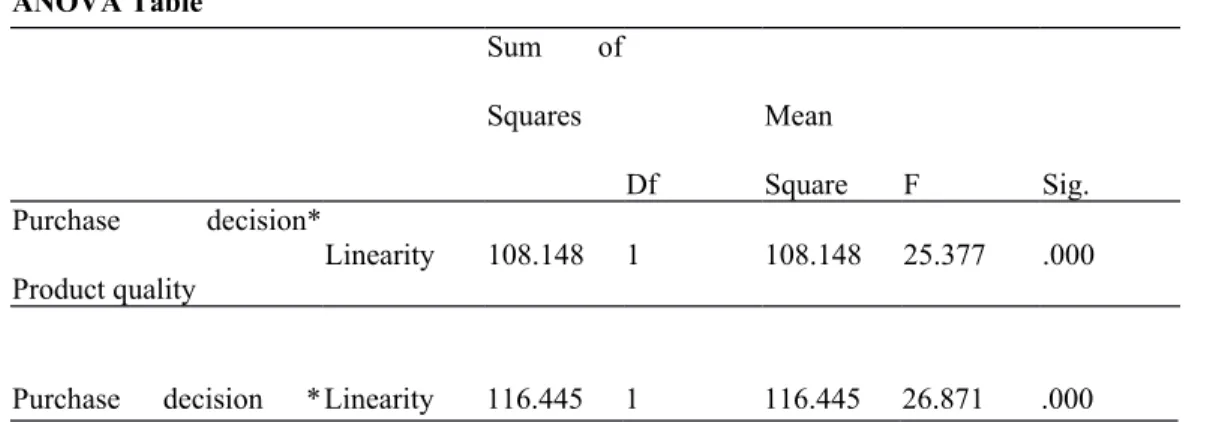
Linearity Test
The linearity test aims to determine whether the data we have is by a straight line or not. If Sig.
or significance at Linearity <0.05, it can be said that there is a linear relationship between variables.
Table 3. Here
The result of the linearity test shows that the significance value of product quality has a significance value of 0.000. The brand image resonance significance value of 0.000, and the significance value of price perception of 0.005. The three variables have a linear relationship because the significance value of each variable is less than 0.05. Then it can be concluded that the linearity results are met.
Multiple Linear Regression Analysis
By using the help of SPSS software version 20, a regression model that shows the relationship between product quality variables, brand image resonance variables, and price perception variables on the variable purchasing decision for Sariayu Martha Tilaar cosmetics is presented in table 4 as follows:
Table 4. Here
Based on the data analysis above, it is found that the resulting regression model is:
Purchase Decision = -1.906 + 0.317 Product Quality + 0.276 Brand image resonance + 0.299 Price Perception. The value of the constant-coefficient = -1.906 means that if the product quality, brand image resonance, and price perception are 0, the level of purchasing decisions is negative, namely -1.906. This company faced tough competition against a local and imported product, focusing on the independent variable. The regression coefficient of the product quality variable is 0.317; this means that every increase in product quality of 1 unit will increase the purchasing decision by 0.317 times, assuming other independent variables have a fixed value. The regression coefficient of the brand image resonance variable is 0.276; this means that every increase in the brand image resonance of 1 unit will increase the purchase decision by 0.276 times, assuming other independent variables have a fixed value. The regression coefficient of the price perception variable of 0.299 means that every increase in product quality, by 1 unit, will increase the purchase decision. As much as 0.299 times with the assumption that other independent variables have a fixed value.
F test
The F test is the coefficient of regression. Together, it is carried out to test the significance of the influence of several independent variables on the dependent variable. The test uses a significance level of 0.05
Table 5. Here
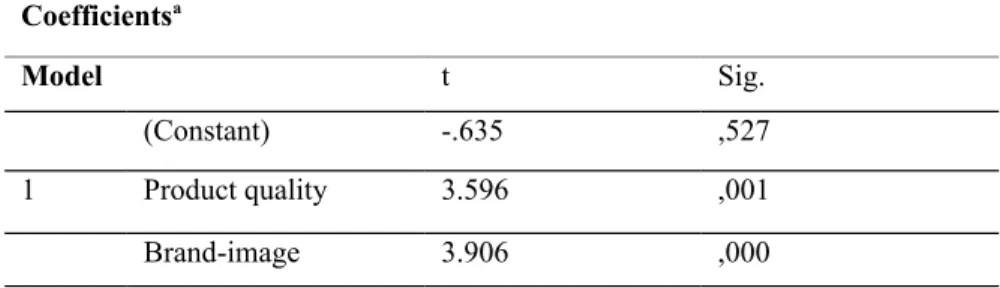
t-test
The t-test is used to partially understand the influence of the independent variable (Product Quality, Brand Image Resonance, and Price Perception) on the dependent variable (Purchase Decision). SPSS processed results, testing each variable partially with the t-test.
Table 6. Here
The t-test results for the Product Quality variable were obtained with a significance level of 0.001 <0.05. So that H0 is rejected, and H1 is accepted. Thus, the product quality has a significant effect on the purchasing decision for Sariayu Martha Tilaar cosmetics. This can conclude that the better the quality of the product, the higher the purchase decision. This is by research conducted by (Y. Liu et al., 2020; Piveteau & Smagghue, 2019; H. Zhang et al., 2021) that the variable product quality has a significant effect on purchasing decisions. Sariayu Martha Tilaar cosmetic products provide cosmetic products with various product variants, such as product diversity performance, reliability, suitability, durability or product durability, perceived quality. This makes Sariayu Martha Tilaar products a product that is in demand by women (Piveteau & Smagghue, 2019; H. Zhang et al., 2021).
The t-test results for the brand image resonance variable (X2) were obtained with a significance level of 0.000 <0.05. So that H0 is rejected, and H1 is accepted. Thus, brand image resonance has a significant effect on purchasing decisions. Thus it can be concluded that the better the brand image resonance, the higher the purchase decision (Burmann et al., 2009).
However, the management of brand image resonance in all business processes must be vigilant (Huber et al., 2010) in order to avoid bad impacts (Byun et al., 2018) that the brand image resonance variable has a significant effect on purchasing decisions. Brand image resonance is all information that represents a good or service that distinguishes it from other goods and services (Burmann et al., 2009). However, the management of brand image resonance in all business processes must be vigilant (Huber et al., 2010) in order to avoid bad impacts (Byun et al., 2018).
Sariayu's brand image resonance has a well-known brand image resonance that encourages consumers to buy these cosmetic products.
The t-test results for the price variable (X3) are obtained with a significance level of 0.010 <0.05. So that H0 is rejected, and H1 is accepted. Thus, the price has a significant effect on purchasing decisions. This is in accordance with research (Arifiansyah et al., 2020) that the price variable has a significant effect on purchasing decisions. According to Kotler and Armstrong (2015), price is the amount of money a customer must pay to obtain a product. It can be concluded that choosing the right price is very influential on purchasing decisions.
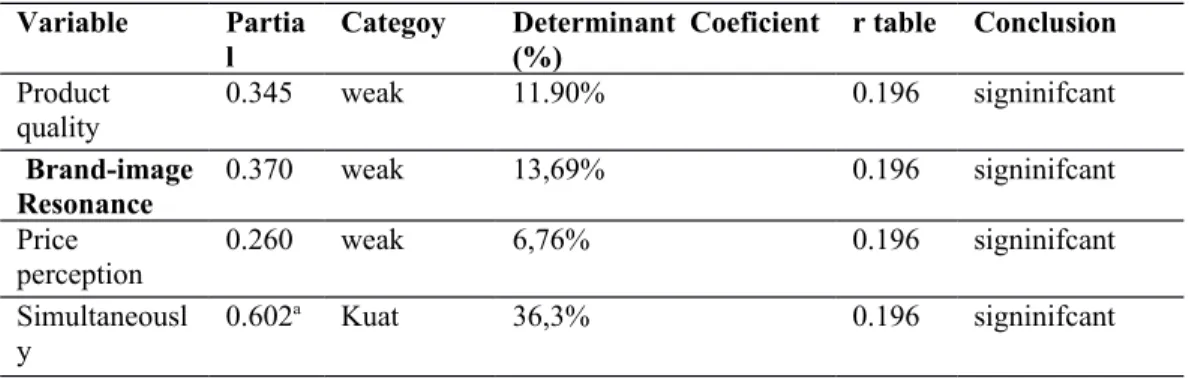
Coorelation coeficient (r) and determinant coeficient (R2)
Table 7. Here
Based on the results, the partial coefficient value of the product quality variable with purchasing decisions is 0.345, which means that there is a significant relationship between product quality and purchasing decisions and is in the weak correlation category. The coefficient of determination of the product quality variable on purchasing decisions is 11.90%, which means
that the product quality on purchasing decisions is partially 11.90%. According to Kotler and Armstrong's (2008) statement, product quality is one of the main positioning means for marketers. Quality has a direct impact on product or service performance. Therefore quality is closely related to customer value and satisfaction. Sariayu cosmetic products Martha Tilaar have a weak correlation category because the product quality of Sariayu cosmetics has not fulfilled consumer needs. Kotler and Armstrong's (2015) statement that product quality is one of the primary positioning means for marketers. Quality directly impacts product or service performance; therefore, quality is closely related to customer value and satisfaction.
Sariayu cosmetic products Martha Tilaar have a weak correlation category because the product quality of Sariayu cosmetics has not fulfilled consumer needs. The partial coefficient value of the brand image resonance variable with the purchase decision is 0.370, which means a significant relationship between the resonance of the brand image and the purchase decision, and there is a weak correlation. According to previous research, a positive value indicates a unidirectional relationship (Baumert & de Obesso, 2021). The coefficient of determination of the variable. The coefficient of determination of the brand image resonance variable to the purchase decision is 13.90%, which means that the partial resonance of the brand image to the purchase decision is 13.90%. (Baumert & de Obesso, 2021; Kim et al., 2021) States that brand image resonance is anything that identifies a seller's goods or services and distinguishes them from other goods and services. Thus, the echo of the brand image is stronger than the other independent variable to distinguish it from the goods and services produced by competitors. The resonance of the brand image in turn signals the consumer about the source of the product from a well-known production company. This area is recommended to pay keen attention to support purchase decision-making by potential customers as stated in one of the premises of R-A Theory
that information and relational in the competition are the way to disseminate company strengths (Hunt, 1997) that lead to persuade potential customers.
The value of the partial coefficient of the price variable with the purchase decision is 0.260, which means that there is a real relationship between price and purchase decision with the weak correlation category. A positive value indicates a unidirectional relationship, according to previous research (Baumert & de Obesso, 2021). The coefficient of determination of the price variable on purchasing decisions is 6.76% which means that purchasing decisions are 6.76%.
According to the opinion (Baumert & de Obesso, 2021), the price is the amount of money (possibly plus some goods) needed to obtain some combination of products and services that accompany it. So it can be concluded that the better the price that can be reached or according to the desires of consumers for a product, the purchase decision will be better or will increase.
Simultaneously or collectively, it is known that the correlation coefficient value of the product quality variable, brand image resonance and price perception towards purchasing decisions is 0.602, which means that there is a significant relationship in the strong category between the variable product quality, brand, and price perception on purchasing decisions in accordance with previous research (Baumert & de Obesso, 2021; Kim et al., 2021). The ability of the three variables to explain the level of purchasing decisions is 36.3%. This means that the percentage of the effect of the independent variable on product quality, brand image resonance, and price on the dependent variable on purchasing decisions is 36.30%. The remaining 63.7% is influenced by other variables not listed in this research model.
Conclusions and Managerial Implications
In answering the above research questions, the three variables cannot stand alone. Product quality does not always guarantee that it is easy for consumers to make a purchase. The echo factor, brand image, and price play a role in supporting purchasing decisions for consumers.
Independently, none of the variables has a strong influence on purchasing decisions for consumers. This is how the management of Sari Ayu Corporation should do, continuously aims to maintain consumers satisfaction. Therefore, the managerial implication is suggested that the price factor and brand echo get attention so that it is continuously resonated.
References:
Ahmad, N. S., Musa, R., & Harun, M. H. M. (2016). The Impact of Social Media Content Marketing (SMCM) towards Brand Health. Procedia Economics and Finance, 37(16), 331–
336. https://doi.org/10.1016/s2212-5671(16)30133-2
Allender, W. J., & Richards, T. J. (2012). Brand Loyalty and Price Promotion Strategies: An
Empirical Analysis. Journal of Retailing, 88(3), 323–342.
https://doi.org/10.1016/j.jretai.2012.01.001
Arifiansyah, R., Aulia, M., & Riyanto, A. (2020). The influence of product quality, atmosphere, and location on customer satisfaction at the Cafe Hotel Mulia Senayan. Panorama
Nusantara, 15(2), 72–84.
https://erepository.stein.ac.id/index.php/erepositorystein/article/view/190/191
Baumert, T., & de Obesso, M. de las M. (2021). Brand antiquity and value perception: Are customers willing to pay higher prices for older brands? Journal of Business Research, 123(October 2020), 241–254. https://doi.org/10.1016/j.jbusres.2020.09.060
Benigno, P., & Karantounias, A. G. (2019). Overconfidence, subjective perception and pricing
behavior. Journal of Economic Behavior and Organization, 164(August 2019), 107–132.
https://doi.org/10.1016/j.jebo.2019.05.029
Bilanakos, C., Heywood, J. S., Sessions, J., & Theodoropoulos, N. (2018). Does demand for product quality increase worker training? Journal of Economic Behavior and Organization, 155, 159–177. https://doi.org/10.1016/j.jebo.2018.08.018
Brashear-Alejandro, T., Kang, J., & Groza, M. D. (2016). Leveraging loyalty programs to build customer-company identification. Journal of Business Research, 69(3), 1190–1198.
https://doi.org/10.1016/j.jbusres.2015.09.014
Buil, I., de Chernatony, L., & Martínez, E. (2013). Examining the role of advertising and sales promotions in brand equity creation. Journal of Business Research, 66(1), 115–122.
https://doi.org/10.1016/j.jbusres.2011.07.030
Burmann, C., Jost-Benz, M., & Riley, N. (2009). Towards an identity-based brand equity model.
Journal of Business Research, 62(3), 390–397.
https://doi.org/10.1016/j.jbusres.2008.06.009
Byun, K. A. (Kay), Jones, R. P., & Wooldridge, B. R. (2018). It is not always about brand:
Design-driven consumers and their self-expression. Journal of Retailing and Consumer Services, 43(December 2017), 296–303. https://doi.org/10.1016/j.jretconser.2018.04.009 Cheng, S. Y. Y., White, T. B., & Chaplin, L. N. (2012). The effects of self-brand connections on
responses to brand failure: A new look at the consumer-brand relationship. Journal of Consumer Psychology, 22(2), 280–288. https://doi.org/10.1016/j.jcps.2011.05.005
Curzi, D., Schuster, M., Maertens, M., & Olper, A. (2020). Standards, trade margins and product quality: Firm-level evidence from Peru. Food Policy, 91(November 2019), 101834.
https://doi.org/10.1016/j.foodpol.2020.101834
Eloranta, V., & Turunen, T. (2015). Seeking competitive advantage with service infusion: A systematic literature review. In Journal of Service Management (Vol. 26, Issue 3).
https://doi.org/10.1108/JOSM-12-2013-0359
Fahy, J., Farrelly, F., & Quester, P. (2004). Competitive advantage through sponsorship.
European Journal of Marketing, 38(8), 1013–1030.
https://doi.org/10.1108/03090560410539140
Farzad, M., El Ferouali, H., Kahraman, O., & Yagoobi, J. (2020). Enhancement of heat transfer and product quality using jet reattachment nozzles in drying of food products. Drying Technology, 1–19. https://doi.org/10.1080/07373937.2020.1804927
Ferguson, J. L., Brown, B. P., & Johnston, W. J. (2017). Partitioned pricing, price fairness perceptions, and the moderating effects of brand relationships in SME business markets.
Journal of Business Research, 72(March 2017), 80–92.
https://doi.org/10.1016/j.jbusres.2016.11.001
Filice, R. W., Mongan, J., & Kohli, M. D. (2020). Evaluating Artificial Intelligence Systems to Guide Purchasing Decisions. Journal of the American College of Radiology, 17(11), 1405–
1409. https://doi.org/10.1016/j.jacr.2020.09.045
Ghapanchi, A. H., Wohlin, C., & Aurum, A. (2014). Resources contributing to gaining competitive advantage for open source software projects: An application of resource-based theory. International Journal of Project Management, 32(1), 139–152.
https://doi.org/10.1016/j.ijproman.2013.03.002
Guo, J., Wang, X., & Wu, Y. (2020). Positive emotion bias: Role of emotional content from online customer reviews in purchase decisions. Journal of Retailing and Consumer Services, 52(October 2018). https://doi.org/10.1016/j.jretconser.2019.101891
Gupta, S., Malhotra, N. K., Czinkota, M., & Foroudi, P. (2016). Marketing innovation: A consequence of competitiveness. Journal of Business Research, 69(12), 5671–5681.
https://doi.org/10.1016/j.jbusres.2016.02.042
Hasan, S. F. e, Lings, I., Neale, L., & Mortimer, G. (2014). The role of customer gratitude in making relationship marketing investments successful. Journal of Retailing and Consumer Services, 21(5), 788–796. https://doi.org/10.1016/j.jretconser.2014.06.007
Huang, Y., & Huddleston, P. (2009). Retailer premium own-brands: creating customer loyalty through own-brand products advantage. International Journal of Retail & Distribution
Management Retailer, 37(11), 975–992.
https://doi.org/http://dx.doi.org/10.1108/09590550910999389
Huber, F., Vollhardt, K., Matthes, I., & Vogel, J. (2010). Brand misconduct: Consequences on consumer-brand relationships. Journal of Business Research, 63(11), 1113–1120.
https://doi.org/10.1016/j.jbusres.2009.10.006
Hughes, P., & Morgan, R. E. (2007). A resource-advantage perspective of product-market strategy performance & strategic capital in high technology firms. Industrial Marketing Management, 36(4), 503–517. https://doi.org/10.1016/j.indmarman.2006.01.003
Hunt, S. D. (1997). Resource-advantage theory and the wealth of nations: Developing the socio- economic research tradition. Journal of Socio-Economics, 26(4), 335–357.
https://doi.org/10.1016/S1053-5357(97)90001-9
Kim, J., Jhang, J., Kim, S. (Sam), & Chen, S. C. (2021). Effects of concealing vs. displaying prices on consumer perceptions of hospitality products. International Journal of Hospitality Management, 92(Januari 2021), 102708. https://doi.org/10.1016/j.ijhm.2020.102708
Kotler, P., & Armstrong, G. (2015). Principles of marketing-global edition. Pearson.
Liu, C.-H. S., & Lee, T. (2016). Service quality and price perception of service: Influence on word-of-mouth and revisit intention. Journal of Air Transport Management, 52(April 2016), 42–54. https://doi.org/10.1016/j.jairtraman.2015.12.007
Liu, Y., Fernandez, J., Pu, Z., Zhang, H., Cao, L., Aguilar, I., Ritz, D., Luo, R., Read, A., Laures, A., Lan, K., Ubiera, A., Smith, A., Patel, P., & Liu, A. (2020). Simultaneous Monitoring and Comparison of Multiple Product Quality Attributes for Cell Culture Processes at Different Scales Using a LC/MS/MS Based Multi-Attribute Method. Journal of Pharmaceutical Sciences, 109(11), 3319–3329. https://doi.org/10.1016/j.xphs.2020.07.029 Lv, Z., Jin, Y., & Huang, J. (2018). How do sellers use live chat to influence consumer purchase
decision in China? Electronic Commerce Research and Applications, 28, 102–113.
https://doi.org/10.1016/j.elerap.2018.01.003
Piveteau, P., & Smagghue, G. (2019). Estimating firm product quality using trade data. Journal of International Economics, 118, 217–232. https://doi.org/10.1016/j.jinteco.2019.02.005 Rybaczewska, M., Sparks, L., & Sułkowski, Ł. (2020). Consumers’ purchase decisions and
employer image. Journal of Retailing and Consumer Services, 55(February), 0–7.
https://doi.org/10.1016/j.jretconser.2020.102123
Shafeey, T. El, & Trott, P. (2014). Resource-based competition: Three schools of thought and thirteen criticisms. European Business Review, 26(2), 122–148.
https://doi.org/10.1108/EBR-07-2013-0096
Steinhauser, J., Janssen, M., & Hamm, U. (2019). Consumers’ purchase decisions for products with nutrition and health claims: What role do product category and gaze duration on claims play? Appetite, 141(June), 104337. https://doi.org/10.1016/j.appet.2019.104337
Sugiyono. (2017). Metode Penelitian Kuantitatif, Kualitatif, dan R & D (Quantitative Research
Methods, Qualitative, and R & D). Alfabeta.
Vargo, S. L. (2007). On A Theory of Markets and Marketing: From Positively Normative to Normatively Positive. Australasian Marketing Journal, 15(1), 53–60.
https://doi.org/10.1016/S1441-3582(07)70029-0
Yu, Y., Wang, Y., & Liu, Y. (2020). Product quality and quantity with responsive pricing.
International Journal of Production Research.
https://doi.org/10.1080/00207543.2020.1836418
Zhang, H., Zhao, Z., Nie, B., Lyu, C., & Liu, X. (2021). Selenium loss and changes in product quality during cooking of selenium enriched potato tubers. Journal of Food Composition and Analysis, 96(1), 103728. https://doi.org/10.1016/j.jfca.2020.103728
Zhang, Z., Wang, P., & Xu, H. (2020). Executives’ preference for integrity and product quality:
Evidence from the Chinese food industry. Economic Modelling, 90(Agustus 2020), 374–
385. https://doi.org/10.1016/j.econmod.2019.11.026
Table 1. Normality Test
One-Sample Kolmogorov-Smirnov Test
Unstandardized Residual
N 100
Normal Parametersa,b Mean 0E-7
Std. Deviation 1.83803364
Most Extreme Differences Absolute .035
Positive .032
Negative -.035
Kolmogorov-Smirnov Z .352
Asymp. Sig. (2-tailed) 1.000
a. Test distribution is Normal.
b. Calculated from data.
Source: Processed primary data, 2020
Table 2. Multicollinearity test
Coefficients
Model Collinearity Statistics Conclusions
Tolerance VIF
Product quality .872 1.146 Non Multicollinearity Brand-image
resonance
.873 1.146 Non Multicollinearity
Price perception .987 1.013 Non Multicollinearity Source: Processed primary data, 2020
Table 3. Linearity test based on the linearity value
ANOVA Table
Sum of Squares
Df
Mean
Square F Sig.
Purchase decision*
Product quality Linearity 108.148 1 108.148 25.377 .000
Purchase decision *Linearity 116.445 1 116.445 26.871 .000
Brand image resonance Purchase decision * Price
perception Linearity 40.437 1 40.437 8.342 .005
Table 4. Multiple regression analysis
Coefficientsa
Unstandardized Coefficients
Standardized Coefficients Beta
Model B Std. Error
1. (Constant) -1.906 3.000
Product quality .317 .088 .314
Brand-image Resonance
.276 .071 .341
Price perception .299 .113 .217
Table 5. F test
ANOVAa
Model Sum of
Squares Df Mean
Square F Sig.
1 Regression 190.502 3 63.501 18.227 ,000b
Residual 334.458 96 3.484
Total 524.960 99
a. Dependent Variable: Purchasing decision
b. Predictors: (Constant), Price Perception, Brand image resonance, Product quality
Table 6. t-test
Coefficientsa
Model t Sig.
(Constant) -.635 ,527
1 Product quality 3.596 ,001
Brand-image 3.906 ,000
Resonance
Price perception 2.642 ,010
Table 7. Coorelation coefisient (r) and determinant coeficient
Variable Partia l
Categoy Determinant Coeficient (%)
r table Conclusion Product
quality 0.345 weak 11.90% 0.196 signinifcant
Brand-image
Resonance 0.370 weak 13,69% 0.196 signinifcant
Price
perception 0.260 weak 6,76% 0.196 signinifcant
Simultaneousl
y 0.602a Kuat 36,3% 0.196 signinifcant
Figure 1. Heteroskedasticity test