Jurnal Bidang Ilmu Ekonomi
http://journal.umpo.ac.id/index.php/ekuilibrium
© 2018 Universitas Muhammadiyah Ponorogo. All rights reserved
*Corresponding Author: Muchdie
E-mail: [email protected] ISSN 1858-165X (Print) ISSN 2528-7672 (Online) Sector and Country Balance of Trade Analysis Based on World Input-Output
Database: Indonesian Economy Muchdie1, Emaridial Ulza2, Edi Setiawan3 Muhammadiyah University of Prof. DR. HAMKA123
Abstract
This paper analyses trade balance in the Indonesian economy by using Indonesia input- output tables for the year 2000, 2005, 2010 and 2014. The results showed that, firstly, Indonesian export had been increased significantly during the year of study. Secondly, Indonesian import had also increased significantly during the year of study. Important sectors and countries’ trade partners of export and import had been indicated. Thirdly, trade balances in Indonesia economy were surpluses in all years of the study. Sectors and countries in which trade balances were deficits and surpluses had also been clearly indicated.
Keywords: export, import, trade balance
Abstrak
Makalah ini menganalisis neraca perdagangan dalam perekonomian Indonesia dengan menggunakan tabel input-output Indonesia untuk tahun 2000, 2005, 2010 dan 2014.
Hasilnya menunjukkan bahwa, pertama, ekspor Indonesia telah meningkat secara signifikan selama tahun penelitian. Kedua, impor Indonesia juga meningkat secara signifikan selama tahun penelitian. Sektor-sektor penting dan mitra perdagangan ekspor dan impor negara telah diindikasikan. Ketiga, neraca perdagangan dalam perekonomian Indonesia merupakan surplus dalam semua tahun penelitian. Sektor- sektor dan negara-negara di mana neraca perdagangan mengalami defisit dan surplus juga telah ditunjukkan dengan jelas.
Kata kunci : ekspor, impor, neraca perdagangan INTRODUCTION
The trade balance is the important element in Balance of Payment, which is the record of all economic transactions between the residents of the country and of the world in a particular period (Levi, 2009). The balance of trade is the difference between the monetary value
of a nation's exports and imports over a certain period (O'Sullivanand Sheffrin, 2003). If a country exports greater than it imports, it has a trade surplus. If a country imports greater than it exports, it has a trade deficit.
Exports are the goods and services produced in one country and purchased
by citizens of another country. It doesn't matter what the good or service is. It doesn't matter how it is sent. It can be shipped, sent by email, or carried in personal luggage on a plane. Whether it is produced domestically or it is sold to someone from a foreign country, it is an export. The term export means sending goods or services produced in one country to another country. The seller of such goods and services is referred to as an exporter; the foreign buyer is referred to as an importer (Joshi, 2005; 2009).
Most countries want to increase their exports. Their companies want to sell more. If they have sold all they can their own country's population, then they want to sell overseas as well. The more they export, the greater they get competitive advantages. That's because they gain expertise in producing goods and services. They also gain knowledge about how to sell to foreign markets.
Imports consist of transactions in goods and services to a resident of a jurisdiction such as a nation from non- residents (Lequiller and Blades, 2006).
An import of a good occurs when there is a change of ownership from a non- resident to a resident. Imports of services consist of all services rendered by non-residents to residents. In national accounts, import includes and excludes specific "borderline" cases. In macroeconomic theory, the value of imports can be modeled as a function of the domestic absorption and the real exchange rate Burda (2005). There are two basic types of import: industrial and consumer goods and intermediate goods and services. Companies import goods and services to supply to the domestic
market at a lower price and better quality than competing goods manufactured in the domestic market.
One of the objectives of developing World Input-Output Database (WIOD) is to analyze the effects of globalization on trade patterns, environmental pressures and socio-economic development across a wide set of countries (Timmer, et al., 2012). WIOD 2016 release covers all trade between forty-three countries as well as with a “rest-of-the-world” region (Timmer et al., 2016). Basically, a world input-output table (WIOT) is an extension of the national input-output table. The difference with the national tables is that the use of products is broken down according to their origin and destination. For a country, flows of products both for intermediate and final use are split into domestically produced or imported. Output produced by a country is either consumed domestically or exported (Miller and Blair, 1985).
Indonesia is the largest economy in Southeast Asia and is one of the emerging market economies of the world. The country is also a member of G-20 major economies and classified as a newly industrialized country (Worldbank, 2017). It is the sixteenth largest economy in the world by nominal GDP and is the seventh largest in terms of GDP (PPP). Its GDP per capita, however, ranks below the world average.
Indonesia still depends on domestic market, and government budget spending and its ownership of state- owned enterprises and the administration of prices of a range of basic goods including, rice, and electricity plays a significant role in
Indonesia market economy, but since the 1990s, the majority of the economy has been controlled by private Indonesians and foreign companies (Adhi, 2015).
The objective of this paper is to analyze trade balance in Indonesian economy usingIndonesiaworld input- output tables of years 2000, 2005, 2010 and 2014 derived from WIOT 2016.
LITERATURE REVIEW
The trade balance, also known as the balance of trade (BOT), is the calculation of a country's exports minus its imports. When a country imports more than it exports, the resulting negative number is called a trade deficit.
When the opposite is true, a country has a trade surplus. The balance of trade is the difference between the monetary value of a nation's exports and imports over a certain period (O’Sullivan and Sheffrin, 2003; Levi, 2009). Sometimes a distinction is made between a balance of trade for goods versus one for services.
The balance of trade forms part of the current account, which includes other transactions such as income from the net international investment position as well as international aid. If the current account is in surplus, the country's net international asset position increases correspondingly. Equally, a deficit decreases the net international asset position.
Exports are the goods and services produced in one country and purchased by citizens of another country. It doesn't matter what the good or service is. It doesn't matter how it is sent. It can be shipped, sent by email, or carried in personal luggage on a plane. Whether it
is produced domestically or it is sold to someone from a foreign country, it is an export. The term export means sending goods or services produced in one country to another country. The seller of such goods and services is referred to as an exporter; the foreign buyer is referred to as an importer (Joshi, 2005; 2009).
Most countries want to increase their exports. Their companies want to sell more. If they have sold all they can their own country's population, then they want to sell overseas as well. The more they export, the greater they get competitive advantages. That's because they gain expertise in producing goods and services. They also gain knowledge about how to sell to foreign markets.
Governments encourage exports.
That's because it will increase job opportunities, bring higher wages and raise the standard of living for the people. They become happier and more likely to support their national leaders.
Exports also increase the foreign exchange reserves held in the nation's central bank. That's because foreigners pay for exports either in their own currency or the U.S. dollar. A country with large reserves can use it to manage their own currency's value. They have enough foreign currency to flood the market with their own currency. That lower the cost of their exports in other countries. Countries also use currency reserves to manage liquidity. That means they can be better to control inflation, which is too much money chasing too few goods. That decreases the money supply, making the local currency worth more (Hill, 2015).
Exporting has two distinct
advantages. First, it avoids the often- substantial cost of establishing manufacturing operations in the host country (Hill, 2015). Second, exporting may help a company achieve experience curve effects and location economies (Hill, 2015). Exporting has a number of drawbacks. Firstly, exporting from the firm's home base may not be appropriate if lower-cost locations for manufacturing the product can be found abroad. It may be preferable to manufacture where conditions are most favorable to value creation and to export to the rest of the world from that location (Hill, 2015). A second drawback to exporting is that high transport cost can make exporting uneconomical, particularly for bulk products. One way to fix this is to manufacture bulk products regionally (Hill, 2015). Another drawback is that high tariff barriers can make exporting uneconomical and very risky (Hill, 2015). For small and medium enterprises (SMEs) with fewer than 250 employees, selling goods and services to foreign markets can be more difficult than serving the domestic market. The lack of knowledge of trade regulations, cultural differences, different languages, and foreign-exchange situations, as well as the strain of resources and staff, interact like a block for exporting.
Indeed, there are some SMEs which are exporting, but nearly two-thirds of them sell to only one foreign market (Daniel, et al., 2007). Motivational factors are "all those factors triggering the decision of the firm to initiate and develop export activities". In the literature, export barriers are divided into four large categories: motivational, informational,
operational/ resource-based, and special knowledge (Seringhouse, 1990). In addition, export motivators are divided into five dimensions; reaction, marketing, export, technology, external (Stouraitis, et al., 2017). Research shows that exporters are more favorable to motivators than non-exporters (Leonidou, et al., 2007).
An import is a good brought into a jurisdiction, especially across a national border, from an external source. The party bringing in the good is called an importer (Joshi, 2009). An import in the receiving country is an export from the sending country. Importation and exportation are the defining financial transactions of international trade. In international trade, the importation and exportation of goods are limited by import quotas and mandates from the customs authority. Imports consist of transactions in goods and services to a resident of a jurisdiction such as a nation from non-residents (Lequiller and Blades, 2006). An import of a good occurs when there is a change of ownership from a non-resident to a resident. Imports of services consist of all services rendered by non-residents to residents. In national accounts, import includes and excludes specific
"borderline" cases. In macroeconomic theory, the value of imports can be modeled as a function of the domestic absorption and the real exchange rate (Burda, 2005). There are two basic types of import: industrial and consumer goods and intermediate goods and services. Companies import goods and services to supply to the domestic market at a lower price and better
quality than competing goods manufactured in the domestic market.
Trinh et al (2008) explained that imported intermediate input was shown in the usual Keynesian foreign trade multiplier analysis.
METHOD
An input-output table records the
“flows of products from each industrial sector considered as a producer to each of the sectors considered as consumers”
(Miller & Blair, 1985). It is an “excellent descriptive device” and a powerful analytical technique (Jensen et.al., 1979).
In the production process, each of these industries uses products that were produced by other industries and produces outputs that will be consumed by final users (for private consumption, government consumption, investment and exports) and also by other industries, as inputs for intermediate consumption (Oosterhaven & Stelder, 2007; Timmer et al. (2015).
The columns of the input composition are the total supply of each product j (Xj); this is comprised by the national production and also by imported products. The value of a domestic product consists of intermediate consumption of several industrial inputs I plus value added. The interindustry transactions table is a nuclear part of this table, in the sense that it provides a detailed portrait of how the different economic activities are interrelated. Since intermediate consumption is of the total-flow type, this implies that true technological relationships are being considered. In fact, each column of the intermediate
consumption table describes the total amount of each input i consumed in the production of output j, regardless of the geographical origin of that input.
The input-output interconnections can be translated analytically into accounting identities. On the demand perspective, if Zij denotes the intermediate use of product i by industry j and yi denote the final use of product i, we may write, to each of the n products:
Xi = Zi1 + Zi2 + … + Zii + … + Zin + yi (1) On the supply side, we know that:
Xj = Z1j + Z2j + ...+ Zji+… + Znj + wj + mj(2) in which wj stands for value added in the production of j and mj for total imports of product j. It is required that, for i = j, xi = xj, i.e., for one specific product, the total output obtained in the use or demand perspective must equal the total output achieved by the supply perspective. These two equations can be easily related to the National Accounts’
identities. In general term, equation (1) can be written as:
x = Ax + y or x = (I - A)-1y (3) National Input-Output Table of Indonesia for the year 2000, 2005, 2010 and 2014 are available from World Input-Output Data Base (Timmeret al, 2016; 2015). Calculation on total input, output exported to other countries, imported input from other countries, and multipliers were based on the 30 sectors classification of China National Tables.
Import is calculated as summation of input come from other-countries andexport is calculated as summation of output demanded by other-countries.
Sector classifications and country abbreviations are available in Appendix 1 and Appendix 2.
RESULT AND DISCUSSION Indonesian Export
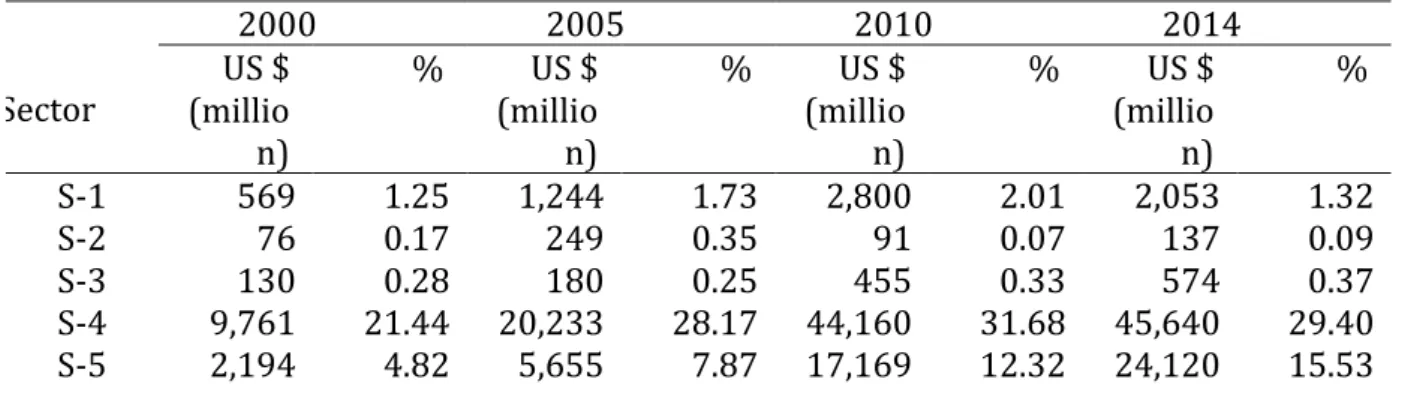
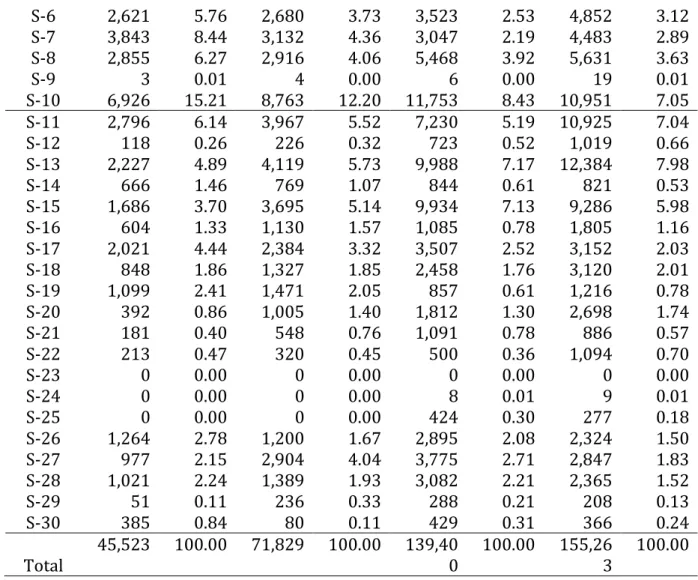
Table 1 provides information on Indonesia export to other countries for the year of 2000, 2005, 2010 and 2014.In the year of 2000, total Indonesia export was 45,523 million US$. The sector with highest percentage of export was Sector- 4 (21.44%), followed by Sector-10 (15.21%). The sector with the lowest percentage of export was Sector-23, Sector-24, and Sector-25 (0.00% each).
Several other sectors with significant contribution to Indonesian import were:
Sector-7 (8.44%), Sector-8 (6.27%), Sector-11 (6.14%), Sector-6 (4.76%), Sector-13 (4.89%), Sector-5 (4.82%), Sector-17 (4.44%), and Sector-15 (3.70%).
In the year of 2005, total Indonesian export was US$ 71,829 million; increased more than one and a half times of that in the year of 2000. The sector with highest percentage of export was Sector-4 (28.17%). The sector with the lowest percentage of export was Sector-9, Sector-23, Sector-24 and Sector-25 (0.00% each). Several other sectors with significant contribution to Indonesian import were: Sector-10 (12.20%), Sector-5 (7.87%), Sector-13
(5.73%), Sector-11 (5.52%), Sector-15 (5.14%), Sector-7 (4.36%), Sector-8 (4.06%), Sector-27 (4.04%), Sector-6 (3.73%), and Sector-17 (3.32%).
In the year of 2010, total Indonesian export was US$ 139,400 million; increased more than twice of that in the year of 2005. The sector with highest percentage of export was Sector- 4 (31.68%). The sector with the lowest percentage of export was Sector-23 (0.00%) and Sector-9 (0.00%). Several other sectors with significant contribution to Indonesian export were:
Sector-5 (12.32%), Sector-10 (8.43%), Sector-13 (7.17%), Sector-15 (7.13%), and Sector-8 (3.92%).
In the year of 2014, total Indonesian export was US$ 155,263 million; increased a little bit of that in the year of 2010. The sector with highest percentage of export was Sector-4 (29.40%). The sector with the lowest percentage of export was Sector-23 (0.0%). Several other sectors with significant contribution to Indonesian export were: Sector-5 (15.53%), Sector- 13 (7.98%), Sector-10 (7.05%), Sector- 11 (7.04%), Sector-15 (5.98 %), Sector-8 (3.63%), and Sector-17 (3.12%).
Table 1: Export by Sector in Indonesian Economy: 2000, 2005, 2010, and 2014.
Sector
2000 2005 2010 2014
US $ (millio
n)
% US $ (millio
n)
% US $ (millio
n)
% US $ (millio
n)
%
S-1 569 1.25 1,244 1.73 2,800 2.01 2,053 1.32
S-2 76 0.17 249 0.35 91 0.07 137 0.09
S-3 130 0.28 180 0.25 455 0.33 574 0.37
S-4 9,761 21.44 20,233 28.17 44,160 31.68 45,640 29.40 S-5 2,194 4.82 5,655 7.87 17,169 12.32 24,120 15.53
S-6 2,621 5.76 2,680 3.73 3,523 2.53 4,852 3.12 S-7 3,843 8.44 3,132 4.36 3,047 2.19 4,483 2.89 S-8 2,855 6.27 2,916 4.06 5,468 3.92 5,631 3.63
S-9 3 0.01 4 0.00 6 0.00 19 0.01
S-10 6,926 15.21 8,763 12.20 11,753 8.43 10,951 7.05 S-11 2,796 6.14 3,967 5.52 7,230 5.19 10,925 7.04
S-12 118 0.26 226 0.32 723 0.52 1,019 0.66
S-13 2,227 4.89 4,119 5.73 9,988 7.17 12,384 7.98
S-14 666 1.46 769 1.07 844 0.61 821 0.53
S-15 1,686 3.70 3,695 5.14 9,934 7.13 9,286 5.98
S-16 604 1.33 1,130 1.57 1,085 0.78 1,805 1.16
S-17 2,021 4.44 2,384 3.32 3,507 2.52 3,152 2.03
S-18 848 1.86 1,327 1.85 2,458 1.76 3,120 2.01
S-19 1,099 2.41 1,471 2.05 857 0.61 1,216 0.78
S-20 392 0.86 1,005 1.40 1,812 1.30 2,698 1.74
S-21 181 0.40 548 0.76 1,091 0.78 886 0.57
S-22 213 0.47 320 0.45 500 0.36 1,094 0.70
S-23 0 0.00 0 0.00 0 0.00 0 0.00
S-24 0 0.00 0 0.00 8 0.01 9 0.01
S-25 0 0.00 0 0.00 424 0.30 277 0.18
S-26 1,264 2.78 1,200 1.67 2,895 2.08 2,324 1.50
S-27 977 2.15 2,904 4.04 3,775 2.71 2,847 1.83
S-28 1,021 2.24 1,389 1.93 3,082 2.21 2,365 1.52
S-29 51 0.11 236 0.33 288 0.21 208 0.13
S-30 385 0.84 80 0.11 429 0.31 366 0.24
Total 45,523 100.00 71,829 100.00 139,40
0 100.00 155,26
3 100.00 Source: Calculated from WIOT, result.
During the year of study, increasing trend in Indonesian export occurred in Sector-4 (21.44% in 2000, 28.17% in 2005, 31.68% in 2010 and 29.40% in 2014), Sector-5 (4.82% in 2000, 7.87% in 2005, 12.32% in 2010 and 15.53% in 2014), Sector-13 (4.89% in 2000, 5.73% in 2005, 7.17% in 2010 and 7.89% in 2014), and Sector-15 (3.7% in 2000, 5.14% in 2005, 7.13% in 2010 and 5.98% in 2014). Decreasing trend in Indonesian export experienced by Sector-6 (5.7% in 2000, 3.73% in 2005, 2.53% in 2010 and 3.12% in 2014), Sector-7 (8.44% in 2000, 4.36% in 2005, 2.19% in 2010 and 2.89% in 2014), Sector-8 (6.27% in 2000, 4.06% in 2005, 3.29% in 2010, and 3.63% in 2014), Sector-10 (15.21% in 2000, 12.20% in 2005, 8.43% in 2010 and 7.05% in 2014), and Sector-17 (4.44% in 2000, 3.32% in 2005, 2.52% in 2010 and 2.03% in 2014).
Table 2 provides information on destination countries of Indonesian export for the year of 2000, 2005, 2010 and 2014. In the year of 2000, if export to the Rest of the World is excluded in analysis, the highest percentages of Indonesian export were to Japan (23.66%) and Korea (10.48%). Several other countries of destination that had imported significant Indonesian goods and services in the year of 2000 were: the USA (7.40%), China (6.57%), Taiwan (3.73%) and Australia (3.47%).
Table 2: Export by Country of Destination in Indonesian Economy: 2000, 2005, 2010, and 2014.
Country 2000 2005 2010 2014
US $ (millio
n)
% US $ (millio
n)
% US $ (millio
n)
% US $ (millio
n)
%
AUS 1,581 3.47 2,926 4.07 4,837 3.47 4,481 2.89
AUT 29 0.06 32 0.04 47 0.03 61 0.04
BEL 313 0.69 276 0.38 403 0.29 395 0.25
BGR 35 0.08 46 0.06 14 0.01 51 0.03
BRA 281 0.62 507 0.71 1,883 1.35 2,168 1.40
CAN 343 0.75 324 0.45 600 0.43 776 0.50
CHE 44 0.10 43 0.06 72 0.05 80 0.05
CHN 299,10
5 6.57 6,645 9.25 16,175 11.60 17,269 11.12
CYP 20 0.04 10 0.01 9 0.01 7 0.00
CZE 11 0.02 37 0.05 138 0.10 82 0.05
DEU 706 1.55 935 1.30 1,772 1.27 2,108 1.36
DNK 113 0.25 123 0.17 174 0.12 197 0.13
ESP 541 1.19 861 1.20 1,457 1.05 1,816 1.17
EST 1 0.00 6 0.01 24 0.02 62 0.04
FIN 64 0.14 93 0.13 85 0.06 77 0.05
FRA 370 0.81 416 0.58 668 0.48 845 0.54
GBR 729 1.60 657 0.91 941 0.67 896 0.58
GRC 40 0.09 68 0.09 103 0.07 96 0.06
HRV 4 0.01 7 0.01 20 0.01 14 0.01
HUN 72 0.16 53 0.07 65 0.05 75 0.05
IND 1,071 2.35 2,751 3.83 6,332 4.54 7,536 4.85
IRL 31 0.07 58 0.08 72 0.05 90 0.06
ITA 707 1.55 620 0.86 1,290 0.93 1,851 1.19
JPN 10,770 23.66 16,947 23.59 19,516 14.00 19,819 12.77 KOR 4,769 10.48 6,335 8.82 10,514 7.54 8,999 5.80
LTU 1 0.00 4 0.01 10 0.01 18 0.01
LUX 2 0.00 7 0.01 13 0.01 11 0.01
LVA 0 0.00 7 0.01 5 0.00 23 0.01
MEX 300 0.66 333 0.46 632 0.45 833 0.54
MLT 1 0.00 1 0.00 2 0.00 3 0.00
NLD 794 1.74 1,059 1.47 2,530 1.81 2,845 1.83
NOR 21 0.05 48 0.07 61 0.04 82 0.05
POL 45 0.10 84 0.12 183 0.13 315 0.20
PRT 21 0.05 60 0.08 72 0.05 83 0.05
ROU 9 0.02 27 0.04 26 0.02 66 0.04
RUS 33 0.07 111 0.15 551 0.40 615 0.40
SVK 4 0.01 16 0.02 46 0.03 20 0.01
SVN 28 0.06 32 0.04 86 0.06 74 0.05
SWE 43 0.09 98 0.14 86 0.06 95 0.06
TUR 171 0.38 524 0.73 988 0.71 1,757 1.13
TWN 1,697 3.73 2,003 2.79 7,063 5.07 6,913 4.45 USA 3,367 7.40 3,115 4.34 5,404 3.88 7,274 4.69 ROW 13,350 29.33 23,521 32.75 54,428 39.04 64,389 41.47 TOTAL 45,523 100.00 71,829 100.00 139,40
0 100.00 155,26
3 100.00 Source: Calculated from WIOT, result.
In the year of 2005, the highest percentages of Indonesian export were to the Japan (23.59%). Several other countries of destination that imported significant Indonesian goods and services in the year of 2005 were: (China 9.25%), Korea (8.82%), the USA (4.34%), Australia (4.07%), and India (3.83%).
In the year of 2010, the highest percentages of Indonesian export were to the Japan (14.00%). Several other countries of destination that imported significant Indonesian goods and services in the year of 2010 were: China (11.60%), Korea (7.54%), Taiwan (5.07%), India (4.54%) and Australia (3.47%).
In the year of 2014, the highest percentages of Indonesian export were to the Japan (12.77%). Several other countries of destination that imported significant Indonesian goods and services in the year of 2010 were: China (11.12%), Korea (5.80%), India (4.85%), the USA (4.69%), and Taiwan (4.45%).
During the year of study, the trend in increasing Indonesia export were export to China (6.57% in 2000, 9.25%
in 2005, 11.60% in 2010 and 11.12% in 2014) and India (2.35% in 2000, 3.83%
in 2005, 4.54% in 2010 and 4.85% in 2014. The trend of decreasing Indonesian export were export to Australia (3.47% in 2000, 4.07% in 2005, 3.47% in 2010 and 2.89% in
2014), Japan (23.66% in 2000, 23.59%
in 2005, 14.00% in 2010 and 12.77% in 2014), Korea (10.48% in 2000, 8.82% in 2005, 7.54% in 2010 and 5.80% in 2014) and the USA (7.40% in 2000, 4.34% in 2005, 3.88% in 2010, and 4.69% in 2014).
Indonesian Import
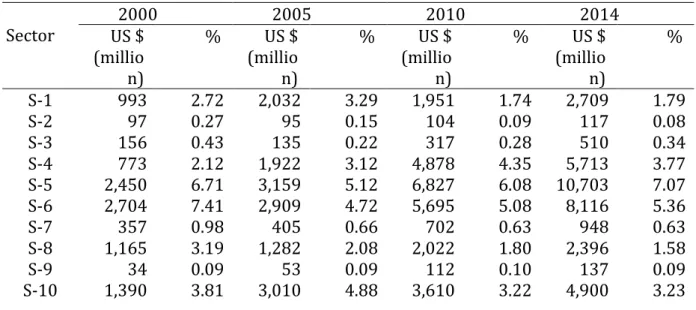
Table 3 provides information on Indonesian import from other countries for the year of 2000, 2005, 2010 and 2014. Total import has increased from US$ 36,518 million in 2000 to US$
61,670 million in 2005 (almost twice compared to that in 2000) to US$
112,211 million in 2010 (almost twice compared to that in 2005) then to US$
155,263million in 2014.In the year of 2000, highest Indonesian import was by Sector-26 (13.48%), meanwhile the lowest Indonesian imports were by Sector-23 (0.02%). Some sectors with significant percentage of import were:
Sector-25 (9.45%), Sector-27 (8.87%), Sector-6 (7.41%), Sector-5 (6.71%), Sector-28 (5.77%), Sector-11 (4.20%), Sector-13 (3.87% %), Sector-10 (3.81%), Sector-15 (3.34%), Sector-20 (3.28%), Sector-8 (3.19%), and Sector- 19 (3.08%).
In the year of 2005, the highest percentage of Indonesian import was by Sector-25 (11.43%); meanwhile the lowest Indonesian imports were by Sector-23 (0.00%). Some sectors with significant percentage of import were:
Sector-26 (8.57%), Sector-27(7.79%), Sector-28 (6.60%), Sector-20 (6.44%), Sector-5 (5.12 %), Sector-10 (4.88%), Sector-6 (4.72%), Sector-15 (4.67%), Sector-13 (3.97%), Sector-19 (3.45%), Sector-16 (1.50%), Sector-18 (3.61%), Sector-19 (4.72%), Sector-27 (4.63 %), Sector-28 (5.29%), Sector-29 (3.20 %), Sector-4 (3.12%), and Sector-24 (3.12%).
In the year of 2010, the highest percentage of Indonesian import was by Sector-25 (21.31%); meanwhile the lowest Indonesian imports were by Sector-23 (0.00%). Some sectors with significant percentage of import were:
Sector-27 (8.30%), Sector-26 (8.10%), Sector-5 (6.08%), Sector-6 (5.08%), Sector-28 (4.90%), Sector-17 (4.79%), Sector-4 (4.35%), Sector-11 (3.63%), Sector-13 (3.58%), Sector-19 (3.31%), and Sector-10 (3.32%).
In the year of 2014, the highest percentage of Indonesian import was by Sector-25 (23.071%); meanwhile the lowest Indonesian imports were by Sector-23 (0.00%). Some sectors with
significant percentage of import were:
Sector-27 (9.11%), Sector-26 (7.85%), Sector-5 (7.07%), Sector-6 (5.36%), Sector-17 (4.19%), Sector-11 (3.98%), Sector-4 (3.77%), Sector-28 (3.56%), and Sector-13 (3.19%).
During the year of study, the trend of increasing percentage in Indonesian import occurred in Sector-4 (2.2% in 2000, 3.12% in 2005, 4.35% in 2010 and 3.77% in 2014), Sector-17 (2.52% in 2000, 2.73% in 2005, 4.97% in 2010 and 4.19% in 2014) and Sector-25 (9.45% in 2000, 11.43% in 2005, 21.31% in 2010 and 23.07% in 2014). The trend of decreasing percentage in Indonesian import occurred in Sector-8 (3.19% in 2000, 2.08% in 2005, 1.80% in 2010, and 1.58% in 2014), Sector-15 (3.34% in 2000, 4.67% in 2005, 2.23% in 2010 and 2.17% in 2014), Sector-20 (3.28% in 2000, 6.44% in 2005, 2.46% in 2014 and 2.51% in 2014), Sector-26 (13.48% in 2000, 8.57% in 2005, 8.10% in 2010 and 7.85% in 2014), and Sector-28 (5.77% in 2000, 6.60% in 2005, 4.90% in 2010 and 3.56% in 2014).
Table 3: Import by Sector in Indonesian economy: 2000, 2005, 2010, and 2014.
s
Sector 2000 2005 2010 2014
US $ (millio
n)
% US $ (millio
n)
% US $ (millio
n)
% US $ (millio
n)
%
S-1 993 2.72 2,032 3.29 1,951 1.74 2,709 1.79
S-2 97 0.27 95 0.15 104 0.09 117 0.08
S-3 156 0.43 135 0.22 317 0.28 510 0.34
S-4 773 2.12 1,922 3.12 4,878 4.35 5,713 3.77
S-5 2,450 6.71 3,159 5.12 6,827 6.08 10,703 7.07 S-6 2,704 7.41 2,909 4.72 5,695 5.08 8,116 5.36
S-7 357 0.98 405 0.66 702 0.63 948 0.63
S-8 1,165 3.19 1,282 2.08 2,022 1.80 2,396 1.58
S-9 34 0.09 53 0.09 112 0.10 137 0.09
S-10 1,390 3.81 3,010 4.88 3,610 3.22 4,900 3.23
S-11 1,533 4.20 2,620 4.25 4,079 3.63 6,027 3.98
S-12 528 1.45 881 1.43 1,043 0.93 1,532 1.01
S-13 1,413 3.87 2,446 3.97 4,021 3.58 4,826 3.19
S-14 403 1.10 703 1.14 1,653 1.47 2,230 1.47
S-15 1,220 3.34 2,878 4.67 2,497 2.23 3,289 2.17 S-16 1,014 2.78 1,713 2.78 2,791 2.49 3,456 2.28
S-17 920 2.52 1,685 2.73 5,378 4.79 6,348 4.19
S-18 804 2.20 1,352 2.19 2,944 2.62 3,601 2.38
S-19 1,126 3.08 2,129 3.45 3,712 3.31 4,263 2.81 S-20 1,199 3.28 3,969 6.44 2,760 2.46 3,806 2.51
S-21 130 0.36 239 0.39 500 0.45 417 0.28
S-22 325 0.89 524 0.85 1,084 0.97 1,327 0.88
S-23 9 0.02 0 0.00 0 0.00 4 0.00
S-24 772 2.11 1,925 3.12 2,042 1.82 3,049 2.01
S-25 3,452 9.45 7,049 11.43 23,912 21.31 34,944 23.07 S-26 4,924 13.48 5,282 8.57 9,086 8.10 11,894 7.85 S-27 3,239 8.87 4,805 7.79 9,315 8.30 13,801 9.11 S-28 2,106 5.77 4,069 6.60 5,502 4.90 5,396 3.56 S-29 1,015 2.78 1,972 3.20 2,878 2.56 4,030 2.66
S-30 267 0.73 426 0.69 795 0.71 979 0.65
Total 36,518 100.00 61,670 100.00 112,21
1 100.00 151,46
7 100.00 Source: Calculated from WIOT, result.
Table 4 provides information on country of origin of Indonesian import from the year of 2000, 2005, 2010 and 2014. In the year of 2000, the highest percentages of Indonesian import were from neighbor countries such as: Japan (15.16%), and Korea (6.67%). The smallest Indonesian import was from countries such as Bulgaria (0.00%), Cyprus (0.00%), Estonia (0.00%), Croatia (0.00%), Lithuania (0.00%), Luxembourg (0.00%), Latvia (0.00%), Malta (0.00%), and Slovenia (0.00%).
Several countries of origin that had exported significant Indonesian goods and services in the year of 2000 were:
Australia (6.11%), the USA (5.59%) and China (4.66%).
In the year of 2005, the highest percentages of Indonesian import were from Japan (11.13%). Several other
countries of origin that exported significant percentage of goods and services for Indonesia in the year of 2005 were: China (7.85%), Korea (5.85%, Australia (5.73%) and the USA (3.15%). In the year of 2010, the highest percentages of Indonesian import were from China (11.48%). Several other countries of origin that exported significant goods and services to Indonesia in the year of 2010 were from Japan (10.78%), Korea 96.48%), Australian (4.01%) and the USA (3.54%). In the year of 2014, the highest percentages of Indonesian import were from China (14.28%). Several other countries of origin that exported significant goods and services to Indonesia in the year of 2010 were from Japan (8.90%), Korea (7.04%), Australia (3.49%), and the USA (3.06%).
Table 4: Import by Country of Origin in Indonesian Economy: 2000, 2005, 2010, and 2014.
Country 2000 2005 2010 2014
US $ (millio
n)
% US $ (millio
n)
% US $ (millio
n)
% US $ (millio
n)
%
AUS 2,231 6.11 3,531 5.73 4,496 4.01 5,279 3.49
AUT 119 0.33 92 0.15 194 0.17 234 0.15
BEL 184 0.51 232 0.38 361 0.32 353 0.23
BGR 1 0.00 10 0.02 24 0.02 29 0.02
BRA 387 1.06 929 1.51 2,433 2.17 3,092 2.04
CAN 428 1.17 578 0.94 640 0.57 975 0.64
CHE 179 0.49 196 0.32 358 0.32 357 0.24
CHN 1,701 4.66 4,842 7.85 12,877 11.48 21,627 14.28
CYP 0 0.00 0 0.00 1 0.00 1 0.00
CZE 6 0.02 39 0.06 56 0.05 186 0.12
DEU 960 2.63 1,260 2.04 2,043 1.82 2,403 1.59
DNK 66 0.18 101 0.16 321 0.29 214 0.14
ESP 193 0.53 163 0.26 291 0.26 418 0.28
EST 1 0.00 1 0.00 1 0.00 2 0.00
FIN 63 0.17 189 0.31 305 0.27 447 0.30
FRA 270 0.74 432 0.70 1,176 1.05 1,600 1.06
GBR 744 2.04 549 0.89 841 0.75 607 0.40
GRC 12 0.03 31 0.05 64 0.06 92 0.06
HRV 1 0.00 1 0.00 5 0.00 25 0.02
HUN 4 0.01 14 0.02 27 0.02 29 0.02
IND 555 1.52 1,448 2.35 2,516 2.24 3,576 2.36
IRL 64 0.18 74 0.12 81 0.07 95 0.06
ITA 262 0.72 395 0.64 549 0.49 1,001 0.66
JPN 5,535 15.16 6,864 11.13 12,100 10.78 13,479 8.90 KOR 2,434 6.67 3,606 5.85 7,270 6.48 10,665 7.04
LTU 0 0.00 0 0.00 10 0.01 6 0.00
LUX 2 0.00 8 0.01 3 0.00 5 0.00
LVA 0 0.00 0 0.00 2 0.00 1 0.00
MEX 47 0.13 52 0.08 101 0.09 107 0.07
MLT 0 0.00 0 0.00 1 0.00 1 0.00
NLD 450 1.23 346 0.56 846 0.75 751 0.50
NOR 22 0.06 55 0.09 129 0.11 130 0.09
POL 12 0.03 19 0.03 54 0.05 116 0.08
PRT 13 0.03 13 0.02 52 0.05 47 0.03
ROU 2 0.01 8 0.01 9 0.01 20 0.01
RUS 27 0.07 224 0.36 683 0.61 1,150 0.76
SVK 4 0.01 2 0.00 5 0.00 5 0.00
SVN 1 0.00 5 0.01 11 0.01 7 0.00
SWE 189 0.52 304 0.49 480 0.43 473 0.31
TUR 77 0.21 137 0.22 465 0.41 1,028 0.68
TWN 889 2.43 1,035 1.68 2,660 2.37 3,282 2.17
USA 2,041 5.59 1,940 3.15 4,001 3.57 4,635 3.06 ROW 16,340 44.75 31,944 51.80 53,669 47.83 72,919 48.14 TOTAL 36,518 100.00 61,670 100.00 112,21
1 100.00 151,46
7 100.00 Source: Calculated from WIOT, result.
During the years of study, the trend of increasing Indonesian import were import from China (4.66% in 2000, 7.85% in 2005, 11.48% in 2010 and 14.28% in 2014) and India (1.52% in 2000, 2.35% in 2005, 2.24% in 2010, and 2.36% in 2014). Meanwhile, the trend of decreasing Indonesian import were import from Australia (6.11% in 2000, 5.73% in 2005, 4.01% in 2010 and 3.49% in 2014), Germany (2.63% in 2000, 2.04% in 2005, 1.82% in 2010 and 1.59% in 2014), Great Britain/United Kingdom (2.04% in 2000, 0.89% in 2005, 0.75% in 2010, and 0.40% in 2014), Japan (15.16% in 2000, 11.13%
in 2005, 10.78% in 2010 and 8.90% in 2014), and the USA (5.59% in 2000, 3.15% in 2005, 3.57% in 2010 and 3.06% in 2014).
Indonesian Balance of Trade
In total balance of trade between Indonesia and her partner had been
surpluses in all years of study; 2000, 2005, 2010 and 2014. Table 5 provides information on trade balance by sector in Japan economy for the year of 2000, 2005, 2010 and 2014. In the year of 2000, trade balance in Indonesian economy was surplus by US$ 9,005 million. Sectorally, trade balances deficits were in Sector-1, Sector-2, Sector-3, Sector-5, Sector-6, Sector-9, Sector-12, Sector-16, Sector-19, Sector- 20, Sector-22, Sector-23, Sector-24, Sector-25, Sector-26, Sector-27, Sector- 28 and Sector-29. Other sectors had surplus balance of trade. In the year of 2005, trade balance in Indonesian economy was surplus by US$ 10,158 million. Sectorally, trade balance deficits were in Sector-1, Sector-6, Sector-9, Sector-12, Sector-16, Sector-18, Sector- 19, Sector-20, Sector-22, Sector-24, Sector-25, Sector-26, Sector-27, Sect or- 28, Sector-29 and Sector-30. Other sectors had surpluses balance of trade.
Table 5 Trade Balance by Sector inIndonesianEconomy (in million US$) Sector 2000 2005 2010 2014 Remarks
S-1 -424 -788 849 -656
S-2 -20 154 -12 20
S-3 -26 45 138 64
S-4 8,988 18,311 39,283 39,927 Surpluses in all years S-5 -256 2,496 10,342 13,417
S-6 -83 -229 -2,173 -3,264 Deficit in all years S-7 3,485 2,727 2,345 3,535 Surpluses in all years S-8 1,690 1,634 3,446 3,235 Surpluses in all years
S-9 -32 -50 -106 -118 Deficit in all years S-10 5,536 5,753 8,143 6,052 Surpluses in all years S-11 1,263 1,347 3,151 4,898 Surpluses in all years S-12 -409 -655 -320 -513 Deficit in all years S-13 814 1,673 5,967 7,559 Surpluses in all years S-14 263 67 -809 -1,408
S-15 466 817 7,436 5,997 Surpluses in all years S-16 -410 -583 -1,706 -1,650 Deficit in all years S-17 1,101 699 -1,871 -3,196
S-18 43 -25 -486 -481
S-19 -28 -657 -2,855 -3,048 Deficit in all years S-20 -808 -2,964 -949 -1,108 Deficit in all years S-21 51 310 591 469 Surpluses in all years S-22 -112 -204 -585 -233 Deficit in all years
S-23 -9 0 0 -4
S-24 -772 -1,925 -2,034 -3,040 Deficit in all years S-25 -3,452 -7,049 -
23,488 -
34,667 Deficit in all years S-26 -3,660 -4,082 -6,190 -9,571 Deficit in all years S-27 -2,261 -1,901 -5,540 -
10,954 Deficit in all years S-28 -1,085 -2,680 -2,421 -3,031 Deficit in all years S-29 -964 -1,736 -2,590 -3,821 Deficit in all years S-30 117 -346 -367 -613
Total 9,005 10,15
8 27,18
8 3,796 Surpluses in all years Source: Calculated from WIOT, result.
In the year of 2010, trade balance in Indonesian economy was surplus by US$ 27,188 million. Sectorally, trade balance deficits were in Sectorally, trade balances deficits were in Sector-2, Sector-6, Sector-9, Sector-12, Sector-14, Sector-16, Sector-17, Sector-18, Sector- 19, Sector-20, Sector-22, Sector-24, Sector-25, Sector-26, Sector-27, Sector- 28, Sector-29 and Sector-30. Other sectors had surpluses balance of trade.
In the year of 2014, trade balance in Indonesian economy was surplus by US$
3,796 million. Sectorally, trade balance deficits were in Sector-1, Sector-6, Sector-9, Sector-12, Sector-14, Sector-
16, Sector-17, Sector-18, Sector-19, Sector-20, Sector-22, Sector-23, Sector- 24, Sector-25, Sector-26, Sector-27, Sector-28, Sector-29 and Sector-30.
Other sectors had surpluses balance of trade. During the year of study, sectors that had experienced trade deficits in all years of study were Sector-6, Sector-9, Sector-12, Sector-16, Sector-19, Sector- 20, Sector-22, Sector-24, Sector-25, Sector-26, Sector-27, Sector-28 and Sector 29. Meanwhile, sectors that had experienced trade surpluses in all years of the study were Sector-4, Sector-7, Sector-8, Sector-10, Sector-11, Sector- 13, Sector-15, and Sector-21.
Table 6 Trade Balance by Country Origin (in million US$) Country 2000 2005 2010 2014 Remarks
AUS -650 -605 341 -798
AUT -90 -60 -147 -173 Deficit in all years BEL 129 44 42 42 Surpluses in all years
BGR 33 36 -10 22
BRA -106 -422 -550 -924 Deficit in all years CAN -86 -254 -41 -199 Deficit in all years CHE -134 -152 -286 -277 Deficit in all years CHN 297,40
4 1,803 3,299 -4,358
CYP 20 10 8 6 Surpluses in all years
CZE 5 -2 83 -104
DEU -254 -325 -271 -294 Deficit in all years
DNK 47 22 -147 -17
ESP 348 698 1,166 1,398 Surpluses in all years
EST 0 5 23 60 Surpluses in all years
FIN 1 -96 -220 -370
FRA 100 -16 -508 -755
GBR -15 109 100 289
GRC 28 37 39 4 Surpluses in all years
HRV 4 6 15 -11
HUN 68 40 39 45 Surpluses in all years
IND 516 1,303 3,816 3,960 Surpluses in all years IRL -33 -17 -9 -5 Deficit in all years ITA 446 225 741 850 Surpluses in all years JPN 5,235 10,084 7,416 6,340 Surpluses in all years KOR 2,335 2,730 3,244 -1,666
LTU 1 4 0 12 Surpluses in all years
LUX 0 -1 10 6
LVA 0 7 4 22 Surpluses in all years
MEX 253 281 531 726 Surpluses in all years
MLT 1 1 1 2 Surpluses in all years
NLD 344 713 1,684 2,093 Surpluses in all years NOR -1 -7 -68 -48 Deficit in all years POL 33 66 130 199 Surpluses in all years
PRT 9 47 20 36 Surpluses in all years
ROU 7 19 18 46 Surpluses in all years
RUS 5 -114 -132 -535
SVK 1 14 41 15 Surpluses in all years
SVN 27 27 75 66 Surpluses in all years
SWE -147 -206 -394 -378 Deficit in all years TUR 94 386 523 729 Surpluses in all years TWN 808 968 4,404 3,631 Surpluses in all years USA 1,327 1,175 1,403 2,640 Surpluses in all years ROW -2,990 -8,423 760 -8,530
TOTAL 9,005 10,158 27,188 3,796 Surpluses in all years Source: Calculated from WIOT, 2016.
Table 6 provides information on trade balance by country of origin in Indonesian economy for the year of 2000, 2005, 2010 and 2014. In the year of 2000, trade balance in Indonesian economy was surplus by US$ 9,005 million. Spatially, trade balance deficits were trade with Australia, Austria, Brazil, Canada, Switzerland, Germany, Great Britain/United Kingdom, Ireland, Norway, Sweden and the Rest of the World. Trade with other countries had surplus balance of trade. In the year of 2005, trade balance in Indonesian economy was surplus by US$ 10, 158 million. Spatially, trade balances deficits were trade with Australia, Austria, Brazil, Canada, Switzerland, Czech, Germany, Ireland, Luxembourg, Norway, Russia, Sweden and the Rest of the World. Trade with other countries had surplus balance of trade.
In the year of 2010, trade balance in Indonesian economy was deficit by US$ 27,118 million. Spatially, trade balances deficits were with Austria, Bulgaria, Brazil, Canada, Switzerland, Germany, Denmark, Finland, France, Ireland, Norway, Russia, Sweden and the Rest of the World. Trade with other countries had surplus balance of trade.
In the year of 2014, trade balance in Indonesian economy was deficit by US$
3,796 million. Spatially, trade balances deficits were with Australia, Austria, Brazil, China, Switzerland, Czech, Germany, Denmark, Finland, France, Croatia, Ireland, Korea, Norway, Russia, Sweden and the Rest of the World. Trade with other countries had surplus balance of trade.
During the year of 2000 to 2014, Indonesia experienced trade deficit in all years when trading with Australia, Brazil, Canada, Switzerland, Germany, Ireland, Norway and Sweden. Indonesia experienced trade surpluses in all years of study when trading with Belgium, Cyprus, Spain, Estonia, Greece, Hungary, India, Italy, Japan, Lithuania, Latvia, Mexico, Malta, the Netherland, Poland, Portugal, Romania, Slovakia, Slovenia, Turkey, Taiwan and the USA.
Discussions
This section highlights some important findings. Firstly, Indonesian export had been increased significantly from US$ 45,523 million in the year of 2000 to US$ 71,829 in the year of 2005 (almost twice compared to that in the year of 2000) to US$ 139,400 million in the year of 2010 (almost three time compared to that in the year of 2000 to US$ 155,263 million in the year of 2014.
Three important sectors in Indonesian export were Sector-4: Mining and quarrying (21.44% in 2000, 28.17% in 2005, 31.68 in 2010 and 29.40% in 2014), Sector-5: Manufacture of wood and of products of wood and cork, except furniture (4.82% in 2000, 7.87%
in 2005, 12.32% in 2010 and 15.53%) and Sector-10: Manufacture of basic pharmaceutical products and pharmaceutical preparations (15.21% in 2000, 12.20% in 2005, 8.43% in 2010 and 7.05% in 2014). Three important countries of Indonesian export destinations include Japan (23.66% in 2000, 23.59% in 2005, 14.00% in 2010 and 12.77% in 2014), Korea (10.48% in 2000, 8.82% in 2005, 7.54% in 2010 and
5.80% in 2014) and China (6.57% in 2000, 9.25% in 2005, 11.60% in 2010, and 11.12% in 2014).Secondly, Indonesian import had also increased during the years of study from US$36,518 million in 2000 to US$
61,670 million in 2005 (almost twice compared to that in the year of 2000) to US$112,211 million in 2010 (almost twice compared to that in the year of 2005) and to US$ 151,467 million in the year of 2014. Some important sectors in Indonesian import include sector-5:
Manufacture of wood and of products of
wood and cork, except
furniture(6.71.82% in 2000, 5.12% in 2005, 6.08% in 2010 and 7.07%), Sector-6: Manufacture of paper and paper products(7.41% in 2000, 4.72% in 2005, 5.08% in 2010 and 5.36% in 2014), Sector-25: Construction (9.45%
in 2000, 11.43% in 2005, 21.31% in 2014, and 23.07% in 2014).Three important countries of Indonesian import origin include Japan (15.16% in 2000, 11.13% in 2005, 10.78% in 2010 and 8.90% in 2014), Korea (6.67% in 2000, 5.85% in 2005, 6.48% in 2010 and 7.04% in 2014) and China (4.66% in 2000, 5.85% in 2005, 6.48% in 2010, and 7.04% in 2014).
Thirdly, trade balances in Indonesian economy during 2000 to 2014 were always surpluses. Trade surplus in the year of 2000 was US$9,005 million, in the year of 2005 was US$ 10, 158million, in the year of 2010 was US$27,188 million and in the year of 2014 was US$ 3,796 million.
Sectorally, sectors that had experienced trade surpluses in all years of the study were Sector-4, Sector-7, Sector-8,
Sector-10, Sector-11, Sector-13, Sector- 15, and Sector-21. Meanwhile, sectors that had experienced trade deficits in all years of study were Sector-6, Sector-9, Sector-12, Sector-16, Sector-19,
Sector-20, Sector-22, Sector-24, Sector-25, Sector-26, Sector-27, Sector- 28 and Sector 29. Spatially, Indonesia experienced trade surpluses in all years of study when trading with Belgium, Cyprus, Spain, Estonia, Greece, Hungary, India, Italy, Japan, Lithuania, Latvia, Mexico, Malta, the Netherland, Poland, Portugal, Romania, Slovakia, Slovenia, Turkey, Taiwan and the USA. However, Indonesia experienced trade deficit in all years when trading with Australia, Brazil, Canada, Switzerland, Germany, Ireland, Norway and Sweden.
CONCLUSIONS
World input-output databased were very useful in providing export, import and trade balance data. Three conclusions could be drawn from this study. Firstly, Indonesian export to other countries tends to increase during the year of 2000 -2014. Sectorally, three important sectors in Indonesian export were Sector-4: Mining and quarrying, Sector-5: Manufacture of wood and of products of wood and cork, except furniture, and Sector-10: Manufacture of basic pharmaceutical products and pharmaceutical preparations. Spatially, three important countries of Indonesian export destinations include Japan, Korea, and China.
Secondly, Indonesian import from other countries has also increased during the year of study. Spatially, some important sectors in Indonesian import were Sector-5: Manufacture of wood and
of products of wood and cork, except furniture, Sector-6: Manufacture of paper and paper products and Sector- 25: Construction Spatially, three important countries of Indonesian import origin include Japan, Korea, and China.
Thirdly, trade balances in Indonesian economy were surpluses in all years; 2000, 2005, 2010 and 2014.
Sectorally, there were 8 sectors that experienced trade surpluses in all years of study and 13 sectors that experienced trade deficits in all years of study.
Spatially, there were 22 countries in which Indonesian trade balance experienced surpluses in all years and 8 countries in which Indonesian trade balance experienced deficits in all years.
REFERENCES
Adhi, A (2015). 80 Persen Industri Indonesia Disebut Dikuasai Swasta,
Retrieved from
http://surabaya.tribunnews.com/2015/
03/03/80-persen-industri-indonesia- disebut-dikuasai-swasta.
Burda, W (2005). Macroeconomics:
A European Text, Fourth Edition, Oxford:
Oxford University Press.
Daniels, J, Radebaugh, L, Sullivan, D (2007).International Business:
Environment and Operations, 11th edition, New York: Prentice Hall, ISBN 0-13-186942-6
Hill, C.W.L (2015).International Business: Competing in the Global Marketplace, (15th ed.), New York:
McGraw Hill, p.454.
Jensen, R.C, Mandeville, T.D, and Karunaratne, N.D (1979). Regional Economic Planning: Generation of Regional Input-Output Analysis, Croom Helm, and London.
Joshi, R. M (2005). International Marketing, New Delhi and New York:
Oxford University Press.
Joshi, R. M (2009). International Business, New Delhi and New York:
Oxford University Press.
Leonidou, L.C, Katsikeas, C. S, Palihawadana, D, Spyropoulou, S (2007).An Analytical Review of the Factors Stimulating Smaller Firms to Export: Implications for Policy‐Makers, International Marketing Review, 24 (6):
735–770.
Lequiller, F and Blades, D (2006).
Understanding National Accounts, Paris:
OECD, pp: 139-143. Available at http://www.oecd.org/std/UNA-
2014.pdf
Levi, M. D (2009). International Finance: The Markets and Financial Management of Multinational Business, Fifth Edition, International Edition, New York: McGraw-Hill.
Miller, R.E and Blair, P.D (1985).
Input-output analysis: Foundations and Extensions, Englewood Cliffs, NJ:
Prentice-Hall, Inc.
Oosterhaven, J and Stelder, D (2007). Regional and Interregional IO Analysis, Faculty of Economics and Business University of Groningen, Groningen, the Netherlands.
O'Sullivan, Aand Sheffrin, S. M
(2003). Economics: Principles in Action, Upper Saddle River, New Jersey: Pearson Prentice Hall, pp: 462. ISBN 0-13- 063085-3.
Seringhaus, F. R (1990).
Government Export Promotion: A global perspective, Routledge, p. 1.
Stouraitis, V, Harun, M, Harris M, Kyritsis, M (2017). Motivators of SME Initial Export Choice and the European Union Regional Effect in Manufacturing, International Journal of Entrepreneurial Behaviour & Research, 23 (1): 35–55.
Timmer, M. P, Los, B, Stehrer, R and de Vries, G. J (2016). An Anatomy of the Global Trade Slowdown based on the WIOD 2016 Release, GGDC research memorandum number 162, University of Groningen, available at http://www.ggdc.net/
publications/memorandum/gd162.pdf.
Timmer, M.P, Dietzenbacher, E, Los, B, Stehrer, R and de Vries, G.J (2015). An Illustrated User Guide to the World
Input-Output Database: The Case of Global Automotive Production, Review of International Economics, 23(3): 575–
605. DOI:10.1111/roie.1217.
Timmer, M.P, Erumban, A.A, Gouma, R, Los, B, Temurshoev, U, de Vries, G.J, Arto, I, Genty, V.A, Neuwahl, F, Rueda‐
Cantuche, J.M, Alejandro Villanueva, A, Francois, J, Pindyuk, O, Pöschl, J, Stehrer,R and Streicher,G (2012). The World Input‐Output
Database (WIOD): Contents, Sources and Methods, Working Paper Number: 10, University of Groningen.
Trinh, B, Hoa, P.L and Giang, B.C (2008). Import multiplier in input- output analysis, Depocen Working Paper Series No. 2008/23.
Worldbank (2017). The World Bank In Indonesia: Having Maintained Political Stability, Indonesia is one of Asia Pacific's Most Vibrant Democracies and Is Emerging as a Confident Middle- Income Country, Retrieved from http://www.worldbank.org/en/country /indonesia/overview.
Appendix 1: Sector Classifications Sector
Code Descriptions
Sector-1 Crop and animal production, forestry, fishing and aquaculture Sector-2 Forestry and logging activities
Sector-3 Fishing and aquaculture Sector-4 Mining and quarrying
Sector-5 Manufacture of wood and of products of wood and cork, except furniture Sector-6 Manufacture of paper and paper products
Sector-7 Printing and reproduction of recorded media
Sector-8 Manufacture of coke and refined petroleum products Sector-9 Manufacture of chemicals and chemical products
Sector-10 Manufacture of basic pharmaceutical products and pharmaceutical preparations
Sector-11 Manufacture of rubber and plastic products
Sector-12 Manufacture of other non-metallic mineral products Sector-13 Manufacture of basic metals
Sector-14 Manufacture of fabricated metal products, except machinery and equipment
Sector-15 Manufacture of computer, electronic and optical products Sector-16 Manufacture of electrical equipment
Sector-17 Manufacture of machinery and equipment n.e.c.,
Sector-18 Manufacture of motor vehicles, trailers and semi-trailers Sector-19 Manufacture of other transport equipment
Sector-20 Manufacture of furniture; other manufacturing Sector-21 Repair and installation of machinery and equipment Sector-22 Electricity, gas, steam and air conditioning supply
Sector-23 Water collection, treatment and supply; Sewerage & waste: collection, treatment and disposal
Sector-24 Electricity, gas and drinking water Sector-25 Construction
Sector-26 Wholesale and retail trade and repair, accommodation and food service activities
Sector-27 Transportation, telecommunication, information and publication Sector-28 Real estate, financial and corporate services
Sector-29 Legal & management consultancy, architectures & engineering, scientific research & development
Sector-30 Other service activities Source: Aggregated from WIOT, 2016
Appendix 2: Country Abbreviations No. Acrony
m Country included No. Acronym Country included
1. AUS Australia 23. IRL Ireland
2. AUT Austria 24. ITA Italy
3. BEL Belgium 25. JPN Japan
4. BGR Bulgaria 26. KOR Korea
5. BRA Brazil 27. LTU Lithuania
6. CAN Canada 28. LUX Luxembourg
7. CHE Switzerland 29. LVA Latvia
8. CHN China 30. MEX Mexico
9. CYP Cyprus 31. MLT Malta
10 CZE Czech Republic 32. NLD Netherlands
11. DEU Germany 33. NOR Norway
12. DNK Denmark 34. POL Poland
13. ESP Spain 35. PRT Portugal
14. EST Estonia 36. ROU Romania
15. FIN Finland 37. RUS Russia
16. FRA France 38. SVK Slovak Republic
17. GBR United Kingdom 39. SVN Slovenia
18. GRC Greece 40. SWE Sweden
19. HRV Croatia 41. TUR Turkey
20. HUN Hungary 42. TWN Taiwan
21. IDN Indonesia 43. USA United States
22. IND India 44. ROW Rest of the World
Source: Processed from WIOT, 2016