Abhijit Banerjee Rema Hanna
Benjamin A. Olken Elan Satriawan Sudarno Sumarto
WORKING PAPER 60-e - 2021
MARCH 2021
FOOD VS. FOOD STAMPS:
EVIDENCE FROM AN AT-SCALE
EXPERIMENT IN INDONESIA
The TNP2K Working Paper Series disseminates the findings of work in progress to encourage discussion and exchange of ideas on poverty, social protection and development issues.
Support to this publication is provided by the Australian Government through the MAHKOTA Program.
The findings, interpretations and conclusions herein are those of the author(s) and do not necessarily reflect the views of the Government of Indonesia or the Government of Australia.
You are free to copy, distribute and transmit this work, for non-commercial purposes.
Suggested citation: Banerjee.A., Hanna.R., Olken B.A., Satriawan.E., Sumarto.S., Food vs. Food Stamps: Evidence from an At-Scale Experiment in Indonesia. TNP2K Working Paper 60-e/2021. Jakarta, Indonesia.
To request copies of this paper or for more information, please contact: [email protected] The papers are also available at the TNP2K (www.tnp2k.go.id).
THE NATIONAL TEAM FOR THE ACCELERATION OF POVERTY REDUCTION Office of the Vice President's Secretariat
Jl. Kebon Sirih Raya No.14, Jakarta Pusat, 10110
TNP2K Working Paper 60-e/2021 March 2021
Abhijit Banerjee, Rema Hanna, Benjamin A. Olken, Elan Satriawan, Sudarno Sumarto
FOOD VS. FOOD STAMPS:
EVIDENCE FROM AN AT-SCALE
EXPERIMENT IN INDONESIA
Food vs. Food Stamps: Evidence from an At-Scale Experiment in Indonesia
4
1
Food vs. Food Stamps:
Evidence from an At-Scale Experiment in Indonesia* Abhijit Banerjee, MIT
Rema Hanna, Harvard Kennedy School Benjamin A. Olken, MIT
Elan Satriawan, Gadjah Mada University and TNP2K Sudarno Sumarto, SMERU and TNP2K
March 2021
Abstract
Governments seeking to provide food assistance have a choice between providing in-kind food directly to beneficiaries, or providing vouchers that can be used to purchase food on the market. To understand the differences between these policies, the Government of Indonesia randomly phased in the transition from in-kind delivery of subsidized rice to approximately equivalent vouchers usable to buy rice and eggs across 105 districts comprising over 3.4 million beneficiary households. We find the transition led to substantial changes in the allocation of aid in practice. The vouchers provided concentrated assistance to targeted households, who received 45 percent more assistance in voucher areas than in in-kind districts. As a result, for households in the bottom 15 percent at baseline, poverty fell by 20 percent.
Vouchers also allowed households to purchase higher-quality rice, and led to increased consumption of egg-based proteins. We find vouchers have little effect on aggregate rice prices, although we observe modest price increases in remote villages. Overall leakage from the program was not affected, but the administrative costs of benefits delivery substantially fell. In short, the results suggest that the change from in-kind food aid to vouchers led to substantial impacts on poverty through the way it changed how programs were implemented on the ground.
* This project was a collaboration involving many people. We thank Aaron Berman, Isadora Frankenthal, Chaerudin Kodir, Lina Marliani, Alexa Weiss, and especially Robbie Dulin, Ivan Mahardika, and Poppy Widyasari for their outstanding research assistance on this project over several years. We thank our many Indonesian government colleagues, particularly Bambang Widianto, Vivi Yulaswati, Andi Z.A. Dulung, T.B Achmad Choesni, Maliki, M.
Oni Royani, Nurul Farijati, Herbin, Gantjang Amanullah, Priadi Asmanto, Ardi Adji, Sri Kusumastuti Rahayu, Jurist Tan, as well as many other colleagues from Bappenas, BPS, the Ministry of Social Affairs, the Coordinating Ministry for Human Development and Cultural Affairs and the Indonesian National Team for the Acceleration of Poverty Reduction for their cooperation implementing the project and data collection. We thank Amy Finkelstein and Jesse Shapiro for helpful comments. This project was financially supported by the Australian Government, the Development Innovation Ventures at USAID, and the JPAL Governance Initiative. This RCT was registered in the American Economic Association Registry for randomized control trials under trial number AEARCTR-0004675. All views expressed in the paper are those of the authors, and do not necessarily reflect the views any of the many institutions or individuals acknowledged here.
2 I. INTRODUCTION
Targeted food programs, which aim to provide nutritional assistance to the poor, are one of the most common forms of social welfare programs in the world (World Bank, 2018).1 There are two broad approaches to these programs. The first approach is an in-kind program, which distributes a set amount of free or subsided foods to poor households. In developing countries, India’s public distribution system and Egypt’s Baladi Bread program fall into this category (Alderman, Gentilini and Yemtsov, 2018); similarly, the United States recently launched and distributed more than 100 million food boxes under the “Farmers to Families Food Box” program.2 An alternative approach is a voucher program, which provides poor families with a voucher, or increasingly a pre-filled electronic debit card, which can be used to purchase particular food items at participating shops.
One of the most famous of these programs is the United States’ “Food Stamps” program, now known as the Supplemental Nutrition Assistance Program (SNAP), which has had substantial effects since it was first rolled out in 1961 (Hoynes et al., 2016, Bailey et al., 2020), but these programs are also common in developing countries, such as, for example, Egypt’s Tamween Ration Cards or Sri Lanka’s Samurdhi program.
At some level, one might expect these programs to have similar outcomes: the government can distribute a free gallon of milk to a poor household or distribute a voucher with which a household can pick up a free gallon of milk, and in the end, a household will get a gallon of milk.
However, there are a number of theoretical reasons, grounded in basic price-theory, why economists might expect that these programs could lead to different outcomes. First, voucher programs typically offer more flexibility for beneficiaries than a physically delivered in-kind food basket. If a household would normally consume less of a particular type of food that is included in the in-kind bundle absent the transfer, in-kind transfers could constrain their ultimate consumption decisions. Vouchers, by contrast, could allow households to adjust the mix of items consumed, or even the specific brands or quality mix within those items, to best suit their needs. Thus, depending on the designs of the two programs, one could observe different consumption choices, and
1 Acknowledging the importance of food assistance worldwide, the Nobel Peace Prize of 2020 was awarded to the World Food Programme (WFP) "for its efforts to combat hunger, for its contribution to bettering conditions for peace in conflict-affected areas and for acting as a driving force in efforts to prevent the use of hunger as a weapon of war and conflict.”
2 See, for example, https://www.ams.usda.gov/selling-food-to-usda/farmers-to-families-food-box
3
ultimately nutritional outcomes (see for example, Leroy et al., 2013; Hidrobo et al., 2014; Cunha, 2014; Aker, 2017; Gentilini, 2016).
Second, with in-kind food programs, the government intervenes in the market by supplying the requisite quantity of the goods in question, whereas with a voucher-based program, supply is left to the private market. If supply is elastic, this should not matter. However, with inelastic supply, this could make a difference, since in-kind programs may feature a supply shock due to the government’s role in supplying food. In particular, one may imagine that food supplies may be less elastic in remote and isolated areas with limited transport capacity, in which case in-kind transfers could reduce prices relative to voucher programs if the government is sourcing the in- kind food elsewhere and bringing it in (Coate et al., 1994; Cunha et al., 2019; Jiménez-Hernández and Seira, 2021).3 Third, in-kind programs could have important targeting properties through self- selection into the programs (Nichols and Zeckhauser, 1982; Currie and Gahvari, 2008): often times the food provided in these programs is a type of food that richer households may not particularly need a lot of, or of much lower quality, so much so that richer households may choose not to avail themselves of these programs, ensuring that limited program resources get to the poor.4 The flexibility of voucher-based programs may mean that this type of self-targeting is less effective.
However, in addition to these commonly cited reasons, these programs may differ for another important, but less frequently discussed reason: the ability on the ground to administer these programs as designed could differ dramatically. In low state-capacity environments, these administrative differences may be first-order. First, the logistical challenges of running voucher and in-kind programs are different. On the one hand, it may be easier and cheaper for governments to refill electronic vouchers each month rather than run a massive logistics operation, moving millions of tons of food to various parts of the country. On the other hand, administering debit cards raises its own set of logistical challenges: availability of cell-phone signals for debit card machines, challenges with PINs or other authentication mechanisms, or even challenges in
3 Gadenne et al (2021) also discuss how in-kind programs can effectively provide insurance against price variation by fixing the quantities provided, rather than fixing the value of subsidy provided. As we discuss below, these types of year-to-year price fluctuations are comparatively small in our setting.
4 There is also substantially larger literature in economics studying the difference between cash, which is completely flexible, and in-kind programs, as opposed to the question we focus on here of whether the in-kind assistance is actually directly delivered or delivered via vouchers. See Currie and Gahvari (2008) for a review; some more recent papers include Lieber and Lockwood (2019) on self-targeting within Medicaid in the United States; Hastings and Shapiro (2018) on mental accounting and stickiness of in-kind transfers studying SNAP in the United States; and Hidrobo et al. (2014) examining cash versus in-kind programs in Ecuador.
4
ensuring that debit cards reach the correct households (Banerjee et al., 2020; Muralidharan et al., 2020; Muralidharan et al., 2016). Second, governments using vouchers may have more control over whether targeted beneficiaries actually get their full benefits rather than having some share diverted to ineligible households, since a debit card is hard to subdivide, whereas in-kind food stocks can be divided by local government officials in whichever way that they choose in practice.5 Finally, overall leakage may differ in voucher programs: it may be easier to monitor the money as it is directly transferred to the debit cards, whereas food can “fall off the truck” at various points in the distribution process. On the other hand, it may be easier to fraudulently claim digital payments than to abscond with tons of physical rice. In short, it is ultimately an empirical question as to which of these programs can be more effective in redistributing to the poor, and to ultimately affecting poverty rates.
To study the differences between in-kind food programs and electronic voucher programs in a setting with imperfect state capacity, we conducted a unique policy experiment in cooperation with the Indonesian government. Starting in 2017, Indonesia began a national reform to replace its largest anti-poverty program—“Rastra” (an abbreviation of beRAS sejahTeRA, or Rice for Welfare), an in-kind food program that delivered 10kg of free rice per month to 15 million targeted households nationwide—with a voucher program, named “BPNT” (Bantuan Pangan Non-Tunai, or Non-Cash Food Assistance), that aimed to provide the same targeted households with a debit card that allowed them to purchase a similar value of rice and eggs from any eligible private provider. The conversions were rolled out district by district, with the districts staggered into waves, such that the government could have the funds and logistical ability to switch over each set of districts. For the 2018 round of district conversions, 105 districts were deemed ready to convert, but funds were only budgeted to cover a fraction of these districts. This allowed for random assignment: 42 of these districts were randomly assigned to receive the program over three waves in 2018, while the remaining 63 districts were assigned to receive the program in 2019.
The enormous scale of this experiment—the 105 districts in the experiment have a combined population of 53 million, or about one-fifth of Indonesia’s population, with over 3.4 million beneficiary households—allows us to study how in-kind transfers compare to voucher
5 There are, of course, many reasons why beneficiaries would not necessarily get their full voucher payment—they do not receive the debit card, they get held up by local officials or stores to process their voucher, or other non-poor community members or family members ask for a share given that the targeted household got a transfer—but the technological nature of the voucher may make it easier ensure that targeted households receive their entitlements.
5
programs through the lens of both the price theory and administration in a real world setting at a large enough scale to incorporate general equilibrium effects (Muralidharan and Niehaus, 2017;
Egger et al., 2019). To study these issues, we use three primary datasets. First, we wrote a special module that was included in three waves of the national social-economic survey (SUSENAS), which we use, as well as its detailed consumption module. Second, we merged the SUSENAS survey with the administration targeting database at the household level to both identify which households were to be targeted by the programs, as well as to provide us with baseline characteristics of these households. Third, we merged in pre-data from the village census (PODES) to provide additional baseline data and allow us to measure heterogeneity by village characteristics.
We find that switching from in-kind transfers to vouchers led to a substantial change in the allocation of aid. Whereas in-kind food aid was often subdivided and distributed to many households in villages, vouchers were not. A similar amount of total aid was distributed in both voucher and in-kind districts, but conditional on receiving benefits, a household received a subsidy worth 85 percent more in voucher areas compared to in-kind areas. The share of households receiving a transfer fell in voucher areas, but disproportionately among better-off households:
poorer households (at baseline) were 16 percent less likely to receive benefits in voucher areas, whereas wealthier households (at baseline) were 49 percent less likely to receive benefits in voucher areas. Combined, this resulted in a dramatic concentration of benefits among the poor:
poorer households (at baseline) as a group received 45 percent more assistance in voucher areas than in in-kind districts. We show that this represents substantially more aid received by those who are actually poor, rather than being an artifact of who is on the baseline eligibility list. Interestingly, the better targeting in voucher areas occurred despite the fact that the food was rated as higher quality in the voucher program, and aid was more fungible, both reasons that the vouchers could have been more appealing to richer households. The administrative benefits of being able to better enforce the targeting of the electronic transfers thus swamped the self-targeting benefits of the poor quality of food in this context.
The increased concentration of benefits among the poor in voucher areas led to a large reduction in poverty, despite the fact that some poor households did lose benefits. For households in the bottom 15 percent at baseline, the share of households below the poverty line fell by 20
6
percent (4.3 percentage points). Thus, on net, by better concentrating benefits to targeted households, the voucher program reduced poverty.
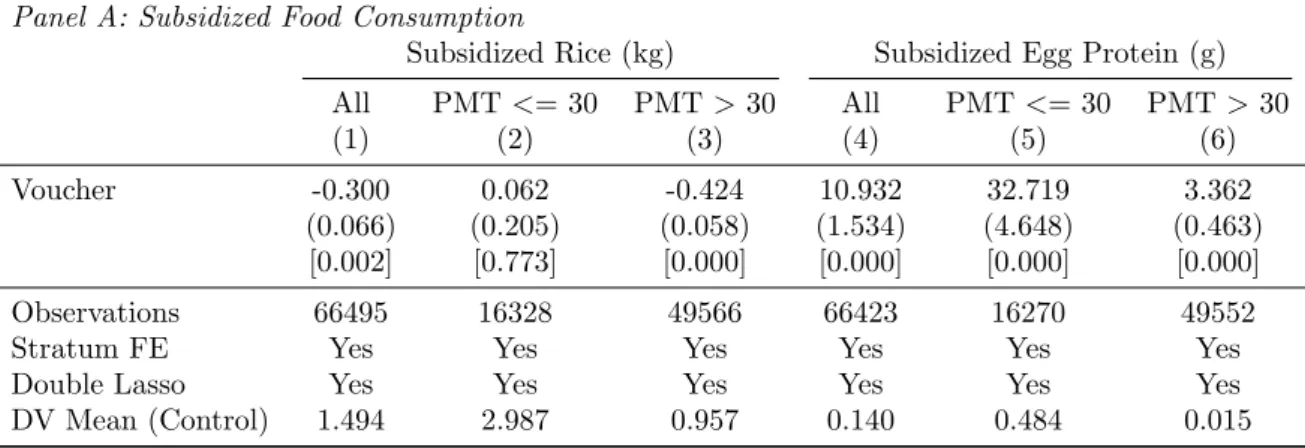
In addition to these first-order changes from increased concentration of assistance, we also examine whether some of the more traditional price-theoretic mechanisms associated with the switch to vouchers are present in this context. First, we observe some changes in types of food consumed with the switch to vouchers. Almost all households consume more rice than what was provided under the in-kind transfers—97 percent of households in in-kind areas consume more than the 10kg rice/month, and in fact, the mean household consumes about 32kg rice/month.6 Given this, one would not expect a switch in the consumption bundle from a transition from the in-kind program to the voucher program, which also allowed households to purchase eggs, since households should have been unconstrained in their rice consumption and able to adjust on other margins. Yet, the switch to vouchers led eligible households to increase their total consumption of egg-based proteins, by about 4.3 percent. We do not observe changes in any other types of food, including other proteins such as beef and chicken, suggesting that this is unlikely to represent just an income effect. Instead, it appears that there is some type of stickiness from the types of food included in the voucher programs. This suggest that governments seeking to improve nutrition can potentially do so through the set of foods they chose to include or not include in vouchers, even if, in fact, basic price theory says that unconstrained households could undo these constraints through their other purchase decisions.7
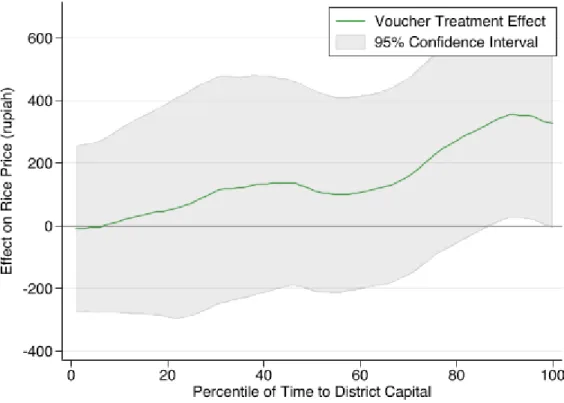
One important concern is that voucher-based programs could lead to increases in prices relative to in-kind programs, particularly in remote areas (Cunha et al., 2019). On average, we do not find any change in rice prices associated with the transition. This is true even in areas where the transition represented a larger shock (i.e., subsidized rice comprises a larger share of rice consumed in the district). We observe modest price increases in remote areas—for example, in villages in the 75th percentile or more in terms of distance we observe a 3.6 percent increase in rice prices—but even taking the price increase into account, poor households are still substantially
6 The in-kind program actually provided a mean of only 3.9kg of rice per month because it was spread among so many more beneficiaries. More than 99 percent of eligible households consumed more than 3.9kg of rice per month, so the in-kind program was likely binding for almost no one.
7 This finding is reminiscent of the findings from Hastings and Shapiro (2018) that show that households have a higher marginal propensity to consume food out of SNAP benefits than out of cash. Our findings suggest that even the types of foods consumed can be influenced by what is included in vouchers, even when this is not binding.
7
better off under the voucher program because they receive so much more assistance than in the in- kind program.
Finally, we examine the administrative costs of the programs. The administrative costs are low even for the in-kind program: the administrative costs are 4 percent of the benefits disbursed.
But, the vouchers are even lower: between 0.75 to 2 percent of benefits disbursed, depending on what portion of the financial transaction infrastructure one apportions to the program relative to other transactions. The voucher program was thus substantially less costly to administer, despite the fact that it was more effective in delivering aid to targeted beneficiaries.
In short, switching from in-kind food delivery to vouchers made a real difference in the lives of the poor, reducing poverty among the poorest households by about 20 percent. This change was due to relative gains in program administration, as the vouchers resulted in a de facto allocation that was much more concentrated among the poor, consistent with the de jure program rules in both programs. The differences that occur due to differences in how these two programs were implemented in practice—i.e., the fact that the voucher-based program delivered concentrated assistance to targeted beneficiaries, rather than being distributed much more widely in local communities—swamped the differences in the programs that stemmed from more traditional price theoretic explanations, such as the ability for households to have more choice in spending or changes in aggregate prices.
The rest of the paper proceeds as follows. Section II describes the setting and research design. Section III presents our findings on the effect of voucher versus in-kind subsidies on the delivery of assistance, consumption choices, prices and leakages. Section IV concludes.
II. SETTING, EXPERIMENTAL DESIGN, AND DATA A. Setting
In 1998, during the Asian Financial Crisis, the Indonesian government launched a new program to provide a safety net to poor households in the form of heavily subsidized rice, delivered directly to poor beneficiary households through village and local governments.8 With an annual budget of
8 Rastra is implemented by the lowest government administrative unit, known as a desa (village) in rural areas or kelurahan in urban areas. Both desa and kelurahan refer to the 4th tier of local government in rural and urban areas, respectively, below provinces, districts/cities, and subdistricts. We henceforth refer to these government units as
“villages” throughout the paper, but it is important to note that the program operates identically in both rural and urban areas nationwide.
8
US1.5 billion dollars, the subsidized rice program, called “Rastra,” aims to provide subsidized food assistance to 15 million beneficiary households per month.9 While the program has changed slightly over time, in its current form, households are entitled to receive 10kg of free rice per month, with a value of about Rp. 100,000 (US$8)/month, depending on the market price of rice (~Rp. 9,700 in our period). This is a substantial subsidy: it is about 6.5 percent of the poverty line for family of 4.
In theory, to be eligible for Rastra, targeting is conducted through proxy-means testing conducted by the central government, with the recipient list provided by the Ministry of Social Affairs. The proxy-means test was computed by conducting a census of more than 28 million households in 2015, which collected a variety of indicators that are predictive of the household’s consumption level (assets, education, etc.; see Alatas et al. (2012) and Banerjee et al. (2020) for more details).10 The National Team for the Acceleration of Poverty Reduction (TNP2K) combines these indicators into a proxy-means test score, and then computes percentiles of this score within the entire population; we use this percentile-normed score throughout the paper. In general, households with lower PMT scores are eligible for the program, with the rules varying by district and urban/rural status. Furthermore, villages are allowed some minimal changes to the recipient list through village meetings to replace households who have moved, died, or been double- counted. Excluded households can also apply to the Ministry of Social Affairs if they believe they have been excluded from the proxy-means testing (Ministry of Social Affairs, 2018). According to the 2018 official rules, villages are not officially allowed to subdivide the rice—benefit recipients must receive the full 10kg.
Rice is procured by the government through the central logistics agency (BULOG), typically stored at district-level warehouses, and then delivered to villages (often in 50kg sacks).
BULOG seeks to procure rice at approximately the market price; in our period, BULOG procures rice at Rp. 8,600/kg, which corresponds to the average sale price at rice mills for non-quality rated rice in 2017. While the program is large as an anti-poverty program, it represents only about 6
9 The program was launched in 1998 under the name Operasi Pasar Khusus (OPK, or Special Market Operations). It was renamed Raskin (an abbreviation of beRAS misKIN, or Rice for the Poor) in 2002, and renamed Rastra in 2015.
10 To comprise the sample, the government first lists everyone on the previous targeting list and asks local leaders to help update the sample list with poor and near-poor households (i.e., the goal is to exclude richer households from the list). In 2015, this resulted in 28 million households being surveyed on household composition and assets variables.
9
percent of the total rice market.11 Local level officials are tasked with dividing the rice, and delivering it to beneficiaries on the list, either at the village office, at neighborhood distribution points, or door-to-door.
In 2017, the government began their largest social assistance reform in nearly 20 years—
removing Rastra and replacing it with a targeted voucher program. The government did this for a variety of reasons. First, while there is a robust targeting procedure, it was not often followed in practice, with many non-poor households receiving rice and many beneficiaries only receiving a fraction of their entitlement (Banerjee et al., 2018). The redistribution to non-poor households in the in-kind program had been a perennial challenge that the government was unable to fully resolve despite repeated attempts, and it was believed that the voucher program could reduce the improper inclusion of non-beneficiary households. Second, and related to the first point, Rastra was known for having high levels of overall leakages—a fair share of the rice went missing (Olken, 2006), and there was a belief that the switch to vouchers could reduce this leakage. Third, the quality of Rastra rice was very low—dusty, off-color, full of rocks (Banerjee et al., 2019)—and while this could have self-targeting properties, there was a belief that the move to vouchers could improve program satisfaction by increasing rice quality. Finally, Indonesia has high levels of stunting, even conditional on income levels (Cahyadi et al., 2020), and there was a belief that the vouchers could increase food diversity by allowing households to also purchase eggs.12
The new voucher program was called Bantuan Pangan Non-Tunai (BPNT), or “Non-Cash Food Aid.” In principle, the program eligibility for BPNT was the same as Rastra. Instead of receiving rice, households received a monthly voucher of Rp. 110,000 onto a debit card that was issued to the female adult in the household. The amount was chosen to be approximately equal to the value of the subsidized Rastra rice.13
11 To calculate this, we divide the total amount of Rastra rice allocated to our study districts by an estimate of total rice consumed in those districts using baseline data from the SUSENAS. We estimate that Rastra allocations represent 6.2 percent of the total rice consumed in in-kind districts in 2018.
12 In fact, in 2020 (subsequent to the period we study here), the BPNT voucher program later morphed into a program called Program Sembako, which allowed households to buy a much wider variety of foods, including carbohydrates (rice, but also locally-prefererd carbohydrates such as corn or cassava), animal proteins (eggs, and also beef, chicken, and fish), vegetable proteins (nuts, tofu, and tempeh), as well as fruits and vegetables.
13 The Rastra rice was valued at 10kg * the market price of rice, which fluctuates around Rp. 10,000. Since Raskin rice is often delivered in neighborhoods or door-to-door, whereas BPNT is at one or two shops in the village, the BPNT amount was slightly higher to compensate for slightly higher transportation costs borne by households. Given the fluctuating price of rice, it is possible that food transfers provide some insurance against a price increase (see, for example, Gadenne et al. (2021)), but in this setting, this effect is small relative to the distributional changes we find here. To see this, note that if we examine rice price data from the last ten years, the price of rice never rose more than
10
Households could use the voucher for purchases of rice or eggs at a network for eligible small shops, i.e., shops that were registered as remote agents for the state-owned bank chosen to implement the program in the district.14 The bank provided each agent with a debit-card reader machine (EDC machine), which connected to the bank’s network over a cellular connection to debit the amount from the household’s voucher account. The voucher could not be cashed out; it could be saved for future months, but that was not always encouraged and rare in practice.15 The government required banks to increase the number of agents, with a goal of 1 agent per 250 beneficiaries in every village, with a minimum of 2 shops in every village. While the agent network did increase, and almost all villages had at least 1 shop, not all villages met the government mandated standards (Banerjee et al., 2021). Agents were allowed to source rice and eggs from the private market as they saw fit, though in practice there was pressure in some areas to source rice from the government logistics agency.
B. Sample
The conversion from Rastra to BPNT was rolled out over approximately four years, as the government had budget targets in place for the yearly conversion processes. The voucher program was first rolled out to 44 cities as a pilot in 2017. For the second phase, in 2018, the government first chose a number of districts (e.g., primarily in East Java) to definitely be converted in 2018.
The government then ranked all of the remaining districts by a readiness indicator; based on this indicator 105 districts were potentially ready to be converted next. However, given the government’s budget—they planned to convert the program for about 8.3 million beneficiary
6.4 percent higher and never fell more than 15.4 percent lower than the price we observe at the time of this study.
Thus, as we will show below, these differences in price are small relative to the substantial increase in quantity that households receive with the vouchers. Moreover, the Indonesian government can adjust the BPNT value to compensate for such macroeconomic shocks and, in fact, did exactly this in the recent COVID pandemic in which the benefit of the BPNT was increased by 25 percent (note that this is outside of the time-frame that we study), similar to other countries’ expansions of social assistance during COVID (e.g., Londoño-Vélez and Querubin, forthcoming).
14 The debit cards were issued and administered by one of the four state-owned banks, Mandiri, BRI, BNI, and BTN.
The government assigned one bank to administer the program in each district. As such, they could only be redeemed at agents of the designated bank.
15 While the central government has no way of electronically monitoring that the agents in fact only redeem vouchers for rice and eggs, they could in principle audit this. In practice, households in the SUSENAS report that more than 99 percent of the vouchers were spent on rice and eggs, and less than 1 percent on other items. The set of allowable items was expanded substantially to include other food essentials in 2020, subsequent to the period we study here.
11
households total, including the ones that were definitely chosen—they could not convert all 105 districts to BPNT in 2018.
Therefore, the government randomized which of the 105 districts would be treated in 2018, and which ones would subsequently be treated in 2019 (see Appendix Figure 1). These 105 districts—spread across Indonesia’s diverse landscape—comprise our sample (see Appendix Figure 2), encompassing about a fifth of Indonesia’s population, with a total population size of 53 million individuals and about 3.4 million targeted beneficiary households. Given the scope, as well as the fact that these were real programs conducted by the government, this sample gives us a unique opportunity to study both the general equilibrium effects and administration outcomes of moving from an in-kind to a cash transfer program.
C. Randomization Process and Compliance
We randomized at the district level, as it is the level of administration for both the in-kind and voucher programs. Forty-two districts were randomly chosen to be converted in 2018, while the remaining 63 were scheduled to be converted in 2019 (see Appendix Figure 1). The treatment districts were additionally randomized to be converted in three waves: 10 districts in May 2018, 18 in October 2018, and 14 in November 2018 (see Appendix Figure 3).
Note two aspects of the randomization. First, we grouped districts by geography, and we then stratified our randomization based on this geographic grouping. Second, the government added a constraint that it wanted the randomization results to come as close as possible to exhausting the budget of 8.3 million households (including the districts that were chosen for sure, as well as randomly chosen districts). To accomplish this, in setting up the geographic strata, we reserved the 20 districts with the smallest number of beneficiaries and put them in a special stratum. For this last stratum, we randomized order of districts, and assigned districts to treatment until assigning one more district (in randomized order) would have exceeded the 8.3 million total budget. Therefore, while the probability a given district is treated is random, the treatment probability in the holdout stratum is different than in other strata; to account for this, we include strata fixed effects in all regressions. We also show below robustness results dropping this holdout stratum entirely; results are very similar.
In practice, the randomization was followed almost exactly. All of the districts randomly chosen to receive vouchers were converted to vouchers in 2018. Only 3 of the 63 districts
12
randomized to be converted in 2019 were in fact converted in 2018; given this small number, we study the reduced form effect of being assigned to the vouchers (i.e., the intent to treat).
D. Data
In order to evaluate the experimental switch from in-kind transfers to the vouchers program, we worked with the Government of Indonesia to design a special module to be added to the SUSENAS, the Indonesian national household survey. The SUSENAS is a nationally representative household survey, completed twice annually—a large wave in March covering about 300,000 households and a smaller wave in September covering about 75,000 households—
by the Indonesian Census Bureau (BPS). It is a repeated cross-section of households.
We use two waves of the SUSENAS for our main analysis: March 2018 and March 2019.
We focus on the March 2019 SUSENAS as our endline, as all of the districts randomly assigned to vouchers had been converted before March 2019, whereas the districts randomly assigned to later conversion had not (see timeline in Appendix Figure 3). The special module collected questions on whether households received each program, how much they received from each program, prices and quantities of subsidized rice and eggs, the quality of rice, and so forth. In addition to the social protection module, we also analyzed the separate, detailed consumption module that is normally administered in the survey, which not only allowed us to look at total household consumption of different commodities (e.g., rice, eggs, cigarettes, etc.), but also the household poverty measures. Note that these two modules—the social protection module, which covers social assistance, and the consumption module, which covers consumption from all sources
—are distinct sections of the survey. For all variables, we construct district * rural/urban averages of the same variables in the March 2018 SUSENAS, which we merge in at that level as potential baseline control variables.
The second data set that we use is administrative data from the Unified Targeting Data Base (UDB). As described above, this database was constructed for targeting purposes in 2015, and forms the basis of eligibility for both the in-kind and voucher programs. The government merged UDB variables into the SUSENAS data using each individual’s national identification number (NIK), which is collected in both datasets; we then analyzed the de-identified version of this merged data. The merge is important for two reasons. First, it allows us to independently identify who in the SUSENAS is likely to be eligible for the program, since targeting was done by
13
the Ministry of Social Affairs using UDB data. Second, as the SUSENAS is a repeated cross- section, we do not have household level baseline variables, which are useful to examine heterogenous treatment effects and to absorb residual variation. The UDB variables, since they were collected in 2015, give us baseline measures of household well-being (PMT percentile scores) for heterogeneity analysis, as well as baseline family composition and assets that can be used as potential control variables. In particular, the PMT percentile score is the predicted percentile of the consumption distribution the household would be in, based on the household’s assets, composition, etc. Finally, we merged the 2018 village census (PODES) to provide village- level baseline control variables, as well as to be able to explore heterogeneity by baseline village characteristics.16
E. Experimental Validity
We examine potential differences between the in-kind and voucher districts in using baseline data from the 2018 SUSENAS. We chose the variables for the randomization check in January 2019, covering per capita consumption, caloric consumption and basic assets. In general, looking at the differences in Appendix Table 1 across the variables considered, we find that treatment and control groups appear balanced at baseline. Only 1 of the 11 variables is statistically significant, which is what one would expect by chance, and the randomized inference p-value of a joint F test is 0.384.
III. Results
Section III.A outlines the estimation strategy. We then begin by exploring the impact of switching from the in-kind to voucher program on the delivery of assistance and poverty in Section III.B.
Section III.C explores the impact on consumption choices, while Section III.D explores the impact on overall rice prices. Finally, Section III.E explores the impact on leakages and the administrative program costs.
A. Estimation
16 The 2018 PODES was enumerated from May 2 – May 31, 2018. Since BPNT distribution in the first set of units did not occur until the end of the month (starting May 25, 2018), and since PODES captures long-moving variables such as population, infrastructure, and so on, we consider the 2018 PODES as baseline variables. (See https://www.tribunnews.com/bisnis/2018/04/22/bantuan-pangan-non-tunai-tahap-2-cair-bulan-mei-2018-
penerimanya-nambah-2-juta.) We present robustness results below that drop these as well as other control variables;
results are qualitatively similar.
14
We estimate the impact of the experimental switch from in-kind assistance to vouchers using Equation 1:
𝑦 𝛽 𝛽 𝑉𝑜𝑢𝑐ℎ𝑒𝑟 𝑿𝒉𝒗𝒅𝒔𝜸 𝛼 𝜖 (1)
where 𝑦 is the relevant outcome variable; 𝑉𝑜𝑢𝑐ℎ𝑒𝑟 is the randomization into the voucher conversion in 2018; 𝑿𝒉𝒗𝒅𝒔 are control variables selected using a double LASSO (Belloni et al., 2014); and 𝛼 are strata fixed effects. In the LASSO, we include baseline control variables such as household covariates from the UDB, village level covariates from the village census and district*urban/rural averages of variables from the March 2018 SUSENAS. A full list of the control variables used as input into the LASSO is shown in Appendix B.We estimate the intent to treat using the original randomization results (only 3 of our control districts were treated during the study period, so treatment-on-treatment models would be very similar). Standard errors are clustered by district, as that is the level of randomization; we report randomization inference p- values in all tables (Young, 2019).
Following our pre-analysis plan, we differentiate results based on households that are likely to be eligible for subsidized assistance, and households that are unlikely to be eligible. To determine this, we use the baseline proxy-means test (PMT) score each household received in 2015 in the Unified Targeting Data Base (recall, as described above, that the PMT score is the household’s predicted percentile in the national per-capita consumption distribution based on household assets and household composition). The Ministry of Social Affairs drew up the final list of eligible beneficiaries in each district using this dataset as a basis. Since the program was aimed at households in approximately the bottom 30 percent of the population, following our pre-analysis plan we divide households into two groups: those with a PMT score of 30 or below, and those who had either a PMT score above 30 or those who were not included in the UDB.17 We also examine several additional cuts of the PMT score distribution, and in particular those with a PMT score of 15 or below, i.e., below the approximate poverty line.
17 A full pre-analysis plan can be found at https://www.socialscienceregistry.org/trials/4675. We pre-specified the regression in (1), as well as pre-specified the separation by baseline PMT score <= 30 or not. The primary outcome variables specified in the pre-analysis plan are total subsidy received, self-reported quality of rice, and food
insecurity indicators. The ‘populated analysis plan’ (Banerjee et al., 2020) for the primary outcome variables can be found in Appendix C.
15
While imperfect, the 2015 PMT score cutoff of 30 has strong predictive power both for consumption/poverty levels and for program eligibility. Appendix Table 2 provides summary statistics from the March 2018 SUSENAS data (i.e., the baseline household survey), separately for the two main groups we analyze: those with PMT scores <= 30 (i.e., the approximate target group), and those with PMT > 30 / those with no PMT score. The data reveal that households with PMT scores <= 30 are substantially poorer on virtually all dimensions. In particular, for households with PMT scores <= 30, average per-capita consumption is Rp. 689,000/month; for those with PMT score >= 30, average per-capita consumption is Rp. 1,116,000 / month – i.e., 62 percent higher.
Appendix Figure 4 plots this relationship as a bin-scatter, showing average baseline per-capita consumption levels for households by PMT scores (in bins of 5). There is a very strong, nearly linear relationship between PMT scores and mean baseline consumption levels. This is true within the set of households who have PMT scores – households with a PMT score from 0-5 have mean consumption of about Rp. 590,000 per month, compared to Rp. 940,000 or more for those with PMT scores 40 and above. Households who were not included in the PMT process (shown as PMT
= 100 on the graph) have even higher average consumption, averaging almost Rp. 1,200,000 per capita.
Appendix Table 2 also analyzes the relationship between PMT scores and a number of other variables, including some not included in the PMT formula (i.e., poverty rate, ownership of a flat screen television) and variables included in the PMT formula (e.g., low-quality wall, floor, or roof material, ownership of refrigerators). Households with low PMT scores appear poorer on both sets of variables.
The PMT cutoff that we use is also strongly associated with program eligibility: the households in the PMT <= 30 are substantially more likely to have been officially eligible for the Rastra program in 2017 (75 percent eligible for those with PMT <= 30, compared to only 5.7 percent for those with PMT > 30), and to have received the Rastra program in 2018 (71 percent for those with PMT <= 30, compared to only 33.4 percent for those with PMT > 30). Given these results, we interpret the split based on household pre-period PMT score as indicative of both official program eligibility and overall poverty levels.
B. Delivery of Assistance and Poverty Who gets assistance, and how much?
16
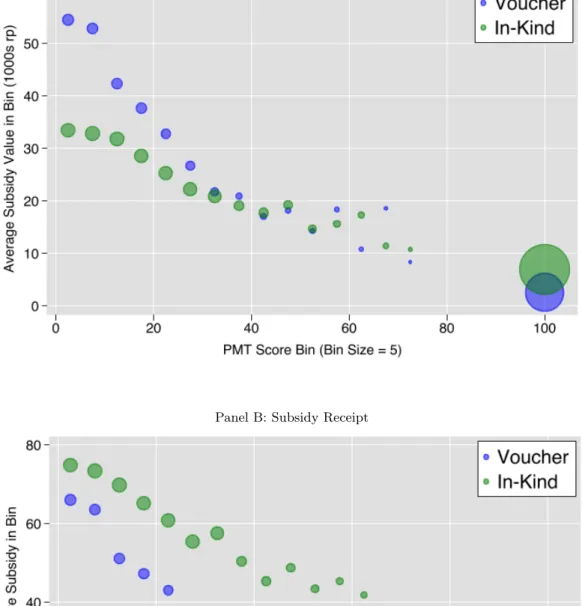
We begin by showing the impacts on the receipt of subsidized assistance. First, we examine the average monthly value of assistance that households receive from either the voucher or in-kind program, in Rupiah, averaged over the 4 months prior to the survey.18 For the in-kind program, we value rice received in-kind at the market rate in each rural or urban area of the given island group, measured from the SUSENAS consumption module.19 For the voucher program, we take the average reported receipt in Rupiah; if the monetary value is missing in the survey but quantities are available, we take the amount of rice and eggs reported, multiplied by the market rate of the item in each rural or urban area of a given island/island group.20 Note that households who received nothing from either program are included with a value of zero.
Figure 1, Panel A begins by showing the treatment effect on value of the total subsidy received non-parametrically. We break the households into bins based on household pre-period PMT scores (i.e., PMT scores 0-5, 6-10, and so on, with those who do not have PMT scores—
typically the wealthy—assigned the maximum score of 100).
Switching from an in-kind program to vouchers greatly increased the ability of the government to target aid to eligible households. Poorer households, as measured by having lower baseline PMT scores, experience substantial gains in the total amount of subsidy received. The gains are most pronounced for those with PMT scores of 20 or below, which corresponds to the bottom 18 percent of the population. Households in the middle of the distribution received about the same amount of subsidy on average. By contrasts, households at the top—i.e., those without PMT scores (shown as PMT = 100, which are largely households that local communities saw as too wealthy to be measured as possibly poor) —saw the amount of subsidy they receive fall considerably.
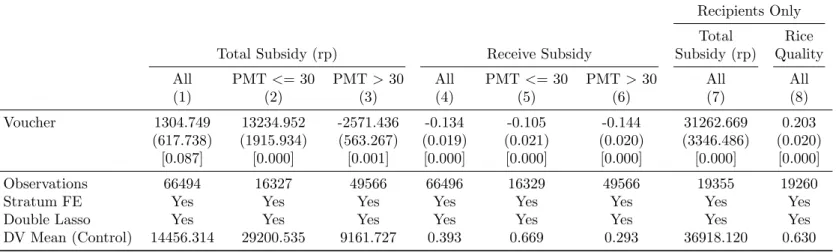
Table 1 presents the regression results from estimating equation (1) for total subsidy, shown for all households (Column 1), households with PMT scores <= 30 (i.e., targeted
18 Note that 1 USD averaged Rp. 14,000 during the period of this study.
19 By island groups, we refer to the main regions of Indonesia, i.e., these units are even larger than provinces, and much larger than the districts which are the unit of analysis here. The island groups we use in our data are Sumatra, Java, Kalimantan, Sulawesi, Maluku, Papua, and Bali/Southeastern Indonesia.
20 In principle, using the monetary values is preferred since it captures the market value of what recipients receive and what they choose to buy and where they choose to buy it. One might be concerned, however, that this approach could overstate the value received if the voucher-program led to higher prices. As discussed in Section III.C below, we do not, however, find prices for rice change on average. Nevertheless, as a robustness, we consider an alternative definition of the subsidy variable where we use the quantities of rice and eggs received, which we then value the same fixed set of prices for both programs. The results, presented in Appendix Table 3 Panel A, are broadly similar to the main results in Table 1.
17
beneficiaries), and PMT score > 30 (i.e., those not targeted).21 The key result is that the voucher program reallocated aid towards those with low PMT scores, i.e., the poorer, targeted group.22 Specifically, as shown in Column 2, targeted households received about 45 percent more in subsidy in voucher districts (Rp. 13,235 additional per month on average, compared to Rp. 29,200 per month in in-kind areas; p < 0.001). Conversely, the vouchers led to a reduction in subsidy received for those above 30. Those with PMT scores > 30 already received substantially less in in- kind areas—only Rp. 9,162 on average—and this fell by 28 percent in voucher areas (p = 0.001).
Overall, the mean amount received across all households was slightly higher in voucher areas, by about 9 percent (Column 1, p=0.087).23
This change came about because households who received the transfer received substantially more in voucher areas, i.e., the aid was substantially more concentrated to the poor in voucher areas. On the one hand, Figure 1, Panel B shows that the probability of receiving any aid is lower for all groups in voucher areas compared to in-kind areas, regardless of their PMT score. This difference in the probability of receiving any aid is smallest for those with the smallest PMT scores, but more substantial for those with PMT scores above 30. Table 1, Columns 4-6, show the results in a regression format. The probability of receiving any assistance falls 16 percent (10.5 percentage points; p< 0.001) in voucher areas for those with PMT scores <= 30; for those with PMT scores > 30, the probability of receiving assistance falls by 49 percent (14.4 percentage points; p<0.001).24 Thus, while everyone across the income distribution has a lower probability of
21 Table 1 examines outcomes in the March 2019 SUSENAS. The September SUSENAS also included part of the new social protection module. It was a smaller wave in terms of both sample size and included questions (e.g., the quality question was not included). Perhaps more importantly, only 10 of our 43 treatment districts were randomized to be treated by the time of the survey, and so we would expect to have less statistical power. Nonetheless, if we run our analysis only in September (defining as treated the 10 districts randomly selected to be treated prior to September), or in the pooled September and March data, we find very similar results. See Appendix Tables 4 and 5.
22 Our results are remarkably robust to specification choices, such as dropping the controls selected via LASSO (Appendix Table 6), dropping the holdout sample (Appendix Table 7), or winsorizing the subsidy outcome (Appendix Table 8). We also decompose the results separately based on whether the district was randomly chosen to be converted to in-kind in May, October, or November 2018. The results in Appendix Table 9 show similar results in all three waves, with if anything qualitatively larger effects for those districts that had the voucher program the longest (i.e., the May 2018 group).
23 This likely represents the fact that, due to fluctuations in the market price of rice, at the time of our survey the market price of rice was only Rp. 9,700/kg nationwide, so 10kg of in-kind rice would be valued at Rp. 97,000, compared to Rp. 110,000 for the voucher. We explore more systematically whether this result represents a reduction in leakage from the program in Section III.D below. We find that it most likely does not.
24 The fact that households with low PMT scores were slightly less likely to receive assistance under the voucher program may be in part a consequence of the fact that the PMT lists we use here for analysis are not the exact final lists used for program distribution. As described above, the Ministry of Social Affairs made some revisions to the initial targeting lists we use here before sharing them with local governments, but we were unable to obtain this data.
18
receiving the voucher program than the in-kind program, the reductions were much more pronounced for those that were not targeted.
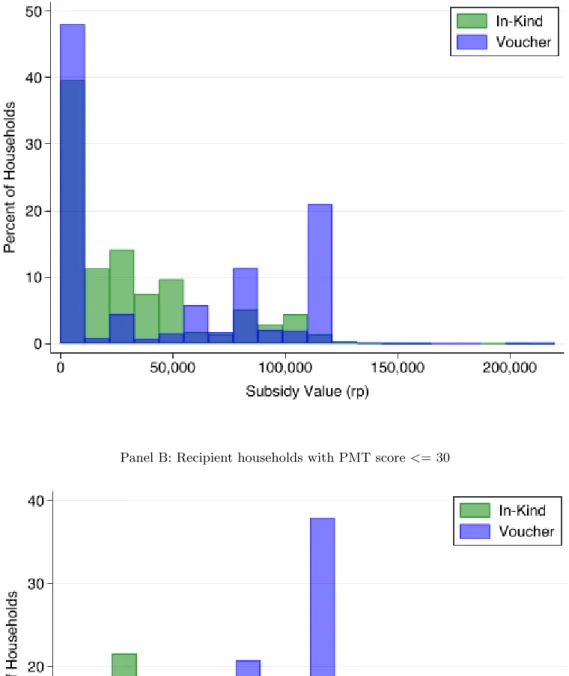
On the other hand, those who do receive assistance receive substantially more in assistance in voucher areas. Column 7 of Table 1 shows that, conditional on receiving assistance of some form, recipients in voucher areas received 85 percent more in voucher areas than in in-kind areas on average over the previous 4 months (Rp. 31,263 more; p<0.001). In particular, conditional on receiving anything, recipients in voucher areas are substantially more likely to receive the full amount they are entitled to. This pattern can be seen in Figure 2, which plots histograms of the average amount received in the 4 months prior to the survey in both in-kind and voucher districts.
Panel A in Figure 2 shows all respondents with PMT score <= 30; Panel B shows only respondents with PMT score <= 30 who received some transfers. What is remarkable are the 4 regularly spaced spikes in Panel B for voucher locations. These correspond to households who received the full Rp.
110,000 transfer in the previous 4 months, 3 of the previous 4 months, and so on. By contrast, recipients in in-kind areas not only tend to receive substantially less on average, but they also do not show the clear bunching we see in the voucher areas. In fact, in February 2019, 97 percent of BPNT recipients who reported their transfer amount received the full Rp. 110,000, compared to only 18 percent of Rastra recipients who reported receiving the full 10kg. Similar patterns can be seen in Panel A, which shows all respondents.
Combined, these results show a clear pattern. In in-kind districts, assistance is subdivided into much smaller amounts, so that the typical beneficiary receives only about a third of the intended transfer size. The additional funds are used to give many more households assistance, despite the fact that this is explicitly against the stated rules. In voucher areas, this practice is substantially less prevalent. Somewhat fewer households receive assistance, but those that receive assistance receive substantially more, and usually the full amount they were entitled to. In short, the voucher program exhibited dramatically higher fealty to program design, and as a result, transferred substantially more to those in the lowest percentiles of PMT scores.25
It is possible then that some of the households that we observe not receiving the program were in fact ineligible households according to the final Ministry of Social Affairs list.
25 One may also be concerned that by concentrating benefits to poorer households, there may be dissatisfaction within the village that is expressed through protests or voting in new local leaders. Appendix Table 10 shows no observable differences in either of these outcomes.
19
We show that this represents substantially more aid received by those who are actually poor and is not just an artifact of who is on the baseline eligibility list. Specifically, one potential concern could be that the baseline PMT scores do not fully capture true consumption, and that the re-targeting that communities were doing in the in-kind program is towards poor households excluded by the PMT scores (Alatas et al., 2012). To examine this issue, Appendix Figure 5 graphs the subsidy received by per capita consumption percentile bins, rather than PMT bins. Note that since this measure is contemporaneous consumption (unlike our PMT data, which is measured several years prior), we subtract out the value of subsidy received from either the in-kind or voucher programs prior to calculating this graph. Appendix Figure 5 shows the same pattern as our main results—the voucher program increases the amount of subsidy received by the poorest households—particularly so for those in the bottom decile, but also for those in the 20th and 30th percentiles, and it does so by reducing the amount of subsidy received by wealthier households, particularly those in the 65th – 90th percentiles of the per-capita consumption distribution. This analysis shows that the voucher program really did deliver more aid to the poor.
To further probe this issue, we look within the voucher areas, and compare households who did and did not receive the program. We find that households who receive the BPNT voucher are substantially poorer than those who do not. Remarkably, this is true even controlling flexibly for the PMT score – households who receive BPNT are about 19 percent poorer than households who do not, even holding PMT scores constant. This suggests that, to the extent there are local deviations from the raw PMT scores in allocating vouchers, they go in the direction of including poorer households.26
There are several important differences in the mechanisms through which the two programs were administered that may explain these differences. First, there is an important difference in the divisibility of what was given out to beneficiaries. In the in-kind program areas, sacks of rice were brought to local government warehouses, where they were then packaged into individual sized
26 These results are shown in Appendix Table 11. Columns 1-3 present results with no controls, with district fixed effects, and controlling for dummies for each fine PMT score level (i.e., a dummy for each integer of PMT scores, i.e., 1, 2, 3, etc.). Columns 4-6 present the same results, but with raw per-capita consumption as measured at endline (i.e., not making any adjustment for program receipt). Panel A considers the entire sample and Panel B restricts to households with PMT scores < 30. To investigate whether local officials target on other dimensions (as in Galasso and Ravallion (2005), Alatas et al. (2012) and Basurto et al. (2020)), we further explore differential targeting of the two programs on other household characteristics in Appendix Table 12. We find that the voucher program distributes more benefits than the in-kind program to poor households, those with more kids, and those with lower levels of education, but that widows are less likely to receive the program under the voucher program compared with the in- kind program.
20
portions and delivered to beneficiaries. This manual process affords little ability for central government oversight. By contrast, the voucher program used individualized debit cards, with the intended recipient’s name pre-printed on the card (see Appendix Figure 6; the name and debit card number are blurred on the photo to protect confidentiality). A debit card is not easily subdivided – the number of cards was fixed, and each card received the full transfer each month electronically, so local officials could not easily reallocate a part of their value to other beneficiaries.
Second, the administration of the program was switched from government officials to banks and bank agents. We collected data on the types of actors that were involved in the distribution of both programs through a phone survey to district governments. The results, in Appendix Table 13, show that the distribution points for the in-kind program in 88 percent of districts are government-run, while in 99 percent of districts, the voucher program distribution sites are private bank agents.27 Private agents may be less sensitive to political pressures than government officials to distribute aid to those other than beneficiaries. Moreover, the designation of private vendors as agents was run as part of a bank’s remote-bank-agent program. Those programs are governed by banking regulations that also regulates other debit cards, which require banks to verify that debit cards are issued to the person who is listed on the account (i.e., know- your-customer rules), and require bank agents to verify that this person is indeed the person redeeming the card. The move from a program administered directly by local governments, to a program effectively administered by banks, may be a second reason for increased fidelity to distribution rules. It is worth noting that the involvement of banks in issuing and managing debit cards for government transfers is not unique to Indonesia; JP Morgan Chase, for example, issues and manages SNAP electronic benefit debit cards for US food assistance in 24 states, while other private debit card issuers manage them in all other states.28
Quality and targeting
In addition to how much assistance people received, there is also a question of the quality assistance people received. The poor quality of rice under the in-kind program was a frequent
27 Unfortunately, the SUSENAS did not ask recipients of the food subsidy program where they received their rice (due to the fact that it was all being distributed through the government). However, the results for location of where voucher recipients redeemed the voucher for food is confirmed in the SUSENAS data, where only 11 percent of BPNT recipients stated that they received it at the government offices.
28 Data as of 2012; see http://www.g-a-i.org/wp-content/uploads/2012/10/GAI-Report-ProfitsfromPoverty- FINAL.pdf
21
complaint about the Raskin program, as well as other government-delivered programs more broadly (Jacoby, 1997). Even though most rice consumed in developed economies like the United States is of high quality, in Indonesia, rice has many quality grades, and lower-quality rice often contains small stones, is off-color, has broken kernels, or smells bad, all of which are complaints that have surfaced about the Raskin program (Banerjee et al., 2019).
The SUSENAS household survey module asked respondents about the quality of rice received, on a 3-point Likert scale, which we transformed to percentiles between 0 and 1. The question was asked identically for both the in-kind and voucher program recipients. On this scale, Column 8 in Table 1 shows that households rated the voucher rice substantially higher quality, by about 32 percent.29 This suggests that the quality-adjusted amount of subsidy received by targeted beneficiaries in voucher areas is even higher than the 45 percent increase discussed above. Putting a monetary value on this quality improvement is challenging, but a back-of-the-envelope calculation suggests that the quality-adjusted values of subsidy received by targeted households in voucher areas may have further increased the amount of the transfer received by about 20 percent.30
The quality improvements in the voucher program are likely related to the fact that sourcing of the rice was more flexible. In the in-kind program, all rice was sourced and distributed by BULOG, the government logistics agency. By contrast, in the voucher program, agents were able to source rice where they see fit – which resulted in a very different sourcing pattern. Specifically, using data from a survey of agents conducted by the World Bank, we find that in the voucher program, 7 percent of agents reported sourcing their rice only from the government (BULOG), 27
29 While the quality of the rice the beneficiaries receive had increased, we do not expect this to lead to differential changes in the market premium for higher quality rice received by farmers. The reason is both because the subsidized rice in these programs is only 6 percent of the total rice market, and because the low quality rice in the in-kind program may at least in part be the result of quality degradation in government warehouses. While we did not observe differential rice prices by quality level for each district, nationally, we see no difference in the price premium for high vs. low quality rice over the period we studied here (e.g., it averaged Rp. 646/kg (7.4%) in 2016, before the transition began, and Rp. 518 (5.6%) in 2019).
30 To compute the quality adjusted price, we take the point estimate from the subsidized rice quality results and transform this into a z-score. That is, the quality improvements in Table 1 translate to an increase of 0.71 standard deviations on the quality measure. We then calculate the rice price distribution paid by residents within each district- urban area, which may capture heterogeneity in rice quality. Finally, we assign a monetary value of the quality improvements equal to that number of standard deviations of the rice price (i.e., if the standard deviation of rice price is Rp. 1,000/kg, and the quality measure in Table 1 represents 0.25 standard deviations, we would assign a price equivalent of Rp. 250/kg). On average, this calculation suggests that the quality improvements in Table 1 would be would be worth an additional Rp. 1,060 per kg, which is anecdotally consistent with typical differences in market prices between low and average quality rice. Appendix Table 3 Panel B shows that, when we used a quality-adjusted price compared to a fixed price, the benefits of the voucher program for households with PMT <= 30 are about 20 percent higher.
22
percent report a mix of BULOG and the private market, and 65 percent reporting sourcing it entirely from the private market.
The improvement in the quality of the assistance makes the improved targeting even more remarkable. A common argument in favor of providing lower-quality food assistance is that the low quality serves as a screening device, so that it can be better targeted to the poor (Nichols and Zeckhauser, 1982; Besley and Kanbur, 1988). What is remarkable here, however, is that targeting improved despite the food being substantially higher quality, which would give the rich more reason to try be included in the program. In this case, the improved administrative process of the voucher program swamped whatever targeting benefits may have been accruing from lower- quality in-kind rice.
Impacts on Poverty
The previous analysis showed that the vouchers channeled additional resources to the poorest households. We next ask whether this effect was large enough to affect household poverty rates.
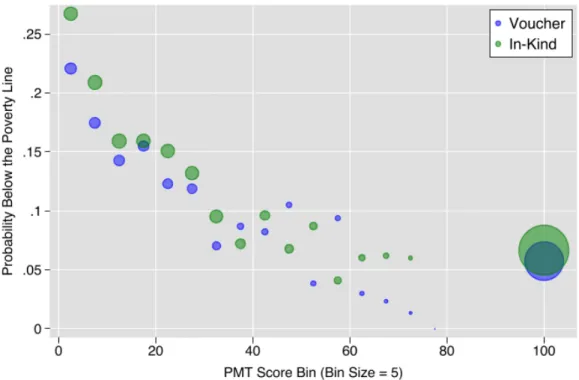
To examine this, for each household, we compute whether they are below the official Government of Indonesia poverty line, which is set separately for rural and urban households in each province. Since richer households are largely above the poverty line to begin with, one might expect stronger results for those households who have lower PMT scores.
We therefore begin in Figure 3 by presenting the results non-parametrically, using the same bin-scatters as above. As discussed before, baseline PMT score is strongly predictive of poverty status, in both voucher and in-kind areas. About 27 percent of households with PMT scores 0-5 are below the poverty line in in-kind areas. This falls to 21 percent for households with PMT scores 5-10, about 16 percent for households in the next few PMT bins, and further at higher levels.
Figure 3 shows substantial reductions in poverty associated with the move from the in-kind program to the voucher program. This is particularly apparent for the poorest households – poverty rates fall by about 6.5 percentage points for households in the poorest group (baseline PMT score 0-5), and about 4 percentage points for households in the next-poorest group (baseline PMT score 5-10). This occurs both because more of these households were close to the poverty line to begin