REFERENCE EMISSION LEVEL FOR DEFORESTED AND. Encourages developing country Parties to contribute to forest sector mitigation measures). Indonesia accepts the invitation to voluntarily submit a proposed National Forest Reference Emission Level (FREL) for deforestation and forest degradation in the context of results-based payments for activities related to REDD+.
Relevance
12/CP.17 provides guidance for the developing country party intending to undertake REDD+ to include in its submission transparent, complete FREL/FRL, in accordance with the guidelines adopted by the COP, and accurate information to allow a technical assessment of data, methodologies and procedures used in the construction of FREL/. 13/CP.17 clearly stated a comprehensive set of guidelines for participating countries to move forward with REDD+ readiness.
General Approach
First, a collaboration between the Indonesian REDD+ Agency and the Ministry of Forestry (now the Ministry of Environment and Forestry) developed national FRELs using land cover data from the Ministry of Forestry for the reference year 2000–2012. Second, Indonesia's SNC also established a projection of emissions for land use, land use change and forestry (LULUCF) until 2020 using land cover data from the Ministry of Forestry for the reference period of 2000 to 2006 (Boer et al., 2010). . Thirdly, the Ministry of Forests updated and issued regulation no.
The Objectives of this Submission
This FREL covered an area of 113.2 million ha of natural forests in 1990, which represented approximately 78.6% of all designated forest areas. CO2 emissions from tree aboveground biomass and degraded peat were included in this submission.
Process on FREL establishment
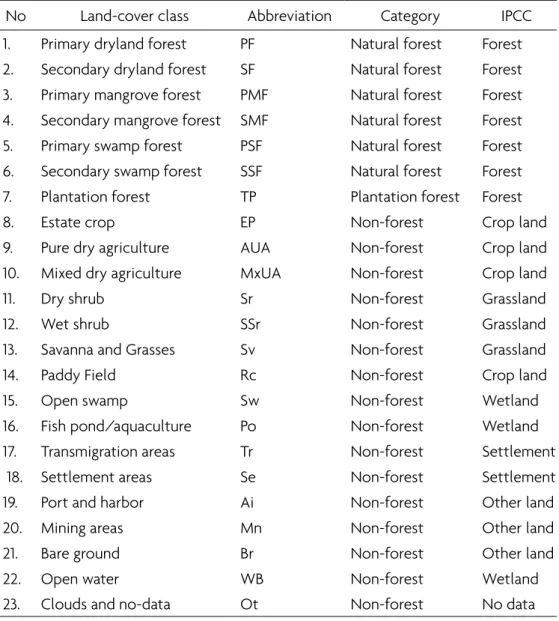
Forest
National Standard (SNI) on “Method for calculating forest cover change based on results of visual interpretation of optical satellite remote sensing image.” Forests are classified into seven classes based on forest types and degradation or succession level.
Deforestation
Forest Degradation
With such complex and unique conditions in Indonesia, determining the extent of forest degradation is not a simple task.
Peat land
FREL
This FREL was developed based on historical forest dynamics and serves as a benchmark for future performance evaluation of REDD+ activities. FREL was established by taking into account trends, starting dates, availability and reliability of historical data, and the length of the reference period sufficient to capture political dynamics and effects during that period.
Area Covered
Activities Covered
Pools and Gases
SNI 7725-2011 on the development of allometric equations for estimating carbon stocks in forests based on measurements in the field (terrestrial accounting of carbon in forests). SNI 7724-2011 on measuring and accounting for carbon stocks - field measurements for measuring carbon stocks in forests and.
Data
- Land-cover data
- National peat land data
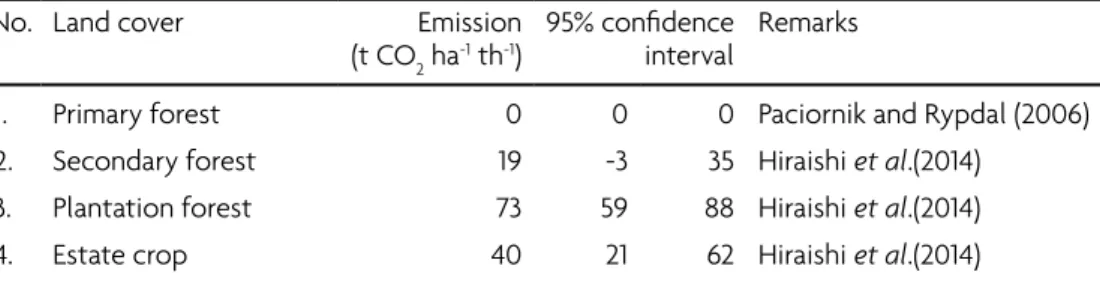
- Emission factors for deforestation and forest degradation
- Peat emission factor
Similar to Hiraishi et al.(2014), Hergoualc’h and Verchot (2013) also used land cover class as the basis for determining peat emission factor. Due to relatively high uncertainty among the sources, Hiraishi et al.(2014) default values are used in this publication.

Methodology and Procedure
- Reference period
- Reference emission calculation
- Emission calculation from deforestation and forest degradation
- Emission calculation from peat decomposition
- Uncertainty calculation
The historical emissions from peat degradation are calculated on the basis of the same base period as deforestation and forest degradation. The average emissions from deforestation and forest degradation over the entire period P (MGEP) were calculated using Equation 5.
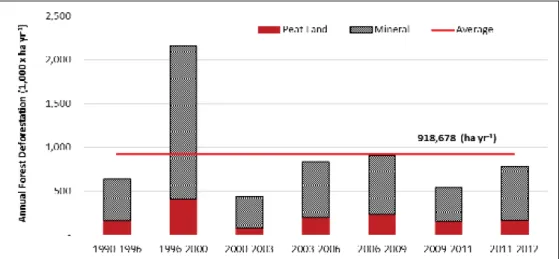
Estimates of Deforestation and Forest Degradation Area
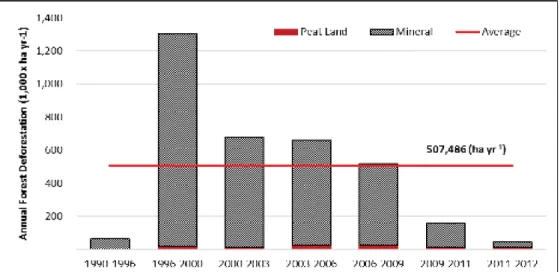
Deforestation
The lines indicate the dynamic rate of deforestation per linked interval period, and the black red line shows the average annual deforestation from. As expected, the least forested regions, Maluku, Java and Bali Nusa Tenggara, experienced very low deforestation, contributing only 6% of total deforestation in Indonesia (Figure 5). Proportion of annual deforestation (in %) in Indonesia for 7 major islands/or island groups of islands in Indonesia.
Forest degradation
The low rate of deforestation in the period 2000-2003 was mainly due to the implementation of the Ministry of Forestry's National Strategic Plan, known as the soft landing policy. The largest share of degradation in Sulawesi during this period was the result of forest encroachment, mainly due to the planting of cocoa and cloves. During the period of forest degradation in Sulawesi, Kalimantan and Sumatra, especially within conservation forests, it was probably due to illegal logging and encroachment activities, insufficient incentives to maintain protected areas and low capacity of responsible institutions in managing protected areas (IFCA, 2008). .
Emissions from Deforestation, Forest Degradation, and Peat Decomposition
Emissions from deforestation
Emissions from forest degradation
Emissions from peat decomposition
Uncertainty Analysis
Constructed National Forest Reference Emissions Level
Annual and average historical emissions from deforestation, forest degradation and associated peat degradation (in MtCO2) in Indonesia from 1990 to 2012. Based on historical emissions from deforestation, forest degradation and associated peat degradation emissions for the year 2013 is expected to be 0.57 GtCO2e. Projected annual REL from deforestation, forest degradation and related peat degradation in tCO2), calculated using a linear projection based on conservative historical data 1990-2012.

Forest Governance in Indonesia
Synchronization between TGHK and Provincial Spatial Planning was carried out between 1999 and 2000, resulting in Provincial Forest Zone maps that were legalized by Decree of the Ministry of Forestry. The Conservation Forest is a forest area with a special characteristic, which has the main function of preserving the diversity of flora and fauna and the ecosystem. A productive forest is a forest area that has the main function of producing forest products, especially timber.
Trend of Development in the Land Based Sector
In the 15.2 million ha HPK, the total remaining natural forest in 2012 was 7.24 million ha, spread over seven major/groups of islands (Figure 12). Apart from the forested area mentioned above, there is also 7.48 million ha of 2012 natural forest which is in the APL (other land use/non-forest land). Thus, the total area of natural forests that can be converted from HPK and APL is 14.72 million ha (Figure 13).
The policy intervention to reduce forest conversion
The One Map Policy is a movement towards the development of one reference, one standard, one database and one geoportal, which aims to improve access to reliable geospatial data and integrated spatial information among government ministries and agencies. FREL has been developed based on currently available data and knowledge in relation to national circumstances, capacities and capabilities. A number of initiatives are underway for further improvement in the future, including, for example, improvement of activity data, improvement of the forest emission factor (carbon stock) and improvement of the emission factor of peatland and mangrove ecosystems, the results of which were not fully used in the construction of the FREL for this submission.
Improvement of Activity Data
Referring to this result, the possibility of mapping annual wall-to-wall land covers for the next monitoring period will be high. The historical land cover data used for this FREL submission was generated using visual interpretation, which is time consuming and required trained operators (Margono et al., 2015). It is expected that future improvement using hybrid approach involving manual and digital classification will be implemented to generate annual land cover maps for Indonesia (e.g. Margono et al., 2014).
Improvement of Forest Emission Factor (Carbon Stock)
Improvement of Peatland Emission Factor
In parallel, continuous monitoring of groundwater levels throughout all seasons on representative sample plots for each relevant land cover layer should be carried out in the future in order to establish an improved model of greenhouse gas emissions from peatlands. Peatland characteristics, such as vegetation types, peat depths, groundwater levels and soil organic carbon content, vary greatly between sites, leading to high variability in carbon stocks and CO2 emissions. In order to minimize uncertainty and geostatistical errors due to high variability, it was deemed necessary to estimate emission factors based on detailed land cover and forest stratification in several types of peatland conditions.
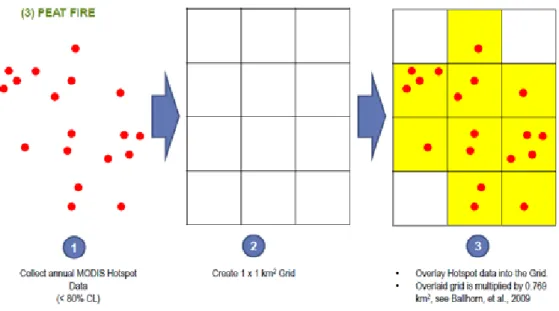
Estimating Peat land Fire Emission
In addition to identifying the area of the burn scar, an accurate estimate of the depth of the peat burn is also important for calculating emissions from peat fires. Airborne lidar was used to calculate peat burn depth with high accuracy (Ballhorn et al. 2009). These efforts would include validating peatland boundaries and improving peatland properties such as peat category and depth.
Inclusion of other REDD+ Activities
Allometric equations for estimating aboveground biomass in tropical lowland dipterocarp forests: For. 2010) Second National Communication of Indonesia under the United National Framework Convention on Climate Change (UNFCCC): Ministry of Environment, Republic of Indonesia. Reducing Emissions from Deforestation and Forest Degradation in Indonesia, Consolidation Report, FORDA: Ministry of Forestry of the Republic of Indonesia. Sourcebook for Land Use, Land Use Change and Forestry Projects: Winrock International and the World Bank BioCarbon Fund 57.
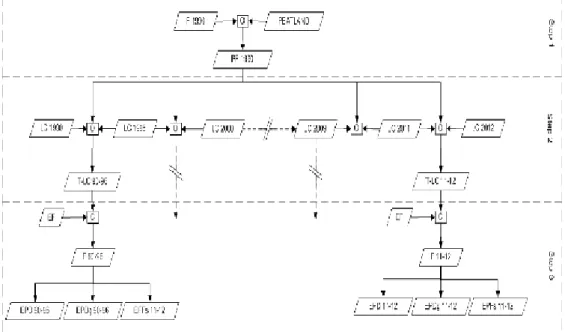
Documentation and specification of the land-cover data
The adjacent years were then 'matched' to the base by means of a semi-automatic matching process. Product comparison of the LCCA LAPAN results (referring to tree cover) with data from the Indonesian Ministry of Forestry for forests in 2000 (start date) and 2012 (end date of analysis). Graph comparison, showing agreement of the land cover data used by MoFor in this analysis with the other two independent studies (Margono and LAPAN/LCCA-LAPAN).

Documentation and specification of the peat land data
Remote sensing Indicators used for peatland area detection are: wetness (surface drainage), topography and land cover. The detailed documentation of the peat land map of Indonesia can be found in the document titled "Peta Lahan Gambut Indonesia Skala 1:250.000 Edisi Desember 2011" (in Indonesian "Indonesian Peat land Map Scale 1:250,000 Edition 2011") published in 2011 by the Agricultural Research and Development Agency, Ministry of Agriculture of Indonesia (Figure Annex 2.1). The cover of the documentation and specification of Indonesian peatland map 2011 edition (in Indonesian).
Documentation and specification of the forest carbon stock data
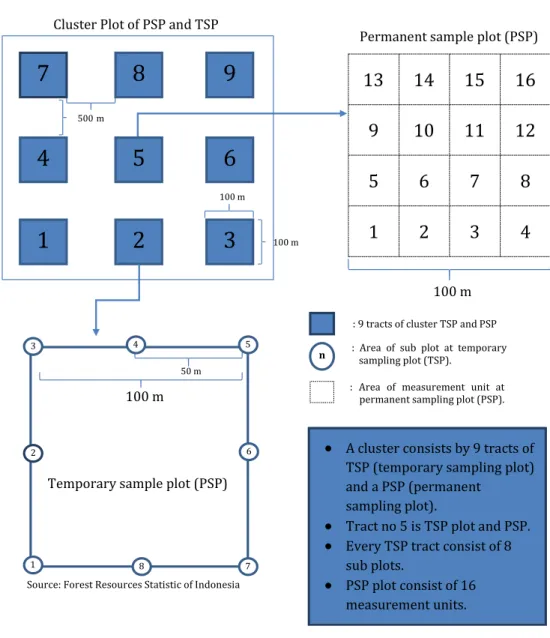
Most of the clusters are located in the area with altitude below 1000 m above sea level (ASL). The information from this poststratification is more relevant to the need for FREL, as the land use types and forest types recorded in the NFI data were different or not adjusted to current land cover categories used for FREL. All individual trees in the plot were examined and plot information was checked for each plot to ensure correct information, as part of the quality assurance process.
Measuring emissions from peat fires
In order to better estimate the peat depth of the burnt peat area, a relationship analysis has to be performed between hotspot parameters (fire intensity, frequency, etc.) and the depth of the burnt peat. 2009) used airborne LIDAR to estimate the depth of burnt peat with an accuracy of less than 20 cm. The mass of fuel available for combustion, MB, is estimated by multiplying the average depth of burned peat (D) and bulk density (BD), assuming the average fire-burned peat depth is 0.33 m (Ballhorn et al., 2009 ) and bulk density is 0.153. Using this historical data set, the mean value was used as activity data for the proposed REL of burnt peat covering 29,379 ha.
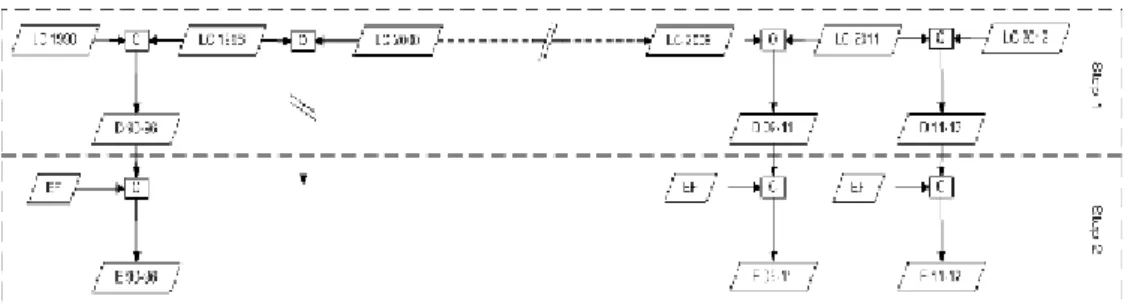
Detail calculation on emission from deforestation, forest degradation and the associated peat
Matrix for peat decomposition calculation
Yellow" is total emission, "red" is emission from secondary forest, "green" is emission from forest degradation, emission from deforestation. PF SF PMF SMF PSF SSF TP EP AUA MxUA Sr SSr Sv Rc Sw Po Tr Se Ai Mn Br WBOt.

Uncertainty analysis
Sustainable management of forest
The costs associated with LiDAR data acquisition are currently comparable to direct ground measurement (Hummel, et al. 2011). Further improvements for more accurate wall-to-wall monitoring of forest degradation and selective logging using reliable and cost-effective methods need to be explored. 2002 Remote Sensing of Selective Logging in Amazonia: Assessing Constraints Based on Detailed Field Observations, Landsat ETM+ and Texture Analysis. 1997 An experimental comparison of different reduced impact harvesting intensities and conventional logging in East Kalimantan, Indonesia.
NATIONAL FOREST