Soares Stanton
Human Factors and Ergonomics in Consumer Product Design Methods and T echniques
Human Factors and Ergonomics in Consumer Product Design
Methods and Techniques
46284
ISBN: 978-1-4200-4628-1
9 781420 046281
90000 Every day we interact with thousands of consumer products. We not only expect them to perform their functions safely, reliably, and efficiently, but also to do it so seamlessly that we don’t even think about it. However, with the many factors involved in consumer product design, from the application of human factors and ergonomics principles to reducing risks of malfunction and the total life cycle cost, the process just seems to get more complex. Edited by well-known and well-respected experts, the two volumes of Handbook of Human Factors and Ergonomics in Consumer Product Design simplify this process.
The first volume, Human Factors and Ergonomics in Consumer Product Design: Methods and Techniques, outlines how to incorporate Human Factors and Ergonomics (HF/E) principles and knowledge into the design of consumer products in a variety of applications. It discusses the user-centered design process, starting with how mental workload affects everyday interactions with consumer products and what lessons may be applied to product design. The book then highlights the ever-increasing role of information technology, including digital imaging, video and other media, and virtual reality applications in consumer product design. It also explores user-
centered aspects of consumer product development with discussions of user-centered vs. task-based approach, articulation and assessment of user requirements and needs, interaction with design models, and eco design.
Features
• Delineates how the Human Factors and Ergonomics body of knowledge can be used as a tool for designing consumer products
• Discusses the user-centered approach with definitions of users and the tasks they perform
• Explores how to translate design research into useful and usable products
• Covers human design technology, consumer products conceptual design, and development of smarter products using a systems engineering approach
• Focuses on creativity, innovation, standards and guidelines, culture, environment, affect, aging, and complexity in product design process
With contributions from a team of researchers from 21 countries, the book covers the current state-of-the- art methods and techniques of product ergonomics. It provides an increased knowledge of how to apply the HF/E principles that ultimately leads to better product design.
Human Factors and Ergonomics in Consumer
Product Design
Methods and Techniques
Ergonomics Design and Management:
Theory and Applications
Series Editor
Waldemar Karwowski
Industrial Engineering and Management Systems University of Central Florida (UCF) – Orlando, Florida
Published Titles
Aircraft Interior Comfort and Design Peter Vink and Klaus Brauer
Ergonomics and Psychology: Developments in Theory and Practice Olexiy Ya Chebykin, Gregory Z. Bedny, and Waldemar Karwowski Ergonomics in Developing Regions: Needs and Applications Patricia A. Scott
Handbook of Human Factors in Consumer Product Design, 2 vol. set Waldemar Karwowski, Marcelo M. Soares, and Neville A. Stanton
Volume I: Methods and Techniques Volume II: Uses and Applications
Human–Computer Interaction and Operators’ Performance: Optimizing Work Design with Activity Theory
Gregory Z. Bedny and Waldemar Karwowski
Trust Management in Virtual Organizations: A Human Factors Perspective Wiesław M. Grudzewski, Irena K. Hejduk, Anna Sankowska, and Monika Wa´ntuchowicz
Forthcoming Titles
Ergonomics: Foundational Principles, Applications and Technologies Pamela McCauley-Bush
Knowledge Service Engineering Handbook Jussi Kantola and Waldemar Karwowski
Manual Lifting: A Guide to the Study of Simple and Complex Lifting Tasks Daniela Colombiani, Enrico Ochipinti, Enrique Alvarez-Casado, and Thomas R. Waters Neuroadaptive Systems: Theory and Applications
Magalena Fafrowicz, Tadeusz Marek, Waldemar Karwowski, and Dylan Schmorrow Organizational Resource Management: Theories, Methodologies, and Applications Jussi Kantola
Human Factors and Ergonomics in Consumer
Product Design
Methods and Techniques
Edited by
Waldemar Karwowski Marcelo M. Soares Neville A. Stanton
CRC Press is an imprint of the
Taylor & Francis Group, an informa business Boca Raton London New York
6000 Broken Sound Parkway NW, Suite 300 Boca Raton, FL 33487-2742
© 2011 by Taylor and Francis Group, LLC
CRC Press is an imprint of Taylor & Francis Group, an Informa business No claim to original U.S. Government works
International Standard Book Number-13: 978-1-4200-4629-8 (eBook - PDF)
This book contains information obtained from authentic and highly regarded sources. Reasonable efforts have been made to publish reliable data and information, but the author and publisher cannot assume responsibility for the valid- ity of all materials or the consequences of their use. The authors and publishers have attempted to trace the copyright holders of all material reproduced in this publication and apologize to copyright holders if permission to publish in this form has not been obtained. If any copyright material has not been acknowledged please write and let us know so we may rectify in any future reprint.
Except as permitted under U.S. Copyright Law, no part of this book may be reprinted, reproduced, transmitted, or uti- lized in any form by any electronic, mechanical, or other means, now known or hereafter invented, including photocopy- ing, microfilming, and recording, or in any information storage or retrieval system, without written permission from the publishers.
For permission to photocopy or use material electronically from this work, please access www.copyright.com (http://
www.copyright.com/) or contact the Copyright Clearance Center, Inc. (CCC), 222 Rosewood Drive, Danvers, MA 01923, 978-750-8400. CCC is a not-for-profit organization that provides licenses and registration for a variety of users. For organizations that have been granted a photocopy license by the CCC, a separate system of payment has been arranged.
Trademark Notice: Product or corporate names may be trademarks or registered trademarks, and are used only for identification and explanation without intent to infringe.
Visit the Taylor & Francis Web site at http://www.taylorandfrancis.com and the CRC Press Web site at http://www.crcpress.com
vii
Contents
Preface...ix
Acknowledgments ...xi
Editors ... xiii
Contributors ...xv
Section i Methods for consumer Products Design
Chapter 1 Techniques to Translate Design Research into Useful, Usable, and Desirable Products ...3Elizabeth Mauer and Corinna Proctor Chapter 2 Manufacturing Attractive Products Logically by Using Human Design Technology: A Case of Japanese Methodology ... 21
Toshiki Yamaoka Chapter 3 Persona: A Method to Produce Representations Focused on Consumers’ Needs ...37
Eric Brangier and Corinne Bornet Chapter 4 Model-Based Framework for Influencing Consumer Products Conceptual Designs ... 63
Serge N. Sala-Diakanda and Marcelo M. Soares Chapter 5 Smarter Products User-Centered Systems Engineering ... 83
Tareq Ahram, Waldemar Karwowski, and Marcelo M. Soares
Section ii Design Process
Chapter 6 Supply and Demand: Perspectives on Mental Workload with Consumer Products... 97Mark S. Young and Neville A. Stanton Chapter 7 Intelligence, Creativity, and Decisions in Product Design ... 109
Raymy Kate O’Flynn and Thomas Waldmann Chapter 8 Role of Standards in Design ... 119
Magdalen Galley-Taylor, Anne Ferguson, and Gordon Hayward
Chapter 9 Addressing Human Factors and Ergonomics in Design Process, Product
Life Cycle, and Innovation: Trends in Consumer Product Design ... 133 Gabriel García Acosta, Karen Lange Morales, David Ernesto Puentes Lagos, and Manuel Ricardo Ruiz Ortiz
Chapter 10 Integration of Ergonomics in the Design Process: Conceptual, Methodological, and Practical Foundations ... 155 Luz Mercedes Sáenz Zapata
Chapter 11 Design, Usability, and Maintainability of Consumer Products ... 177 Lawrence J. H. Schulze
Chapter 12 Assembly Complexity and the Design of Self-Assembly Products ... 187 Miles Richardson
Chapter 13 Proposed Framework for Integrating Environmental Issues in
Ergonomics to Product Development ... 201 Alma Maria Jennifer A. Gutierrez and Rosemary R. Seva
Chapter 14 Cultural Ergonomics Issues in Consumer Product Design ... 211 Tonya L. Smith-Jackson, Hardianto Iridiastadi, and Chang Geun Oh
Chapter 15 Affective Design and Consumer Response ...223 Rosemary R. Seva and Martin G. Helander
Chapter 16 Universal Design: Empathy and Affinity ... 233 George Edward Torrens
Chapter 17 Integration of Elderly Users into Product Development Processes: Senior
Research Groups as Organizational and Methodical Approach ...249 Sebastian Glende and Wolfgang Friesdorf
Chapter 18 IEA EQUID Template for Cooperation between Product Designers and
Ergonomists ... 261 Michel Nael
Section iii Digital Design
Chapter 19 Behavior Video: A Methodology and Tool to Measure Human Behavior;
Examples in Product Evaluation ... 275 Francisco Rebelo, Ernesto Filgueiras, and Marcelo M. Soares
Chapter 20 Digital Human Modeling in the User-Centered Design Process ... 293 Stephen J. Summerskill and Russell Marshall
Chapter 21 Digital Human Modeling in Product Evaluation ... 325 Maria Lucia Leite Ribeiro Okimoto
Chapter 22 Three-Dimensional Foot Imaging: Axial Alignment Theory in Footwear
Design, Fit, and Function ... 333 Anette Leonor Telmo Thompson, Bernhard Zipfel, and Saramarie Eagleton
Chapter 23 Science of Footwear Design ... 365 Ravindra S. Goonetilleke, Channa P. Witana, and Shuping Xiong
Chapter 24 Virtual Reality in Consumer Product Design: Methods and Applications ... 381 Francisco Rebelo, Emília Duarte, Paulo Noriega, and Marcelo M. Soares
Section iV User-centered Design of consumer Products
Chapter 25 Product Design: User-Centered versus a Task-Based Approach ...405 Martin Groen and Jan Noyes
Chapter 26 Needs Analysis: Or, How Do You Capture, Represent, and Validate User
Requirements in a Formal Manner/Notation before Design ... 415 K. Tara Smith
Chapter 27 Users’ Interactions with Design Models ... 429 M.J. Rooden and H. Kanis
Chapter 28 Eco-Design: The Evolution of Dishwasher Design and the Potential for a More User-Centered Approach ... 441 Elies Dekoninck and Edward W. A. Elias
Chapter 29 User-Centered Design Method to Attend Users’ Needs during Product Design Process: A Case Study in a Public Hospital in Brazil ... 455 Raimundo Lopes Diniz and Marcelo M. Soares
xi
Preface
Every day, we interact with thousands of consumer products. As users, we expect these products, no matter how simple or complex, to perform their expected functions in a safe, reliable, and efficient manner. Unfortunately, this is not always the case, as designing consumer products that satisfy human needs and expectations is not an easy task. The design process that involves the application of human factors and ergonomics (HF/E) principles and knowledge strives to achieve the above goals and, at the same time, reduce the risk of product malfunction or failure, reduce the potential for accidents, and contribute to overall product acceptance and utility, all while reducing the total product life cycle cost.
HF/E is a unique and far-reaching discipline that focuses on the nature of human–artifact inter- actions, which are viewed from a unified perspective on science, engineering, design, technology, and management of human-compatibility systems (Karwowski 2005). The HF/E discipline pro- motes a holistic, human-centered approach that considers physical, cognitive, social, organizational, environmental, and other design-relevant factors. As such, HF/E aids designers by raising their awareness of the full scope of knowledge required when designing consumer products, and plays an important role in facilitating a better performance of consumer products in general. HF/E-based design of products encompasses a wide variety of consumer preferences, and accounts for differ- ences in such preferences due to factors such as age, gender, or health issues.
The goal of the human-centered design paradigm as applied to consumer products is to improve levels of user satisfaction, efficiency of use, increase comfort, and assure safety under normal use as well as foreseeable misuse of the product. It is in this context that we are very pleased to pres- ent the first volume of the Handbook of Human Factors and Ergonomics in Consumer Product Design. The motivation to produce this Handbook was to facilitate wider acceptance of HF/E as an effective body of knowledge for improving quality of life and safety for millions of users of con- sumer products with a variety of needs and expectations. In this Handbook, consumer products are defined as those goods used by the general public without any special training, skills, or supervi- sion. Consumers are individuals of any age, gender, or physical condition with varying educational, cultural, and economic backgrounds. Consumer products are usually used in or around the home, in a social setting, rather than in a workplace environment with commercial needs.
Currently, there is substantial and convincing evidence that the application of HF/E knowledge can improve critical features of consumer products. These features include: ease of use, ability to learn product functions, efficiency, comfort, safety, and adaptability, all of which meet the needs and contribute to consumer satisfaction. Therefore, this two-volume Handbook aims to offer a com- prehensive review of the HF/E state of the art relevant to design, development, testing, evaluation, and use of consumer products. The Handbook also aims to provide a comprehensive source of infor- mation regarding new methods, techniques, and software applications for consumer product design.
The first volume, Human Factors and Ergonomics in Consumer Product Design: Methods and Techniques, contains 29 chapters divided into four sections. Section I contains information about a variety of methods and techniques that can be applied in product design. These include the user- centered design approach, starting with a definition of users, the tasks they perform, and a way to translate design research into useful and usable products. Also included are chapters about human design technology, consumer products conceptual design, and development of smarter products using a systems engineering approach.
Section II, which contains 13 chapters, discusses the user-centered design process, starting with a discussion of how mental workload affects every day interactions with consumer products, and what lessons may be applied to product design. Other chapters focus on the various aspects of
creativity, innovation, standards and guidelines, culture, environment, affect, aging, and complexity in product design process.
Section III contains six chapters that consider the ever-increasing role of information technol- ogy, including digital imaging, video and other media, and virtual reality applications in consumer product design. Finally, section IV contains five chapters focusing on a variety of user-centered aspects of consumer product development. These chapters discuss such topics as user-centered vs.
task-based approach, articulation and assessment of user requirements and needs, interaction with design models, as well as eco-design.
We hope that this first volume will be useful to a large number of professionals, students, and practitioners who strive to incorporate HF/E principles and knowledge in the design of consumer products in a variety of applications. We also hope that the knowledge presented in this volume will ultimately lead to an increased appreciation of the benefits of the HF/E discipline by ordinary consumers of the myriad of products used every day, and increase the HF/E literacy (Karwowski 2007) of citizens around the world.
Waldemar Karwowski Orlando, Florida, USA Marcelo M. Soares Recife, Brazil Neville A. Stanton Southampton, England
REFERENCES
Karwowski, W. 2005. Ergonomics and human factors: The paradigms for science, engineering, design, technol- ogy, and management of human-compatible systems. Ergonomics 48 (5): 436–63.
———. 2007. Toward an HF/E-literate society. Bulletin of the Human Factors and Ergonomics Society 50 (2): 1–2.
xiii
Acknowledgments
The editors would like to take this opportunity to express their sincere appreciation to Madelda Thompson for her invaluable help and assistance in editing the final draft of the Handbook of Human Factors and Ergonomics in Consumer Product Design. Marcelo Soares would also like to acknowledge the CNPq – Brazilian National Council of Research and Development, which sponsored his post doctorate research conducted at the Department of Industrial Engineering and Management Systems at the University of Florida, Orlando, USA, and Nalva and Gabriel Soares for their love and unfailing encouragement, support, and patience.
xv
Editors
Waldemar Karwowski, PE, is currently professor and chairman of the Industrial Engineering and Management Systems Department at the University of Central Florida, Orlando. Florida. He holds an MS (1978) in production engineering and management from the Technical University of Wroclaw, Poland, and a PhD (1982) in industrial engineering from Texas Tech University, USA. He was also awarded the DSc (dr hab.) postgraduate degree in management science, by the Institute for Organization and Management in Industry (ORGMASZ), Warsaw, Poland (2004). He is a recipient of honorary doctorate degrees, including those from the South Ukrainian State University of Odessa, Ukraine (2004), the Technical University of Koscie, Slovakia (2006), and the MIRA Technical University of Moscow, Russia (2007). Dr. Karwowski is a board certified professional ergonomist (BCPE). His research, teaching, and consulting activities focus on human systems integration, work systems compatibility, human–computer interaction, prevention of work-related musculoskeletal disorders, manufacturing enterprises and management ergonomics, and theoretical aspects of ergo- nomics science. He is past president of the International Ergonomics Association (2000–2003), and of the Human Factors and Ergonomics Society, USA (2006–2007). Dr. Karwowski currently serves as editor of Human Factors and Ergonomics in Manufacturing (John Wiley), and the editor-in-chief of Theoretical Issue in Ergonomics Science (TIES) (Taylor & Francis Group, London).
Marcelo M. Soares, PhD, is currently a professor in the Department of Design and the Department of Industrial Engineering at the Federal University of Pernambuco, Brazil. He was an invited lec- turer at the Technical University of Lisbon, Portugal, and the University of Guadalaraja, Mexico.
He was also a visiting scholar and lecturer at the University of Central Florida, USA. He holds an MS in production engineering from the Federal University of Rio de Janeiro, Brazil. He was also awarded his PhD at the Loughborough University in England. Dr. Soares is a professional certi- fied ergonomist from the Brazilian Ergonomics Association (ABERGO). He was president of this organization for seven years. He has also provided leadership in Human Factors and Ergonomics Latin America and internationally as a member of the executive committee of the International Ergonomics Association. He is currently the chairman of IEA 2012 (the Triennial Congresses of the International Ergonomics Association), which will be held in Brazil. His research, teaching, and consulting activities focus on manufacturing ergonomics, usability, product design, and information ergonomics. Dr. Soares currently serves on the editorial board of Theoretical Issues in Ergonomics Science (TIES), Human Factors and Ergonomics in Manufacturing, and several other publications in Brazil. He has also done significant research and consulting for several companies in Brazil.
Neville A. Stanton, PhD, was appointed chairman in human factors in the School of Civil Engineering and the Environment at the University of Southampton in February 2009. Prior to that, he held a chair in human factors at Brunel University (since September 1999). Previously, he held a lectureship and then readership in engineering psychology at the University of Southampton (since September 1993). Professor Stanton was also a visiting fellow at Cornell University during 1998. He has published over 140 peer-reviewed journal papers (including papers in Nature and New Scientist) and 18 books on human factors and ergonomics. In 1998, he was awarded the Institution of Electrical Engineers Divisional Premium Award for a co-authored paper on engineering psychol- ogy and system safety. The Ergonomics Society awarded him the Otto Edholm medal in 2001 and the President’s Medal in 2008 for his contribution to basic and applied ergonomics research. In 2007, The Royal Aeronautical Society awarded him the Hodgson Medal and Bronze Award with colleagues for their work on flight-deck safety. He also acted as an expert witness for Network
Rail in the civil litigation following the Ladbroke Grove rail accident. He has undertaken research work for the Ministry of Defence, and received grant funding from ESRC, EPSRC, EU, DTI, Ford, Jaguar, and National Grid. Professor Stanton is an editor of the journal Ergonomics and is on the editorial board of Theoretical Issues in Ergonomics Science. Professor Stanton is a fellow and char- tered occupational psychologist registered with The British Psychological Society, and a fellow of The Ergonomics Society. He has a BSc (Hons) in occupational psychology from the University of Hull and a PhD in human factors from Aston University in Birmingham.
xvii
Contributors
Gabriel García Acosta
Centre de Disseny d’Equips Industrials Universitat Politècnica de Catalunya Barcelona, Spain
Tareq Ahram
Department of Industrial Engineer and Management Systems
University of Central Florida Orlando, Florida
Barry Beith
HumanCentric Technologies Cary, North Carolina Corinne Bornet Université Paul Verlaine Metz, France
Eric Brangier
Université Paul Verlaine Metz, France
Elies Dekoninck
Department of Mechanical Engineering, Innovative Design and Manufacturing University of Bath
Bath, United Kingdom Raimundo Lopes Diniz
Department of Design and Technology/Post- Graduation Program in Environment and Health
Federal University of Maranhão São Luís, Brazil
Emília Duarte
FMH – Technical University of Lisbon Lisbon, Portugal
Saramarie Eagleton
Department of Human Anatomy and Physiology, Faculty of Health Sciences University of Johannesburg
Auckland Park, South Africa
Edward W. A. Elias
Department of Mechanical Engineering, Innovative Design and Manufacturing University of Bath
Bath, United Kingdom Anne Ferguson
Consumer & Public Interest Unit British Standards Institution London, United Kingdom Ernesto Filgueiras
FMH – Technical University of Lisbon Lisbon, Portugal
Wolfgang Friesdorf
Department of Human Factors Engineering and Product Ergonomics
Technical University Berlin, Germany Sebastian Glende
Department of Human Factors Engineering and Product Ergonomics
Technical University Berlin, Germany
Ravindra S. Goonetilleke
Department of Industrial Engineering and Logistics Management
Hong Kong University of Science and Technology Kowloon, Hong Kong, People’s Republic of China Martin Groen
School of Experimental Psychology University of Bristol
Bristol, United Kingdom
Alma Maria Jennifer A. Gutierrez Industrial Engineering Department De La Salle University
Manila, Philippines Gordon Hayward Consumer Risk Limited London, United Kingdom
Martin G. Helander
Division of Systems & Engineering Management Nanyang Technological University
Singapore
Hardianto Iridiastadi Institut Teknologi Bandung Jawa Barat, Indonesia H. Kanis
Faculty of Industrial Design Engineering Delft University of Technology
Delft, The Netherlands Waldemar Karwowski
Department of Industrial Engineer and Management Systems
University of Central Florida Orlando, Florida
David Ernesto Puentes Lagos School of Industrial Design Universidad Nacional de Colombia Bogotá, Colombia
Russell Marshall
Department of Design and Technology Loughborough University
Loughborough, United Kingdom Elizabeth Mauer
Graco Children’s Products Atlanta, Georgia
Karen Lange Morales School of Industrial Design Universidad Nacional de Colombia Bogotá, Colombia
Michel Nael
Ergonomics Training and Consultancy Rennes, France
Paulo Noriega
FMH – Technical University of Lisbon Lisbon, Portugal
Jan Noyes
School of Experimental Psychology University of Bristol
Bristol, United Kingdom
Raymy Kate O’Flynn
Department of Manufacturing and Operations Engineering
University of Limerick Limerick, Ireland Chang Geun Oh
Virginia Polytechnic Institute and State University
Blacksburg, Virginia
Maria Lucia Leite Ribeiro Okimoto Department of Mechanical Engineering Federal University of Paraná
Curitiba, Brazil
Manuel Ricardo Ruiz Ortiz School of Industrial Design Universidad Nacional de Colombia Bogotá, Colombia
Corinna Proctor
HumanCentric Technologies Cary, North Carolina Francisco Rebelo
FMH – Technical University of Lisbon Lisbon, Portugal
Miles Richardson
School of Social Sciences, Faculty of Education, Health and Sciences University of Derby
Derby, United Kingdom M. J. Rooden
Human Technology
The Hague University of Applied Sciences The Hague, The Netherlands
Serge N. Sala-Diakanda
Department of Industrial Engineer and Management Systems
University of Central Florida Orlando, Florida
Lawrence J. H. Schulze
Department of Industrial Engineering University of Houston
Houston, Texas
Rosemary R. Seva
Industrial Engineering Department De La Salle University
Manila, Philippines K. Tara Smith HFE Solutions Ltd.
Dunfermline, Fife, United Kingdom Tonya L. Smith-Jackson
Virginia Polytechnic Institute and State University Blacksburg, Virginia
Marcelo M. Soares Department of Design
Federal University of Pernambuco Recife, Brazil
Neville A. Stanton
School of Civil Engineering and the Environment
University of Southampton Southampton, United Kingdom Stephen J. Summerskill
Department of Design and Technology Loughborough University
Loughborough, United Kingdom Magdalen Galley-Taylor
Independent Ergonomics Consultant Devon, United Kingdom
Anette Leonor Telmo Thompson Anette Thompson & Associates Inc.
Marine Parade, South Africa George Edward Torrens Loughborough Design School Loughborough, United Kingdom
Thomas Waldmann
Department of Manufacturing and Operations Engineering
University of Limerick Limerick, Ireland Channa P. Witana
Department of Industrial Engineering and Logistics Management
Hong Kong University of Science and Technology
Kowloon, Hong Kong, People’s Republic of China Shuping Xiong
Department of Industrial Engineering and Logistics Management
Hong Kong University of Science and Technology
Kowloon, Hong Kong, People’s Republic of China Toshiki Yamaoka
Department of Design and Information Sciences
Wakayama University Wakayama, Japan Mark S. Young
School of Engineering and Design Brunel University
Uxbridge, United Kingdom Luz Mercedes Sáenz Zapata School of Architecture and Design Universidad Pontificia Bolivariana Medellín, Colombia
Bernhard Zipfel
Bernard Price Institute for Palaeontological Research and Institute for Human Evolution University of the Witwatersrand
Wits, South Africa
Section I
Methods for Consumer
Products Design
3
1 Techniques to Translate Design Research into Useful, Usable, and Desirable Products
Elizabeth Mauer and Corinna Proctor
1.1 INTRODUCTION
Developing successful new products or even redesigning existing products is never an easy process.
As human factors professionals, we often advocate field research before starting a design as an excellent way to understand our users. We read about other companies that have conducted field research projects as part of the product development process, wherein the resulting product was so fantastic that it increased the company’s stock price, saved the company untold amounts of money, and/or awards and accolades rained down on them for their creativity and innovation. We present stories like these to our clients as examples of how field research can help their products, too.
However, most experienced practitioners know this is not how projects usually go. Conducting design research is a messy, expensive process. What designer hasn’t been excited to go into the field and learn about a new product/process/user/industry, only to have that feeling turn to sheer panic as the data start flowing in at a manic rate? The data collected are messy, not easily digestible, and in all different formats. How do you turn all that mess into new product ideas or redesign efforts that will knock your client’s socks off and make them feel like it was money well spent?
The reality is that most designers are overwhelmed at this point. The amount of data they have collected can be mind-boggling, and just making sense of it all can seem like an insurmountable task, particularly when clients are eagerly awaiting the answers they are so excited about and have CONTENTS
1.1 Introduction ...3 1.2 Stages of Design Research ...4 1.2.1 Stage 1: Define the Research Plan ...4 1.2.1.1 Techniques that Help ...4 1.2.2 Stage 2: Organize the Data ...7 1.2.2.1 Techniques that Help ...8 1.2.2.2 Output of this Stage ... 13 1.2.3 Stage 3: Interpret the Data ... 14 1.2.3.1 Generate a Written Overview of the Research ... 14 1.2.3.2 Know Your Sample ... 15 1.2.3.3 Find Common Themes... 15 1.2.3.4 New Idea Generation: Where Does It Come From? Is it Hiding Under
a Rock? ... 17 1.2.4 Stage 4: Apply the Research to Design... 17 Acknowledgment ... 19 Reference ... 19
been wondering about for months. Of course, just as this wave of panic is spreading, the client will call you and ask if you have a quick summary or want to schedule a call/presentation to go over the results. What you want to avoid is latching on to a few salient themes you remember from your time in the field and to avoid making conclusions based on only vague memories. This could result in unused data and raise questions about time and money spent.
So how can you avoid this? At each stage of a design research effort, there are techniques you can apply that will (1) narrow down the amount of data collected to just what you are interested in, (2) turn the data you do collect into a coherent story that will serve as a basis for developing new products and/or redesigning existing ones, and (3) save your sanity in the process. This chapter is devoted to the discussion of these techniques, which although not earth-shattering and revolution- ary, will help you turn all the data you collect into fantastic new product ideas that just may be earth-shattering and revolutionary (or at least help you avoid the awkward “what did you spend all this money actually doing” conversation with your client).
1.2 STAGES OF DESIGN RESEARCH 1.2.1 Stage 1: Define the ReSeaRch Plan
Outlining a well-defined, focused research plan is the first step in any successful design research effort. This stage will lay the groundwork for data collection. It is important to do this so that the data you collect will only be what you need and you won’t be overwhelmed with unnecessary infor- mation later on.
The techniques to use at this stage are affected by
• Amount of time and money available
• Specific goals of the research (i.e., what questions you want to answer)
• Nature of the data to be collected
• Amount of access to users and/or subject-matter experts
• Developing new product vs. redesigning existing product
1.2.1.1 Techniques that Help
1.2.1.1.1 Clearly Establish the Research Goals
The first (and most important) step in any successful design research effort is to clearly establish the research goals. This step will ensure that the team members are on the same page and the clients and other stakeholders are also on board. There is nothing worse than when you finish a research effort and present the findings to a client to begin design, only to find out that you didn’t answer the questions they were interested in (“we already knew that—what did you spend all that money on?”).
So how can you avoid this? Start by asking your client and other stakeholders what questions they want the research to answer. Most clients have goals in mind—after all, they have to justify to their internal management the reasons for spending the money in the first place. Goals can be at either end of the spectrum, ranging from broad (e.g., “we want to know everything about our small business users”) to focused (e.g., “we want to understand the ultrasound workflow and what factors affect it”). The more focused the goals are, the better it is for everyone involved.
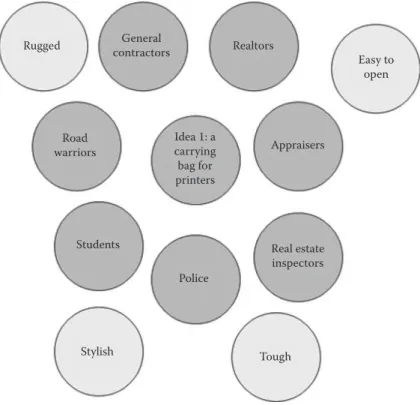
If the goals are toward the broad end of the spectrum, you will need to spend some time refining them to make them more focused. A quick and easy way to focus research goals is to create an affin- ity diagram. This technique is done as a team, and can include members from the client and/or other stakeholders. Each person sits around a table with the broad research goals, a pad of sticky notes, and a pen. For a designated amount of time (perhaps 10 min), each person writes down focused
research questions that fit underneath the broad goals (one question per sticky note). For example, if the broad goal is “we want to know everything about our small business users,” then a focused research question might be “how do small business users manage their motor vehicle fleets?” At the end of this time period, the team posts the sticky notes onto a wall for all to see. Start grouping similar questions together. If a question fits into more than one group, write it on multiple sticky notes. When the grouping is completed, give each one a name that describes the research questions in it. Groups of sticky notes can also be combined in a parent–child relationship, but as a general rule of thumb try to keep any hierarchy to three levels or less to prevent overcomplicating the dia- gram. These final groups represent more focused research goals. If your diagram is showing a lot of hierarchy and research questions, you will need to constrain your own focus for this effort and save the other questions for other projects. This exercise can be repeated until you are satisfied that the goals are sufficiently focused. Figure 1.1 shows an example of a completed affinity diagram.
1.2.1.1.2 Select the Appropriate Data Collection Method
Now that you have focused research goals, the next step is to select the appropriate research meth- odology (or a series of methodologies) to collect the data that will meet these goals.
When considering the different methodologies, think about the nature of the data you will be collecting. Some methodologies are better suited to collecting certain data than others. Questions to ask yourself and your team include:
• Can you observe the tasks of interest in a short time period or do they occur over a longer time period? For example, processing a benefits form for a new employee can be observed in one session. However, the development of an aircraft occurs over several years and most likely could not be observed in one session.
• Do you need to get information out of people’s heads (e.g., “how do you process a benefits form?”) or do you need to get information about more musculoskeletal tasks (e.g., “how do you deliver packages?”)?
• Is the environment in which you want to collect data mobile (e.g., a delivery driver’s truck) or stationary (e.g., a secretary’s desk)?
Table 1.1 lists some common research methodologies and some advantages and disadvantages of each to aid in your selection.
FIGURE 1.1 A completed affinity diagram.
1.2.1.1.3 Develop Data Collection and Analysis Plan
After deciding on a research methodology, the next step is to develop a detailed protocol for your sessions. A protocol is an outline of what will happen in each session, from the beginning introduc- tions to the closing “thank you for allowing us to observe.” Sometimes, protocols are also called moderator guides or discussion guides.
A protocol is important because it will keep the session moderators following roughly the same format and makes sure that they collect the right data and observe the right tasks. It ensures con- sistent formats for each session. It is also important for the user you are observing so that they understand the purpose of the session and what you want from them.
At this step, you will also need to think about what types of data you will be reporting and using in support of the research goals. For example, if you want to report numerical results (e.g., “3/10 users did not use the scanning feature”) you will need to make sure that every user is asked the same questions during each session so that your analysis will have a consistent representation from all the participants. Finally, you need to make sure that the data you will be collecting will answer the research questions and goals you’ve defined.
TABLE 1.1
Common Research Methodologies
Methodology Advantages Disadvantages
Surveys • Inexpensive • High-level data
• Can reach many respondents • No opportunity for follow-up One-on-one interviews • Can yield in-depth data • Moderately expensive
• Opportunities for follow-up • Out of context
• Some things hard to elicit from participants Focus groups • Participants can build on one another’s
responses
• Moderately expensive
• Quick and easy to assemble • Can suffer from group think/bias from one dominant participant
• Extreme views can be weeded out/
normalized
• Require experienced moderator Contextual inquiry • Yields very in-depth data • Expensive
• Lots of qualitative data • Small sample sizes
• Easy to come up with new product ideas • Not feasible for collecting longitudinal data
• Holistic view of product/process because it is in context
• Requires experienced moderator
Comparative analysis • Can benchmark performance • Hard to find commonalities among different products
• Shortcomings and strengths identified • Hard to come up with truly new product ideas
• Can be inexpensive
• Easy to identify gaps in design
Usability testing • Environmental control • Hard to come up with truly new product ideas
• Yields quantitative data • Can be expensive
• Direct observation of problems • Setting not naturalistic
• Hard to infer reasoning behind problems encountered
Observational research
• Naturalistic setting—users don’t know they are being observed
• No user interaction
• Yields very in-depth data • No environmental control
• Can’t predict who you will see
1.2.1.1.4 Pilot Data Collection and Analysis Plan
We cannot stress the importance of piloting the data collection plan enough. A pilot is essentially a
“dress rehearsal” of an entire session from beginning to end. The purpose of it is to allow the ses- sion moderators to practice, as well as identifying gaps, mistakes, unnecessary steps, and things that don’t belong in the protocol. You will also get an idea of the flow and the length of the session.
A step that is often overlooked is piloting your data analysis plan. Sometimes when a project has a tight timeline, it is tempting to develop your data collection plan, pilot it, and then jump right into actual data collection. It is a good idea to take the data from your pilot session and run through your analysis procedures before beginning actual data collection, to ensure the data collected answer the research questions.
As an example, on a project that had a very tight timeline, we wisely conducted a pilot for our data collection plan. However, we neglected to analyze the pilot results prior to beginning the actual data collection. Before we knew it, we had mounds of data from 24 participants that were in a for- mat that was not conducive to meeting our timeline. As we dug into the analysis stage, we realized that had we piloted our data analysis plan earlier, we could have tweaked the protocol to collect the data in a format that was better suited for more efficient analysis. We were stuck trying to find needles in haystacks. Time and sanity could have been saved with this simple step.
1.2.1.1.5 Collect the Data
Now you are ready for actual data collection. When you begin, be sure to invite all stakeholders to observe. Another good idea is to have team members from different disciplines (including graphic design, industrial design, marketing, and development). A diverse, cross-functional team can help set the stage for innovative and desirable product ideas.
1.2.2 Stage 2: ORganize the Data
At this point, the data collection is complete (or nearing completion). If you are like most designers, you and your team are sitting in your office, perhaps surrounded by notes, transcripts, tapes, and assorted equipment. Panic is quickly spreading through you as you think about how you are going to take all those data—your notes, team members’ notes, transcripts, pictures, videos—and turn them into something that will be useful for design. Don’t be afraid! This happens to even the most experienced designers. The key is to remain calm and not resort to hand wringing or hysterics. If you want to succeed, it is time for action.
You may find it tempting to skip this stage. After all, you are probably exhausted from collecting all those data. Maybe you already have some great ideas based on what you saw. It’s much more fun to begin designing right away than to spend more time poring over your data, and you’ve already seen everything there is to see. Who hasn’t thought that?
Our suggestion is to not fall into this trap. Spend time now organizing the data so that they are digestible and addressable in some form. It also establishes a shared understanding of these data on your team. You may already have some great design ideas based on what you saw, but what if another team member says he/she saw something different? Who is correct? At this point neither of you is correct—until you organize your data, you won’t be able to know what really happened dur- ing data collection. This step provides a complete picture of your data for everyone on your team.
Without it, you will focus on a couple of findings that you found particularly interesting or poignant and prematurely make conclusions that might lack support.
There are many techniques that help designers organize their data quickly and efficiently (while saving their sanity). The techniques you choose will depend on
• Amount of time and money available
• Format of data collected (notes, transcripts, pictures, videos, etc.)
• Desired output for team/client
1.2.2.1 Techniques that Help
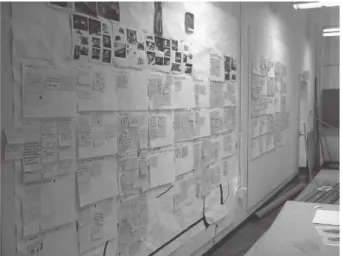
1.2.2.1.1 Dedicate a Space to Use for the Project
If you are lucky enough to have a dedicated room to use during your project, take it. Ideally, it is equipped with whiteboards, lots of wall space, and a table. You will generate a lot of documents dur- ing this process, so having one place to organize everything is very convenient. Your design room can also serve to get your team immersed in the right mindset and thinking about the research as soon as they enter.
If you are like most designers, however, you will have to be more flexible and move around. You can use large pieces of foam core board to display the various documents. These boards can be moved in and out of design rooms while keeping all your documents displayed and together.
1.2.2.1.2 Restate Your Research Goals
Before you start anything, you will need to revisit the goals of the research. This is especially important when the data were collected months or even years before, or when you didn’t collect the data to begin with. Refocusing yourself around these goals is crucial at this point, and it will help frame the scheme with which you organize your data. You should naturally begin to organize your data around the different research questions, literally and physically.
One terrific way of doing this is to list the goals of the research on large sheets of paper and pin them high up on the wall of your designated room. Make sure they are phrased clearly and concisely (no one will remember a goal that is longer than a simple phrase or sentence). In this way, the goals remain clearly visible and serve as a constant reminder to the team. For example:
The goals of this study are
• To explore and document the physical environment and typical triggers for printer usage
• To learn what/why people print vs. leaving in electronic form
• To identify the most common usage problems with printers
• To compare printer usage in small, medium, large, and government office environments
1.2.2.1.3 Compile Team Notes in One Document
The best way to begin your data organization effort is to compile all team member notes into a single document. This document provides an overview of all participants across all team members and eliminates having to open multiple documents and flipping back and forth to compare them.
This is also a good way to review what occurred in each session, and it doesn’t take very long to do.
We like to use Microsoft Excel for this task. Put the participants in the rows and the discussion top- ics from your data collection protocol in the columns. Then combine all notes for each participant on each discussion topic into the relevant cells. Unfortunately, Excel doesn’t allow huge amounts of text in a cell, so you may need to summarize the notes to make them fit in a cell.
If you do not have any session notes (because perhaps you didn’t collect the data yourself) you will have to go back and watch each video. You can create the Excel spreadsheet and fill it in as you watch each video, recording notes directly to the cells.
Once you create this spreadsheet, it is quite easy to look down a column and see the notes for each participant within a single discussion topic. As you go down, mark anything you deem impor- tant or noteworthy for later analysis. You can do this by using different cell colors, making text bold, or any combination of formatting that you like. It is important to be extremely objective during this exercise so that your own memory of the research doesn’t bias what you find in the notes.
Do not spend too much time thinking about anything you find just yet; in later stages you will go back through this and decide what it all means. Right now, you are just creating a visual representa- tion of your data so that your eye can quickly find important items during later stages. Figure 1.2 shows an example spreadsheet with compiled notes.
1.2.2.1.4 Create an Affinity Diagram
Another quick and easy technique to organize the data is to create an affinity diagram, similar to the way you narrowed down the focus of the research goals in stage 1. The only difference is that each person sits around a table with their research notes and writes down observations onto the sticky notes. The notes are grouped, as they were in stage 1. The final groups are your focus points for the later stages of analysis and design.
This technique can also be done while the team watches videos of the sessions. Although it takes longer, you can glean additional detail that may not be captured in notes or transcripts, particularly about things that don’t lend themselves well to textual communication (such as the physical loca- tions of objects or actions a participant performs but does not verbalize).
1.2.2.1.5 Create Work Models
One of the best ways to organize data from field research is to create work models (see Beyer and Holtzblatt (1998) for discussion). These models allow you to visually depict the data in a way that allows you to quickly identify relationships, inconsistencies, redundancies, and omissions. Although they take more time than other techniques, they are well worth the effort if you have the time and money.
FIGURE 1.2 A sample Excel spreadsheet with all session notes compiled.
Beyer and Holtzblatt define five work models, which we will briefly summarize:
• Flow
• Sequence
• Artifact
• Cultural
• Physical
To create these models, the team sits around a table with a session transcript. If a transcript is not available, have the team watch the session video and pause as appropriate. Designate one person to draw each model on a whiteboard as the team creates them. Everyone goes through the transcript (or video) in chronological order. It is important that everyone stick to what the participant actually said and did, not interpretations of why they said/did that or memory of what they said/did, as much as possible. That way the models will be based on the data observed and not premature interpreta- tions of what you observed.
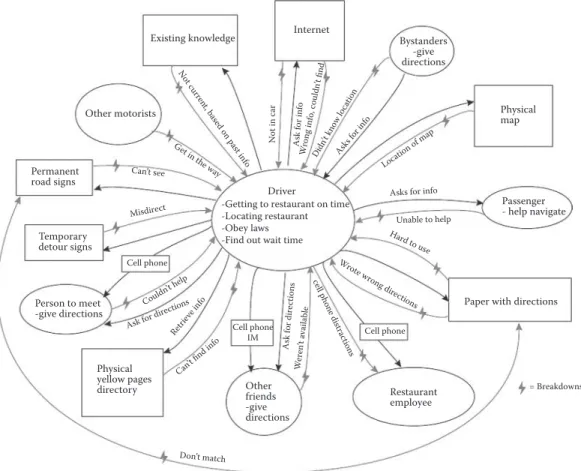
1.2.2.1.5.1 Flow Model The flow model depicts the people and artifacts with which the partici- pant interacts. It also shows the flow of communication and artifacts between people. To begin the flow model, draw a circle in the middle of the workspace and label it with the participant number (e.g., “User 1”). Any roles and responsibilities the participant assumes (e.g., “Driver,” “Navigator,”
“Parent”) are written inside that first circle beneath the participant number. If the participant inter- acts with another person or group, draw a circle for it, label it with the person or group name, and connect it to the participant’s circle with an arrow indicating the direction of the interaction. Place a short phrase on the arrow to describe the interaction. For example, if the participant called tech sup- port, a line would go from the participant’s circle to the tech support’s circle with the phrase “calls for computer help.” If the participant interacts with another object (e.g., computer, desk calendar, printer), draw a rectangle for it, label it with the object name, and connect it to the participant’s circle in the same manner. If an object flows between two people (e.g., the participant sends a document to another person), you can place that object in between the two circles. If the participant mentions or experiences a problem with any entity in the flow model, place a red lightning bolt on the line with a short phrase indicating the problem. When this model is complete, you will have a bird’s eye view of the participant’s organization, showing the people and responsibilities, the communication paths between people, and the things communicated (Beyer and Holtzblatt 1998). Figure 1.3 shows a sample workflow model for a person trying to find a restaurant and make a reservation while driving a car during heavy traffic.
1.2.2.1.5.2 Sequence Model A sequence model represents the set of steps to accomplish the participant’s tasks, along with the triggers and the participant’s intent for each step. To create this model, start by writing down the participant’s overall intent for the task and the trigger that initiated the task. For example, the participant’s task may be to read an email, and the trigger for that task is the appearance of the notification icon in the computer’s system tray. Underneath the intent and trigger, write down each step the participant took to accomplish it. If there are steps that interfere with or do not support the intent, mark them with a red lightning bolt with a short phrase indicating the problem. When you are finished creating this model, you will have a detailed structure of the work the participant completed, which will be very useful during later stages (Beyer and Holtzblatt 1998). Figure 1.4 shows part of an example sequence model for creating a document for a client.
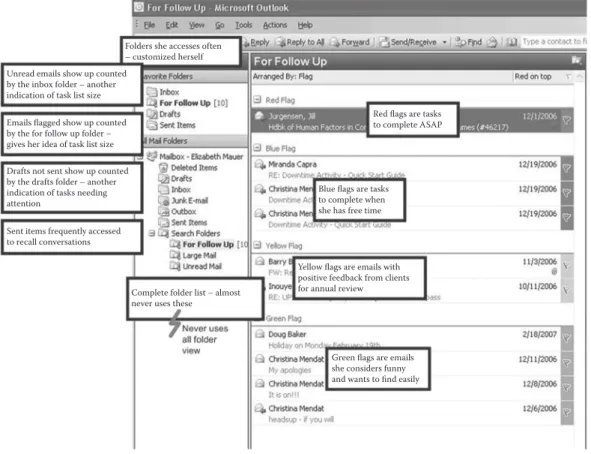
1.2.2.1.5.3 Artifact Model An artifact model is an annotated drawing of an artifact that a par- ticipant uses to complete work. Examples are personal organizers, to-do lists, cell phones, docu- ments, or phone books. They are passed between people and groups in the flow model. To create an artifact model, start by re-drawing it on your whiteboard. Label each part of the artifact’s structure.
Annotate each part of the artifact with its purpose or how it supports its purpose. If there are parts of the artifact that interfere with or do not support the participant’s tasks, mark them with a red lightning bolt with a short phrase indicating the problem. When this model is complete, you will have a visual representation of what information is important to the participant and what parts of the artifact supported the tasks (Beyer and Holtzblatt 1998). Figure 1.5 shows part of an example artifact model for an email application.
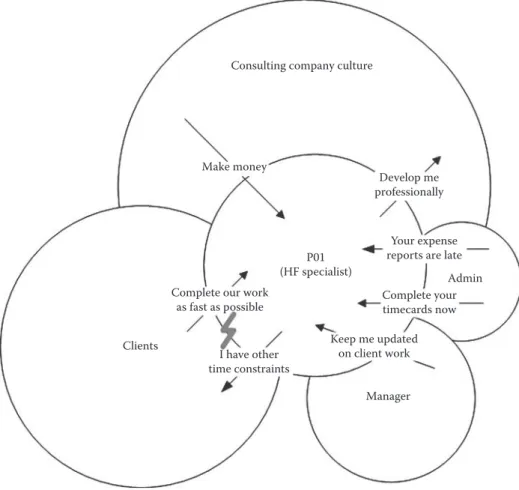
1.2.2.1.5.4 Cultural Model A cultural model provides a tangible representation for the culture that often influences your participants. It shows the people, organizations, and groups that influence each other in the participant’s culture. To begin this model, draw a circle in the middle of the work- space and label it with the participant number (e.g., “User 1”). Put their role in parentheses below
Existing knowledge Internet
Not in car
Ask for inf
o
Wrong info, couldn’t find Didn
’t know lo cation
Asks for info
Asks for info Unable to help Hard to use Wrote wron
g directions cell phon
e distractions
Ask for directions Can’t find inf
Retrie o ve inf
o Ask for dir
ections Couldn
’t help
Don’t match
Weren’t available
Location of ma p Bystanders
-give directions
Physical map
Passenger - help navigate
Paper with directions Driver
-Getting to restaurant on time -Locating restaurant -Obey laws -Find out wait time
Restaurant employee Other
friends -give directions Cell phone
IM Cell phone
Misdirect Can’t see
Get in the way Not cu
rrent, b ased o
n past info
Cell phone
Physical yellow pages
directory = Breakdowns
Person to meet -give directions
Temporary detour signs Permanent road signs
Other motorists
FIGURE 1.3 A sample flow model for a driver during a navigation task.
Intent: Create design document
Open design template
Open web browser
Save file with new file name
Go to extranet site
Open design stencils
Upload design document
Site down – has to email large file
Drag/Drop shapes onto document
Open email
Save and close file
Send email to client with link
to document Trigger: Client called and
asked
FIGURE 1.4 The start of a sample sequence model for creating a document for a client.
the number. For each influencer of the participant, draw a circle behind the participant’s circle. The size of the circle can be proportionate to the amount of influence that entity has over the participant.
Represent the influences between the circles using arrows with a short phrase indicating the type of influence. If an influence interferes with or does not support the participant’s tasks, mark it with a red lightning bolt with a short phrase indicating the problem. When this model is complete, you will have a visual representation of the cultural context of the participant’s work place (Beyer and Holtzblatt 1998). Figure 1.6 shows the start of a sample cultural model for an employee at a consult- ing company.
1.2.2.1.5.5 Physical Model A physical model visually depicts how physical space affects the participant’s tasks. To create one, start by drawing the participant’s workspace. As you move through the transcript, add in the items that affect the participant’s work, such as telephones, file cabinets, printers, etc. Annotate the drawing with the movement of the artifacts and the participant using arrows. If there are parts of the space that interfere with or do not support the participant’s tasks, mark them with a red lightning bolt with a short phrase indicating the problem. When this model is complete, you will have a visual representation of the participant’s workspace and how that workspace affects their tasks (Beyer and Holtzblatt 1998). Figure 1.7 shows the beginning of a physical model for an office environment.
1.2.2.1.6 Group Photos into a Photo Collage
If you took photos during your sessions, this is a great opportunity to create a photo collage. Start by laying your photos on a large work surface. Begin by grouping the photos by topic. For example,
Unread emails show up counted by the inbox folder – another indication of task list size
Folders she accesses often – customized herself
Emails flagged show up counted by the for follow up folder – gives her idea of task list size
Drafts not sent show up counted by the drafts folder – another indication of tasks needing attention
Sent items frequently accessed to recall conversations
Complete folder list – almost never uses these
Green flags are emails she considers funny and wants to find easily Yellow flags are emails with positive feedback from clients for annual review
Blue flags are tasks to complete when she has free time
Red flags are tasks to complete ASAP
FIGURE 1.5 Part of an artifact model for an email application.
place all photos of the same artifact together, or place all photos of awkward wrist positions together.
If a photo needs to be in more than one group, make a copy of it. Don’t put too much thought into the groups at this point; you’ll analyze more in a later stage. Label each group and pin the groups onto the wall or a piece of foam core board for display. These groups will become focus points for later stages of analysis and design.
1.2.2.1.7 Code Session Videos for Important Events
If you recorded your sessions using a program that allows for video coding, you can watch each session video and flag certain events that you consider important for later analysis. Watching the session videos is probably the most arduous and time-consuming task of the ones discussed here.
However, it can provide a wealth of information for later stages if you have the time and money to do it. Programs such as Morae® allow you to flag an event in a video and add comments to it, score it, or a number of other things. It is also convenient if you would like to make a highlight video of all the important events to show the design team, your client, or other stakeholders.
1.2.2.2 Output of this Stage
When you are done organizing your data, you should have several different artifacts that identify the common themes and focus points you will need for stage 3—interpreting the data.
Consulting company culture
Make money
Develop me professionally
(HF specialist)P01 Complete our work
as fast as possible Clients
I have other time constraints
Manager Keep me updated
on client work Complete your timecards now
Admin Your expense reports are late
FIGURE 1.6 The start of a sample cultural model for an employee at a consulting company.
1.2.3 Stage 3: inteRPRet the Data
The ability to interpret data may not be as simple and straightforward as it sounds. Assuming that your data are clean, relatively reliable and have been intelligently organized (stage 2!), the next logi- cal step is to analyze the data. There are some obvious analyses that have to take place, such as the descriptive information from the sample that you studied. This section will present some common ways to gain control of the data and to start ideating product innovations based on gaps and overlaps.
1.2.3.1 Generate a Written Overview of the Research
For your benefit and that of your team, create a written, yet brief overview of your design research.
This should be very simply stated and will help as you dive into your data. Clients and managers will want to know who was involved, what topics were covered, and when to expect the results.
Often, months can lapse between establishing those goals and reporting the results. Our suggestion, therefore, is to write a concise demographic breakdown of the context of your research and the over- arching goals that were earlier established; and do this even before you start to analyze your results.
All it takes is about one hour of your time. For example:
Observational research of 30 printer owners derived from our four user categories was conducted in May 2007 with the following goals: to make updates to our existing persona profiles and to generate a catalogue of usage models, from the most basic to the unpredictable ways in which our printers are used. A final report of the research will be presented in June.
A brief statement such as this will help to make it well known to others around you what you did and why you did it. Think of it as proactively reinforcing your research so that when it is finalized and reported, there are minimal surprises.
PapersPapers Papers Printer
Phone
Toofar
Trash
Table
Scans docs
arriveDocs
Whiteboard
Frequent interruptions Gets computer help book
Finished scans to bookshelf Handbag
Lamp
BookshelfBookshelf
Scanner highToo
Keyboard
Papers Papers
FIGURE 1.7 A sample physical model for an office environment.