This report presents Indiana policymakers, university officials, and taxpayers with comprehensive but conservative estimates of the university's impact. Collateral benefits would include the financial benefits of university expenses associated with its core mission or the financial benefits of, for example, the service-learning that mobilizes students to work for free in the community. After presenting the core benefits, attention turns to the security benefits of IUPUI.
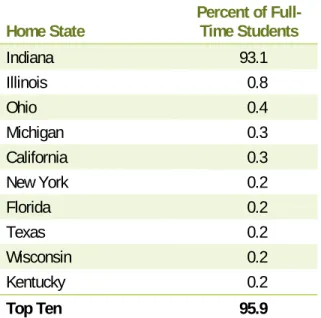
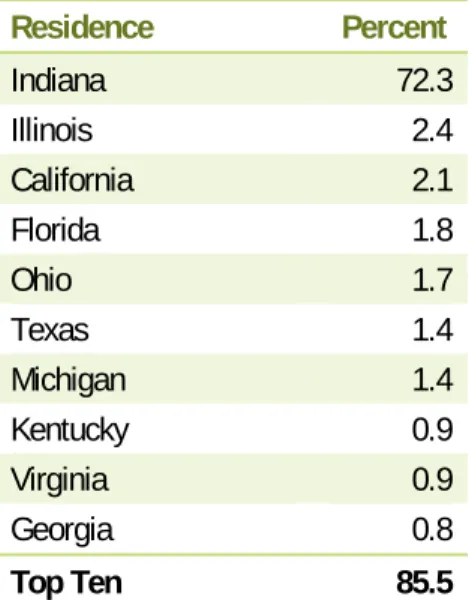
Whether it's the Herron Art Galleries, the IUPUI Sports Complex, or the University Library, IUPUI gives area residents something to be proud of. As Table 3 shows, every state other than Indiana accounts for less than 1 percent of full-time students.

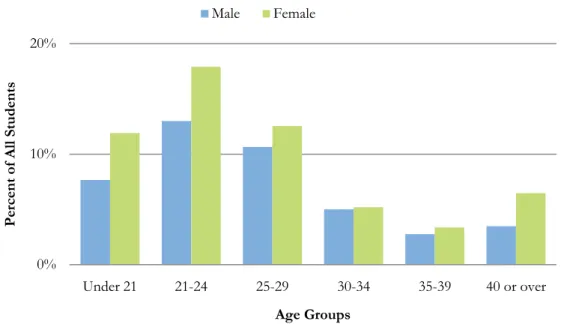
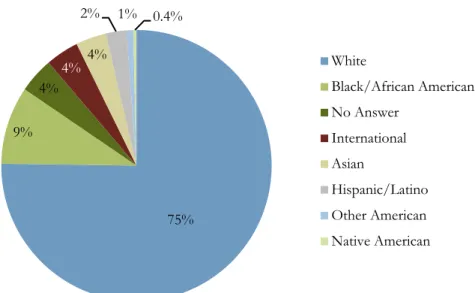
Student Characteristics
Access and Affordability
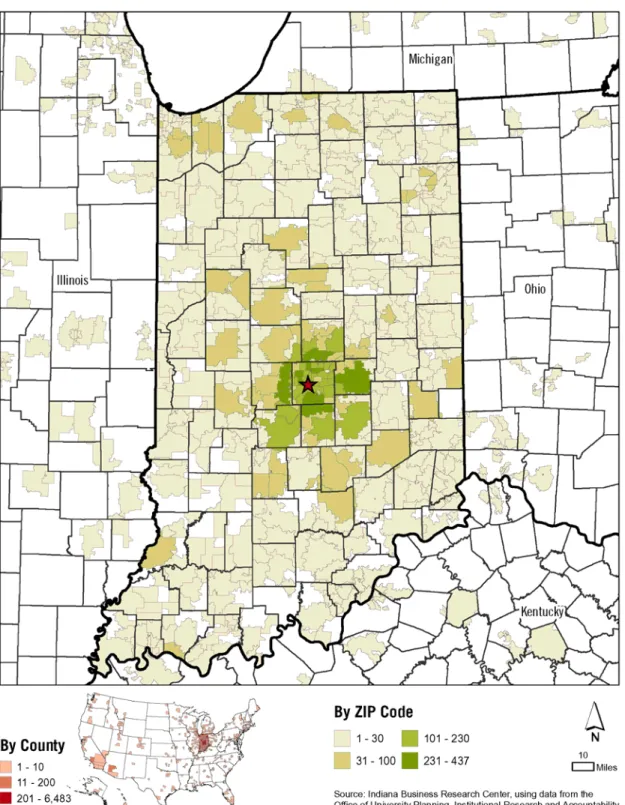
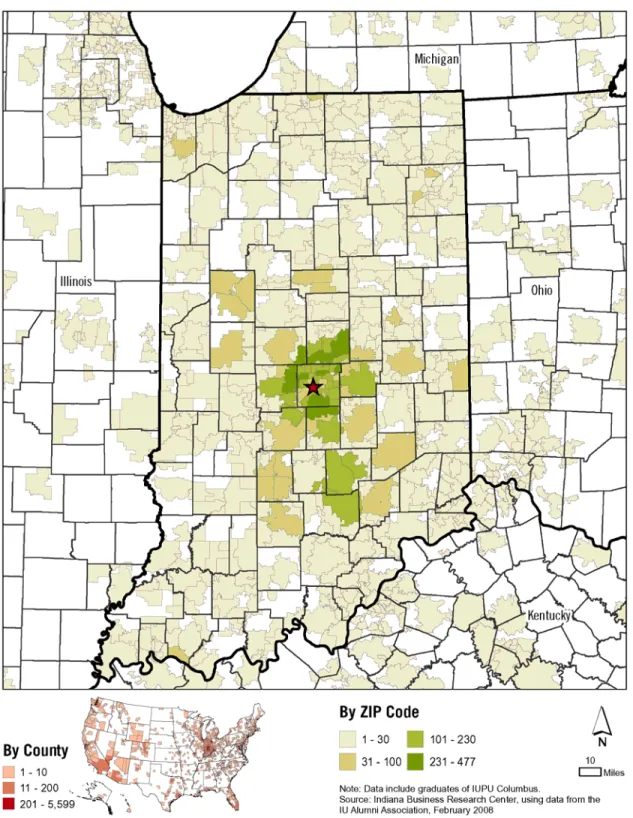
Settlement of Alumni
Contribution to Human Capital
Degrees Conferred
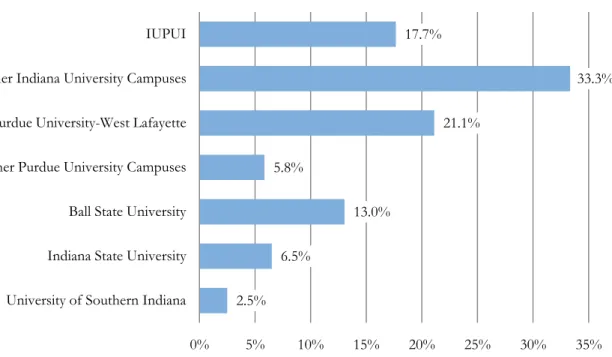
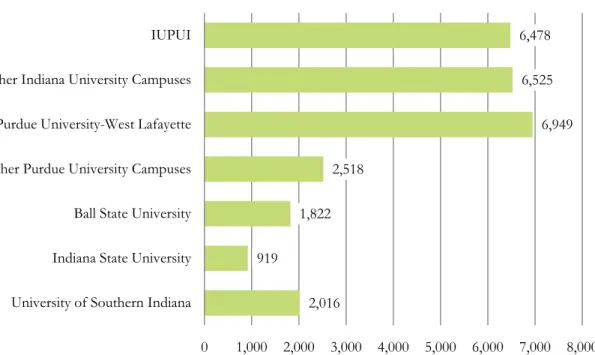
IUPUI, which led the state, accounted for more than half of all professional degrees (such as law and medical degrees) awarded by public universities in Indiana over the past five years. Because most of IU's doctoral programs are hosted by IU Bloomington, IUPUI has awarded relatively few (4 percent) of the doctoral degrees awarded by public schools in Indiana. Purdue University–West Lafayette led the way, awarding nearly half of those degrees.
The two other public schools that grant doctorates—Ball State University and Indiana State University—accounted for just over 5 percent each (see Figure 11). University of Southern Indiana Indiana State University Ball State University Other Purdue University campuses Purdue University-West Lafayette Other Indiana University campuses IUPUI.
Expected Lifetime Earnings
Female graduates who earn advanced degrees from IUPUI typically earn an estimated $1.8 million from work over their lifetime (see Table 6). Popular master's degrees in education and public administration and education management can earn graduates $1.2 million and $1.4 million, respectively. Graduates of a master's degree in business administration and management can earn even more: $1.8 million.
Doctoral students in the most popular allied health and social sciences may earn more than $1.7 million during their careers. Meanwhile, men who recently completed their baccalaureate degrees are expected to earn $1.7 million in lifetime earnings from their work (see Table 7). Other popular areas of study include arts, humanities and technology, and these fields offer graduates lifetime earnings of more than $1.5 million and $1.7 million, respectively.
Male graduates who earn advanced degrees at IUPUI typically earn over $2.5 million from employment over their lifetime (see Table 8). By far, the most popular master's degree field is business administration and management, and these graduates can earn $2.4 million over their careers. PhD graduates in the most popular field of biological, agricultural and food sciences earn a potential of $2.4 million over a lifetime.
Associate's Degree Graduates Additional lifetime earnings attributable to higher degree $494 $819 Note: Figures may not add up due to rounding.
Adding to Indiana’s Talent Pool
Source: IBRC, using data from the Indiana Commission on Higher Education and the National Graduate Survey. The value of earning a four-year college degree or higher is highlighted when comparing the difference between the estimated lifetime earnings of IUPUI graduates with a bachelor's degree and an associate degree with the earnings of associate degree graduates nationwide (see Table 9). Over a lifetime, female IUPUI graduates are expected to earn $494,000 more (or 50 percent) more than female associate degree graduates.
Male graduates are expected to make over $819,000 more (or 64 percent) more than associate degree graduates. Lifetime earnings are synthetic estimates based on median salaries for graduates by age, degree level, and field. Source: IBRC, using data from the Indiana Commission on Higher Education, the National Survey of College Graduates, and the US.
Combining the additional earnings of IUPUI bachelor and advanced degree graduates (compared to associate degree holders) results in approximately $2.7 billion in lifetime earnings increases associated with degrees awarded annually. Of course, it doesn't all stay in Indiana, and it can't properly be considered campus economic impact in the traditional sense. Still, the number conveys a sense of the increased value of the education that IUPUI graduates have received.
Indiana State University Ball State University Andere Purdue University-campussen Purdue University-West Lafayette Andere Indiana University-campussen IUPUI.
University Research and Business Development
Research Inputs
Seventy-two percent of IUPUI's sponsored research expenditures between 2006 and 2008 were supported by the federal government (see Figure 15). Given the important role played by the medical school at IUPUI, it is not surprising that the National Institutes of Health accounted for 89 percent of federally supported research during this period. Beyond federal contracts and grants, private foundations were the largest sponsors of research, accounting for 11 percent of spending.
Nonprofits represented 8 percent of research spending, followed by subcontracts from other colleges and universities at 5 percent. Source: IBRC, using the Indiana University Office of Research Administration's Executive Reporting Environment (ERE).
Research Outputs
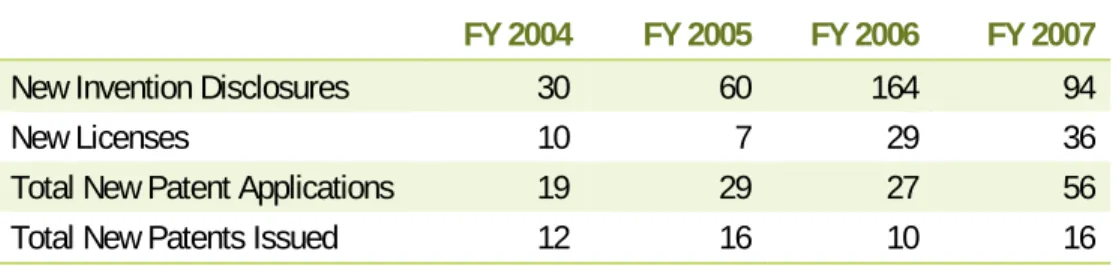
Total number of new patent applications Total number of new patents issued Source: Indiana University Research and Technology Corporation. Fiscal year 2007 saw a significant increase in the number of invention disclosures and patent applications, while licensing remained consistent with previous years. Since 2000, IU's licensed technologies have spawned 11 start-up companies employing approximately 160 people in the Indianapolis area.
As Table 12 illustrates, nine of these companies operate in Indiana's fast-growing life sciences industry. The other two startups, Angel Learning and BehNeem, are active in the information technology field. While the creation of startups is only a small byproduct of the true mission of university research, these companies provide tangible examples of the impact IU research has on the local economy.
Company Name (Fiscal Year Licensed) Field Employees Angel Learning (2000) Information Technology >100 Semafore Pharmaceuticals Inc. Company Name (Fiscal Year Licensed) Field Employees Indiana Nanotech, LLC (2007) Life Sciences 3 PharmacoPhotonics, LLCs (2007) Life Sciences BehNeem, LLC (2007) Information Technology 8 Apex Therapeutics, Inc. 2008) Life Sciences 6 Source: Indiana University Research and Technology Corporation.
Civic Contribution
Service-Learning 4
5 This study accounts for the possibility that not all services provided by volunteers would be funded if the organization or the organization's clients had to pay fair market value. The literature on volunteering suggests the use of a proportionality factor of 0.73 between the market price of the service and customer value. Source: IBRC, using reported hours of service provided by the IUPUI Center for Service and Learning and salary data from the US.
Volunteering
IUPUI students volunteered an average of 56.1 hours during the 2006-2007 academic year according to the IU Student Survey of full-time students. 6 Full-time students were analyzed and reported because they are more likely to reflect volunteering that would not have occurred "but for". the presence of the university. Extrapolating student survey results to the entire full-time student body, IUPUI student service totaled over 974,000 volunteer hours.
Source: IBRC, using volunteer data from the 2008 IU Student Survey, student-origin data from the Office of University Planning, Indiana University Institutional Research and Accountability, and salary data from US employees at IUPUI perform their volunteer role. After extrapolating the faculty and staff survey results to all full-time employees, IUPUI employees volunteered more than 247,000 hours. Taking a conservative approach, the IBRC analysis assumed that "but for" the presence of IUPUI, full professors would not have lived and worked in the region and, consequently, would not have volunteered in central Indiana.7 Although this is likely true for professional staff as well, the university's employee data did not allow separation of professional personnel from other personnel for whom "but for" applies.
The survey revealed that most staff are not as economically tied to the university as full professors.). As a result, a conservative estimate of the economic benefits only counts full-time faculty volunteer work and is worth nearly $630,000 to the region. The overall economic impact considers only the faculty and assumes a market price to customer value ratio of 0.73.
Source: IBRC, using volunteer data from the 2008 IU Faculty and Staff Survey, student-origin data from the Office of University Planning, Indiana University Institutional Research and Accountability, and US salary data.
Charitable Contributions
Total contribution from all students Contribution within the campus region $977,730 Note: The table lists full-time students. By multiplying this average by the number of full-time faculty and staff, IUPUI employees gave nearly $4.9 million.
Resources for the Community
In addition to students, faculty, and staff, 3,613 members of the public used the University Library and IUPUI's four branch libraries during the 2006-2007 academic year. IBRC analysts used an estimated value of $7.42 per book borrowed based on the methodology used in the report The Economic Impact of Libraries in Indiana.8 In addition, members of the public can freely use library audiovisual resources and computer services by requesting a free Network ID. Note: This list does not include civic engagement or arts and cultural resources discussed earlier in the report.
The Economic Footprint of the University
Principal Findings
According to the survey results, IUPUI students travel outside the campus region longer and spend more money per day in the process than those who come to Indianapolis to visit IUPUI students. These visitors and their economic injections are. listed in the "visitor expenditures attributable to IUPUI events" category. In other words, the "but for" argument in IUPUI's case is not an all-or-nothing calculation.
The economic impact, in the narrow sense, will only measure the effects of monetary injections and holdings. Many of the medical school's expenditures for goods, services, and reimbursements are recorded in IUPUI's accounts. These expenditures recorded in medical school accounts and their economic ripple effects are included in Table 19 under the categories "Faculty and Staff Compensation" and "University Purchases of Goods and Services."
These direct effects created an additional $335.6 million in economic ripple effects and 2,900 jobs in the IUPUI campus region. The combined expenditures of the IUSM - both the supplemental accounts and the medical school accounts - totaled 834.5 million in the 2006-2007 fiscal year. These combined expenditures created an additional $637.4 million in economic ripple effects and 5,500 jobs in the IUPUI campus region.
Furthermore, the credibility of the numbers in the AAMC study could not be verified because.

Conclusion