ANALYZING THE LATENESS FACTOR OF DELIVERY PROCESS IN PT CKB BY USING ROOT
CAUSE ANALYSIS METHOD
By
Mohamad Jody Pratama ID No. 004201200038
An Internship Report Submitted to the Faculty of Engineering President University in partial fulfillment of the requirements of Bachelor Degree in Engineering Major in Industrial Engineering
2015
ACADEMIC ADVISOR RECOMMENDATION LETTER
This internship report is prepared and submitted by Mohamad Jody Pratama in partial fulfillment of the requirements for the degree of Bachelor Degree in the Faculty of Engineering has been reviewed and found to have satisfied the requirements for a report to be examined.
Cikarang, Indonesia, November 17
th, 2015
Herwan Yusmira, B.Sc., MET., Mtech
COMPANY’S SUPERVISOR RECOMMENDATION LETTER
Mohamad Jody Pratama has performed and completed an internship in PT. Cipta Krida Bahari, in partial fulfillment of the requirements for the degree of Bachelor Degree in the Faculty of Engineering.
Jakarta, Indonesia, November 17
th, 2015
Erickson Manullang
INTERNSHIP REPORT IN PT. CIPTA KRIDA BAHARI, JAKARTA, INDONESIA
By
Mohamad Jody Pratama ID No. 004201200038
Approved by
Herwan Yusmira, B.Sc. MET, MTech. Herwan Yusmira, B.Sc. MET, MTech.
Academic Advisor Internship Coordinator
Ir. Andira, MT.
Program Head of Industrial Engineering
ABSTRACT
PT. Cipta Krida Bahari is a logistics company established in 1997 as a subsidiary of ABM Investama that provide integrated logistics service with expertise in total logistics solution. As a company that uses vehicle, especially trucks in everyday operation, it is essential to understand and apply the knowledge of fleet management in order to keep the service quality high. One aspect that must be examined at regular intervals is the delivery process is essential for gratification of the customer. Delivery process is very important because it involves the distribution department as the department which receives the order and makes the delivery plan and fleet department that provides the fleet for delivering to the order. This research was conducted from August 4th to November 17th 2015 and the data used was the RBI May 2014 - May 2015.Researchers used the Root Cause Analysis. The concept is to find out what the main causes of delays in the delivery and use of fish bone diagram and a questionnaire that is given to the driver to determine the cause of the delay. The conclusions is stated traffic jam is the most influential of the delay in delivery of goods. Additional hour to leave the delivery very well and has many advantages, one of them to reduce delays in the delivery of goods.
Keywords: Logistic Company, Distribution Management System, Fleet Management, Questionnaire, Fish Bone Diagram, Root Cause Analysis.
ACKNOWLEDGEMENT
Everything that related with the internship program and report are not fully my hand-earned. There were so many people who helped me completing the internship program and report. Hence, I want to express my gratitude and say thank you to:
1. Allah SWT, with all the blessing, mercy, and favor to me.
2. My family, especially Father, Mother, and my Brother for the loves, supports, prayers, and everything in my life.
3. Sesilia Suciatty Hidayat and Fikri Aswan.
4. Mr. Herwan Yusmira, B.Sc. MET, MTech as the Internship Advisor.
Thank you for the guidance, helps, lessons, knowledge, experiences, patience, and cares given to me.
5. Mr. Erickson Manullang as internship supervisors in PT. Cipta Krida Bahari Quality Assurance Division. Thank you for helping and guiding me during my internship program.
6. For all of my Engineering friends, especially for Industrial Engineering 2012, thanks for all the great moments we share together.
TABLE OF CONTENT
ACADEMIC ADVISOR...2
RECOMMENDATION LETTER...2
COMPANY’S SUPERVISOR...3
RECOMMENDATION LETTER...3
ABSTRACT...5
ACKNOWLEDGEMENT...6
LIST OF TABLE...9
LIST OF FIGURE...10
CHAPTER I INTRODUCTION...11
1.1 Background...11
1.2 Problem Statement...12
1.3 Objective...12
1.4 Scope...12
1.5 Assumption...12
1.6 Research Outline...13
CHAPTER II STUDY LITERATURE...15
2.1. Logistics...15
2.2. Distribution...16
2.3 Fleet Management...17
2.4 Root Cause Analysis (RCA)...18
2.5 Fishbone (Ishikawa diagrams)...18
2.6 Questionnaires...20
CHAPTER III RESEARCH METHODOLOGY...22
3.1. Research Flow Chart...22
3.1.1 Initial Observation...23
3.1.2. Problem Identification...23
3.1.3. Literature Study...23
3.1.4. Data Collection...23
3.1.5. Data Analysis...24
3.1.6. Conclusion and Recommendation...24
CHAPTER IV COMPANY PROFILE...25
CHAPTER V DATA COLLECTION AND ANALYSIS...39
5.1 Data Collection...39
5.2 Data Calculation and Analysis...44
CHAPTER VI CONCLUSIONS AND RECOMMENDATIONS...49
6.1. Conclusion...49
6.2. Recommendation...49
REFERENCES...50
APPENDIXES...51
LIST OF TABLE
Table 5.1 Number of lateness delivery process...39
Table 5.2 The percentage of number of lateness delivery process...40
Table 5.3 The result of questionnaire...42
Table 5.4 Significant factor that affect the lateness...44
Table 5.5 The ranking of factor...46
LIST OF FIGURE
Figure 2.1 Logistic Concept in general...15
Figure 3.1. Research Flow Chart...22
Figure 4.1 PT. Cipta Krida Bahari...30
Figure 4.2 PT. Cipta Krida Bahari Operation Jakarta...31
Figure 4.3 PT. Cipta Krida Bahari Fleet Operation Jasumei...32
Figure 4.4 PT. Cipta Krida Bahari Operation SUMUT...33
Figure 4.5 PT. Cipta Krida Bahari Operation SUM SEL...34
Figure 4.6 PT. Cipta Krida Bahari Operation Jakarta...35
Figure 5.1 Number of lateness delivery process...41
Figure 5.2 Fishbone diagram of lateness factor...41
Figure 5.3 Clustered bar diagram of lateness factor...45
Figure 5.4 Root cause analysis of traffic jam...47
Figure 5.5 Root cause analysis of low transportation cost...47
Figure 5.6 Root cause analysis of street condition...48
CHAPTER I INTRODUCTION
1.1 Background
PT Citra Krida Bahari as one of leading logistic company in Indonesia has many customers from different business. To accommodate the customer needs PT Citra Krida Bahari provides the delivery process of goods by using three types of transportation; sea, land and air. Sea transportation aims to deliver or ship the goods in large number but time is not the priority. Meanwhile, air transportation is focused to deliver the goods to the place where time is the priority of customer.
Land transportation is the most frequently used to deliver the goods of customer.
This is caused by most of the customers of the PT Citra Krida Bahari needs to send the goods to their client every day with the short distance. As the third party player, satisfaction of the client becomes the priority of the company to ensure the business can be run and sustained to the future. Besides that, to protect the business from the competitor PT Citra Krida Bahari must be efficient in delivering process.
On May 2015, there are sixty five lateness problems found from one customer’s delivery process. Every day, logistic company compete each other to provide on time delivery process to increase the customer satisfaction. If PT Citra Krida Bahari cannot reduce the number of lateness, the customer satisfaction will be decreased. Besides that, the penalty from agreement between the company and the customer can increase the cost and becomes the obstacle to protect the business in the future.
In the other hand, management of PT Citra Krida Bahari does not know about the factor that causes the lateness. As the result analyses have to be made to know the major problem of the lateness when delivering process.
1.2 Problem Statement
1. What is the factor that causes of lateness problem in delivery prosess of PT Citra Krida Bahari?
2. How to reduce the lateness problem in delivery process of PT Citra Krida Bahari?
1.3 Objective
1. To find out the factor that causes of lateness problem in delivery process of PT Citra Krida Bahari?
2. To know the way in reducing the lateness problem in delivery process of PT Citra Krida Bahari?
1.4 Scope
1. The research focus only customer Robert Bosch Indonesia
2. The research done from Augustus 4th 2015 – November 17th 2015
1.5 Assumption
Trucks used are the type of CDE, CDD and BU
The delivery area intercity
1.6 Research Outline
Chapter I Introduction
This chapter consists of the background of problem, problem statement, objectives of the research, scope and assumption of the research. It contains a brief explanation of what problem do the researcher wants to solve.
Chapter II Literature Study
The literature study contains a clear background and theoretical grounding of the problem. This chapter provides all theory used to solve the problem in this research and also giving supporting statement to support the conclusion of the research.
Chapter III Research Methodology
This chapter consist of the steps that will be perform by the researcher in order to know the problem in details, to get the data and how the problem solving will be implement.
Chapter IV Company Profile and Project
This chapter shows the description of company where the researcher worked during their internship program and about the activities performed during the internship period.
Chapter V Data Collection and Analysis
This chapter covers all of the data collected by doing observation and discussion. Fleet management system data from July 1st until August 9th will be put here. Researcher will give more detailed and clear analysis to enhance all researches based on literature study in chapter 2. Current fleet performance measurement and new performance
measurement will be shown here along with the calculation.
The comparison and some conclusions are also made here.
Chapter VI Conclusions and Recommendations
This chapter contains all summary results that have been performed by the researcher. Most of it concludes the analyses made previously in chapter five. The inputs for future research are also given.
CHAPTER II
STUDY LITERATURE
2.1. Logistics
Logistics is the management of the way resources are flowing from the point origin to the point of destination until it is obtained by the consignee/receiver. The resources managed in logistics is various, from material, document, equipment and even dangerous goods. The process itself also not only transportation, but include handling production, material handling, inventory warehousing and many more. This term originated in a military context, referring to how personnel acquire, transport and store supplies and equipment. In the business community, the term refers to how resources are acquired, transported and stored along the supply chain (http://www.investopedia.com/terms/l/logistics.asp). By having an efficient supply chain and proper logistical procedures, a company can cut costs and increase efficiency. On the other hand, a company with poor logistics will fail to meet customers' expectations and see its business suffer.
Logistics is very important to economy because it helps the circulation and movement of goods from one place to another place and assuring that the goods will be transported without any error. Its aim is to achieve maximum customer service level, ensure high product quality, to achieve minimum cost and be flexible in the constant market changes.
Figure 2.1 Logistic Concept in general
In the figure above, the logistic service usually performed by the logistics company, and it is include transporting goods as well as making logistic strategy
to reduce cost, warehousing, material handling, packaging and assuring that the goods is alright. Logistics company itself need to give the best service by having the best plan and strategy to keep the cost low and high quality service, and still manage to be profitable in the long run.
2.2. Distribution
Understanding Distribution, Function, Purpose, type, Duties & Examples Distribution is an activity whose function is very beneficial for the economic sector. Understanding Distribution by definition experts say that the understanding of the distribution is the distribution activities of goods and services made from producers to consumers so widespread. Distribution activities serve to bring producers and customers.
Distribution activity is a link between production and consumption activities.
Perpetrators distribution activities called distributor. In economic activity, the distribution is an activity that is in between to consumer. Goods which have been produced by the manufacturer in order to consumer require the existence of an agency called the distributor.
In reality not always produced goods manufacturers to get consumers must pass through a distributor. However, in modern economies distribution activities play an important role. More so with the rapid advancement of transportation technologies that result in international relations became closer. This resulted in increasingly important role due to the distribution of goods that are in the country but also the consumer who is outside the country
Distribution Goal, Types of Distribution and Task Distribution
The purpose of distribution activities whether committed by individuals or institutions are as follows.
Continuity of production activities can be guaranteed. Producers or companies to make goods to sell and profit from the sale are re-used for the production process where the advantage is obtained if there is a distributor.
Production of goods or services can be beneficial for consumers.
Production of goods or services would be meaningless if it remains in place producers. Goods or services can be beneficial for consumers if the existing distribution activities.
Consumer Goods and Services Obtained Easily. Not all goods or services can be purchased directly from the manufacturer of consumers where it requires the dealer or distribution from producers to consumers.
Based on the relationship between producers and consumers, the distribution system can be divided into, among others.
Direct Distribution: Understanding the distribution is the distribution or sale of goods made directly by producers to consumers is done without intermediaries.
Indirect Distribution: The definition of indirect distribution is the distribution or sale of goods from producers to consumers through intermediaries. Intermediaries involved in buying and selling activities are traders, agents, brokers, and commissioners
Task Distribution
Classifying the goods or sort them according to the type, size, and quality.
Introducing traded goods or services to consumers, such as the billboards or advertisements.
Buy goods and services from producers or traders greater 2.3 Fleet Management
Logistics Company need to give services to their customer all the time. The tool of transportation could be various, either they rent truck from vendor or used their own truck in doing pick-up and delivery. All activities that support land freight transport activity called Fleet Management Land Transport. This management includes all matters relating to the management of the vehicle involved in the movement of goods. It is the management of fleets that include small vehicles
used to transport people and small size package like motorcycles, colt diesel truck or any other car and many more. This management supports all activities of the transportation activities through the use of asset management.
Broadly speaking, land transport fleet management has duties and functions as follows:
• To take care and maintain the condition of all assets/vehicles in good condition to ensure the security and safety of goods that is transported and also the personnel who will use them.
• Creating effective systems and procedures for the utilization and the maintenance of all asset/vehicle. This includes maintenance schedules, driver’s management, management of fuel usage, systems to track the whereabouts of vehicles as well as security management, including the management of health and safety.
• Monitor and measure the cost, utilization and performance of the vehicle. The cost effectiveness of the fleet is not only to control vehicle operating costs, but also for maintenance and repair, supply of spare parts and also the replacement of the vehicle at the time of optimum use.
• To assure the number and composition of the fleet is fulfill the needs of the logistics company.
2.4 Root Cause Analysis (RCA)
Root cause analysis (RCA) is a process designed for use in investigating and categorizing the root causes of events with safety, health, environmental, quality, reliability and production impacts. The term “event” is used to genetically identify occurrences that produce or have the potential to produce these types of
consequences. Simply stated, RCA is a tool designed to help identify not only what and how an event occurred, but also why it happened. Only when
investigators are able to determine why an event or failure occurred will they be able to specify workable corrective measures that prevent future events of the type observed. Understanding why an event occurred is the key to developing effective recommendations. Usually RCA has got mixed with the accurate description of
what happened and how it happened. However, if the analysts stop there, it is not probed deeply enough to understand the reasons for the problem. Therefore, it is not known what to do to prevent it from occurring again. Identifying root causes is the key to preventing similar recurrences. An added benefit of an effective RCA is that, over time, the root causes identified across the population of occurrences can be used to target major opportunities for improvement. If, for example, a significant number of analyses point to procurement inadequacies, then resources can be focused on improvement of this management system. Trending of root causes allows development of systematic improvements and assessment of the impact of corrective programs. Effective RCA process serves the purpose to find the root causes of unwanted event and facilitating effective corrective actions to prevent recurrence.
It’s very hard to precisely define the term root cause. There is a substantial debate on the definition of the root cause, but these four cover all aspects of this
phenomenon (Rooney and Heuvel, 2004):
1. Root causes are specific underlying causes of observed problem;
2. Root causes are those that can reasonably be identified and therefore fixed;
3. Root causes are those states that depend on management and management has control to fix them;
4. Root causes are those for which effective recommendations for preventing recurrences can be generated and hence eliminate the effect that they produce.
2.5 Fishbone (Ishikawa diagrams)
Fishbone diagram or fishbone diagram is one method / tool in improving quality.
This diagram is also often called the Cause and Effect diagram or cause effect diagram. The inventor is a Japanese scientist in the 60s. Named Dr. Kaoru Ishikawa, a scientist born in 1915 in Tokyo Japan are also alumni of Chemical Engineering University of Tokyo. So is often called the Ishikawa diagram. The method initially used more for quality management using data verbal or
qualitative data. Dr. Ishikawa is also identified as the first to introduce the 7 tools or methods of quality control (7 tools). Namely fishbone diagram, control charts, run charts, histograms, scatter diagrams, Pareto charts, and flowchart.
It said Fishbone Diagram (Bone Fish) because it is shaped like fish bones snout head facing to the right. This diagram will show an impact or as a result of a problem, with various causes. Securities or written as a result of muzzle head.
While the fish bones filled in accordance with the causes of the problem approach.
Told Cause and Effect diagram because the diagram shows the relationship between cause and effect. Relating to statistical process control, cause-effect diagram is used to show the causal factors and quality characteristics caused by factors that cause it.
Fishbone Diagram / Cause and Effect / Ishikawa have created a brilliant idea that can help and enable any person or organization / company to solve the problem completely up to the roots. Custom to gather some people who have sufficient experience and expertise regarding the problems faced by companies all team members give their views and opinions in identifying all the reasons why these problems occur. Togetherness is indispensable here, as well as the freedom of giving opinions and views of each individual. So in fact the presence of this diagram is very useful for companies, not only can solve the problem to its roots but can hone argue for people - people who are in the team identifying problems in finding a company that causes the problem using a fishbone diagram.
The basic function diagram Fishbone / Cause and Effect / Ishikawa is to identify and organize the causes that might arise from a specific effect, and then separating the root cause. Often some people say "possible cause" and in most cases have to test whether the hypothesis is because for real and whether to enlarge or reduce they will provide the desired results
2.6 Questionnaires
The questionnaire is an information-gathering technique that allows analysts to study the attitudes, beliefs, behaviors, and characteristics of some of the main people in the organization that could be affected by the proposed system or the existing system. Using questionnaires, analysts attempt to measure what was
found in the interview, and also to determine how broad or limited the sentiment expressed in an interview,
The use of questionnaires appropriate when:
The respondent from each other.
Involving a number of people in the project system, and is useful when knowing what proportion of a particular group that approves or does not approve a special feature of the proposed system.
Conduct a study to know something and want to find the entire opinion before the project is given the system specific instructions.
Want to be sure that the problems in the existing system can be identified and discussed in a follow-up interview.
After explaining the study of literature, research methodology will be discussed.
The research methodology chapter consists of the steps that will be performed by the researcher in order to know the problem in details, to get the data and how the problem solving will be implementing.
CHAPTER III
RESEARCH METHODOLOGY
3.1. Research Flow Chart
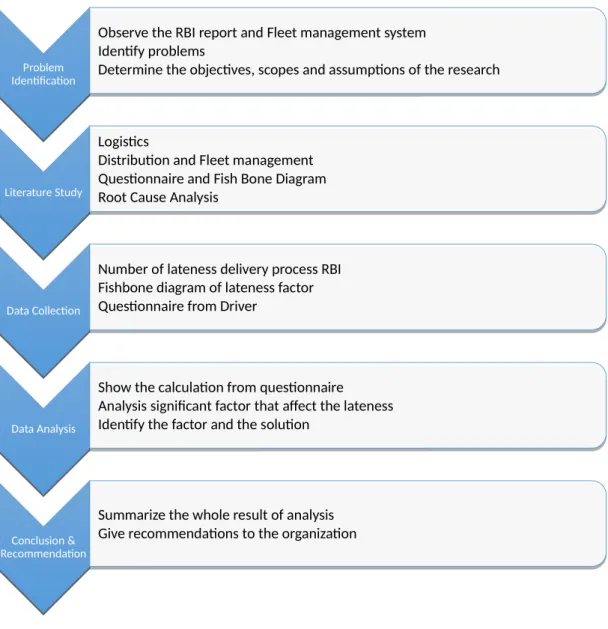
Flow chart below shows the steps needed in order to conduct the research.
Figure 3.1. Research Flow Chart
Problem Identification
Problem Identification
Observe the RBI report and Fleet management system Identify problems
Determine the objectives, scopes and assumptions of the research Observe the RBI report and Fleet management system
Identify problems
Determine the objectives, scopes and assumptions of the research
Literature Study Literature Study
Logistics
Distribution and Fleet management Questionnaire and Fish Bone Diagram Root Cause Analysis
Logistics
Distribution and Fleet management Questionnaire and Fish Bone Diagram Root Cause Analysis
Data Collection Data Collection
Number of lateness delivery process RBI Fishbone diagram of lateness factor Questionnaire from Driver
Number of lateness delivery process RBI Fishbone diagram of lateness factor Questionnaire from Driver
Data Analysis Data Analysis
Show the calculation from questionnaire Analysis significant factor that affect the lateness Identify the factor and the solution
Show the calculation from questionnaire Analysis significant factor that affect the lateness Identify the factor and the solution
Conclusion &
Recommendation Conclusion &
Recommendation
Summarize the whole result of analysis Give recommendations to the organization Summarize the whole result of analysis Give recommendations to the organization
3.1.1 Initial Observation
In the distribution division, observations were made with the understanding the daily reports RBI PT. Cipta Krida Bahari. The data contains information of each fleet used in a period and the delivery destination. Based on these data, a report was made to find the cause delivery delays. Performance will be reviewed each week with managers to ensure the quality of the service.
3.1.2. Problem Identification
From the observations that have been made, the problem is identified. It can be seen that the data inputted into the daily report RBI. In a daily report RBI there are some deliveries that are not in accordance with the delivery schedule specified. The next step after identifying the problem is to determine the scopes, limitations, and Assumptions for research purpose.
3.1.3. Literature Study
Literature study is conducted to obtain information required in this research as the theoretical mindset and foundation. The literature study in this research has been made based on the research topic, including; Root cause analysis
3.1.4. Data Collection
All of the data is gathered by collecting it on 4 August 2015 – 17 November 2015 through admin Robert Bosch Indonesia (RBI) well as approaching the operation and fleet division. The data collected include:
Daily report RBI from May 2014 – May 2015.
Questionnaires from the driver to determine the delay.
All related information about the shipment RBI as: cost, many goods and etc.
3.1.5. Data Analysis
After all the data are collected, the analysis is done. The first analysis is to show the main causes of delay in delivery of goods. The next step is to identify what improvements are needed for better results.
3.1.6. Conclusion and Recommendation
Conclusion fulfil the research objectives and to answer the problem statement. In this case, whether the main cause of delay in delivery of goods, Recommendation contains several suggestions are made in order to reduce the number of delays in the delivery of goods
CHAPTER IV COMPANY PROFILE
4.1.1 Company Overview
Established in 1997, PT. Cipta Krida Bahari (CKB Logistics) is a subsidiary of ABM Investama that provide integrated logistics service with expertise in total logistics solution. No matter how large and complex the logistics requirements are, CKB Logistics provides the best solutions for your company.
With the vision “to be the leading Indonesia integrated logistics company in energy related industry”, CKB Logistics’ total logistics solutions enable you to focus on your own company’s core competencies so you can focus on being a world-class competitor in your industry. Out customized logistics & supply chain management solutions will address your entire logistics requirements, including Integrated Logistics Services, Warehouse Management, Industrial Shipping and Coal Logistics. The Industrial Shipping and Coal Logistics were being managed under CKB Logistics’ subsidiaries, PT. Alfa Trans Raya (ATR) and PT. Baruna Dirga Dharma (BDD).
Given its expertise, CKB Logistics is focusing on oil & gas, mining, contractors, power systems, heavy equipment and other energy related industry that require
special handling and distribution to remote areas. We offer solutions that are beyond the abilities of our competitors. We relentlessly provide customized solutions for our customers despite geographical and infrastructure constraints.
4.1.2 Integrated Logistics Service
A complete range services that designed to fulfill customer’s specific requirements from A to Z. We enhance the logistics process in our customer’s supply chain management through consulting, identifying, managing risk, finding most preferred route and mode of transportation to be delivered to destination timely and safety.
Features of our integrated logistics services including:
Shipment arrangements with multi moda transportation from origin to destination. Our infrastructures including 1 air freighter with capacity 18 tons, more than 120 fleets nationwide with range of capacity 0.5 T-150 T, 7 vessels that comply with safety standard of oil & gas industry, 5 tug & barge with internationally accepted safety standard.
Customs clearance services with PPJK License in several major cities as following: Jakarta (Tanjung Priok Seaport & Cengkareng Airport), Medan, Palembang, Pekanbaru, Samarinda, Banjarmasin, Balikpapan, Batulicin, Surabaya, Makassar, Pontianak, Sorong, Denpasar, Batam, and Timika. For other cities, CKB Logistics has contractual relationship with PPJK License holders. We are expertise in handling green channel, red channel, temporary export/import; BC1.2, BC2.3 and Master list Facility Clearance.
4.1.3 Project Logistics Service
A testament to our commitment to excellence CKB Logistics has an extensive track record of successes in managing various large scale logistics project in a wide range of energy related industry. We also have the expertise to overcome geographical challenges and complex operating scenarios, giving us the ability to manage logistics operations in any environment with any limitations. We have extensive experience in transporting shipments to remote areas that has no regular shipment.
Features:
Advanced Planning: Feasibility studies, road surveys and vessel availability checks ensure perfect execution from start to finish. “We plan the work and work the plan.”
Regulatory Expertise: Our thorough understanding of each country’s law and regulations allows us to navigate any journey and overcome regulatory and customs hurdles smoothly and quick.
Charter of Air Freighter, Vessel, LCT, Tug, and Barge: Special project deliveries to every destinations/locations in nationwide and worldwide. Heavy Lift Shipments: From ship to shore, using cranes to multi-axle trailers, our technical experts have the technical knowledge and seasoned experience to manage complex movements across even the most inhospitable terrains in the regions.
4.1.4 Warehouse Management
CKB Logistics operates an efficient and cost effective warehousing and distribution system. We provide whether simple store area or custom designed facilities that will accommodate your requirement with fully integrated warehouse management system, including:
Flexibility on yard requirement (covered, open yard or shelter)
Bonded or non-bonded area (conditionals apply)
Warehouse management system support which advancing:
Warehouse facilities in strategic locations
Space optimization (racking and shelving)
Web-based visibility of inventory and reports
Currently, CKB Logistics manages more than 8 warehouse facilities in major locations for ease to reach and access. Those facilities are located at Jakarta, Kalimantan, East Indonesia, and Sumatera area.
4.1.5 Shore base Management
CKB Logistics provides integrated shore base management to manage the logistics requirements for oil & gas materials and equipment. Our branches that strategically located in major cities of oil & gas exploration and drilling activities will ensure your supplies are delivered right on time, whenever you need them.
CKB Logistics shore base management including:
Material Management
Rigs Movement
24/7 Site Management
Operating Dedicated Warehouse
International/Domestic Freight Forwarding Services
Our highly qualified people, who have experience and knowledge of the industry, will lead to peace of mind for our customer.
4.1.6 Industrial Shipping
Managed by CKB Logistics’ wholly owned subsidiary, PT. Alfa Trans Raya (ATR), we offer professional ship chartering to oil & gas and other energy related industry. Established in 2006, ATR’s activity has grown significantly from only owning vessel than became owning and managing vessel. ATR services will include providing the suitable vessel, including with qualified Crew, preventive maintenance system, insurance and voyage monitoring. All of our vessel is regularly checked and do the vetting process according to the industry standard.
ATR offers a fully integrated shipping management for its market segments, including Upstream Support Services, Downstream Support Services, Long Term Period Charter, Agency Services, and Ship Management Services.
4.1.7 Coal Logistics
Managed by CKB Logistics' subsidiary, Baruna Dirga Dharma (BDD), we provide coal logistics services to coal mining industry. BDD was incorporated to support the growth of the Group within the coal industry by providing efficient and flexible shipping services for a range of dry bulk and general cargoes, as well as providing transshipment facilities, agency services, and stevedoring.
To support BDD's vision: ”to provide the best quality coal logistics services to satisfy the customers in the region by applying efficient business processes and safety assurance” - BDD owns sets of tugs and barges and operates its own floating crane and dry bulk fleets. Tight adherence to internationally-accepted safety standards and a firm commitment to environmental protection is core.
Barging: Services for coal barging transportation, from loading port to discharging port or transshipment to Mother vessel at anchorage point. Its services is supported by brand new tugs and barges fleet size 300ft and highly qualified human resources with highly concern at HSE and Quality assurance.
Stevedoring: Services for coal stevedoring transshipment from barges to Mother Vessel at anchorage point at the sea with our own heavy equipment, grabs and floating cranes. We assure that the services provided are the best in area with high HSE and Quality Assurance standard.
Dry Bulk transportation: Dry bulk cargo transportation from and to all the ports in the world with young tonnage vessels to ensure the cargo is delivered safely and timely to the port of destination.
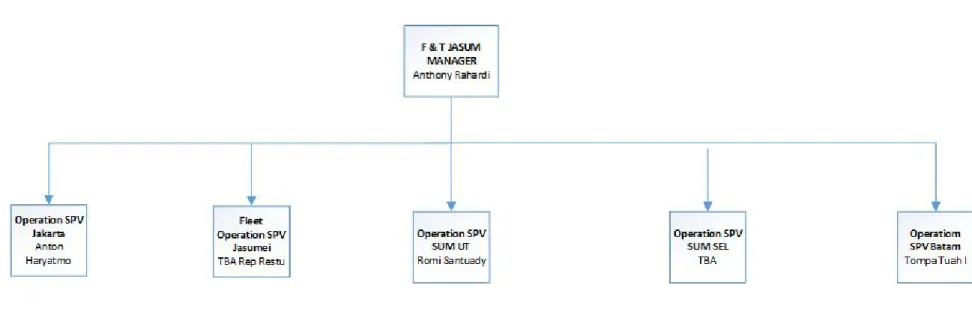
Distribution Organization Chart
Figure 4.1 PT. Cipta Krida Bahari
Figure 4.2 PT. Cipta Krida Bahari Operation Jakarta
Figure 4.3 PT. Cipta Krida Bahari Fleet Operation Jasumei
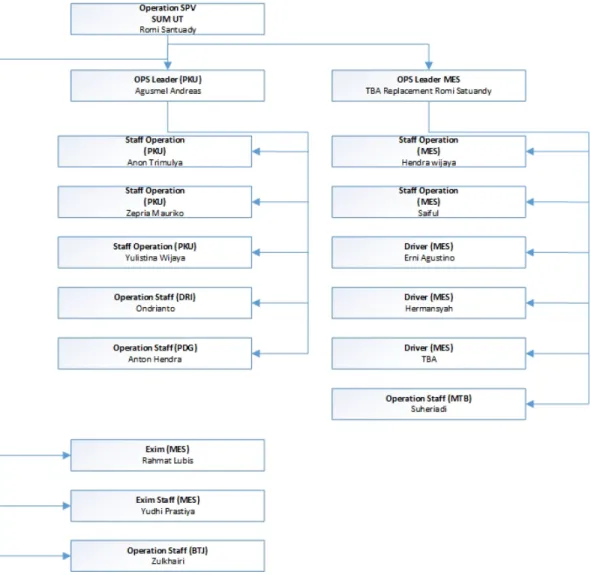
Figure 4.4 PT. Cipta Krida Bahari Operation SUMUT
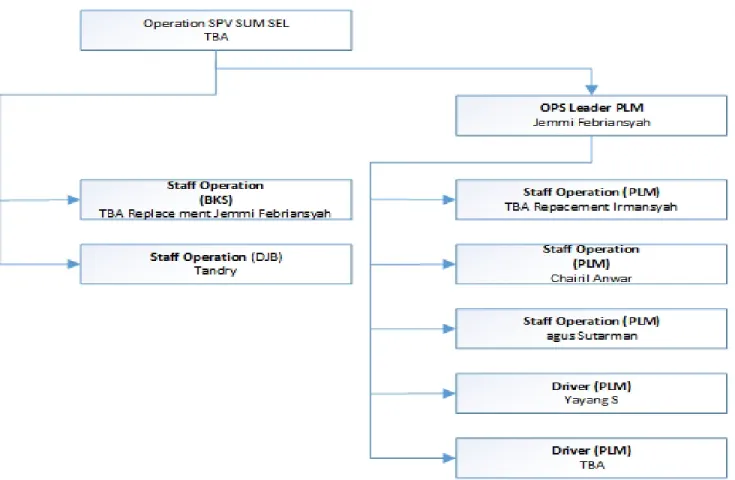
Figure 4.5 PT. Cipta Krida Bahari Operation SUM SEL
Figure 4.6 PT. Cipta Krida Bahari Operation Jakarta
4.1.8 Departments in Company Distribution Department
Distribution Department in PT Cipta Krida Bahari has three divisions, which are Land, Sea and Cross docking. The main functions of Distribution Department are:
Set the scheduled departure item
Creating a departure document
Estimating the items to their destination
Finance Department
Finance Department in PT. Cipta Krida Bahari has several divisions, which are Legal, Tax, Treasury, Budgeting, Account Payable, The main functions of Finance Department are:
Responsible for day to day transactional Responsible those enough funds are available to meet day to day payments
Responsible for advising and sourcing longer term financing
Working close to managers in order to prepare the organization’s budgets and forecasts
Providing information to assist managers in making key strategic decisions
Fleet Department
Fleet Department in PT. Cipta Krida Bahari has several decision, which are Fleet Dispatcher and Fleet staff, the main functions of Fleet Department are:
Managing car for Distribution department
Check the readiness of transportation (tire, license, etc.)
Making trip land for driver
Human Resources Department
Human Resources are primarily concerned with how people are managed within organizations. HR is typically responsible for a number of activities, including
recruitment, training and development, performance appraisal, and rewarding.
Human Resources Department in PT. Cipta Krida Bahari has several divisions, which are Employee Relation & Training, Recruitment, Administration, and Etc.
Procurement Department
The main functions of Procurement Department in PT Cipta Krida Bahari are to plan, organize, staff and direct control as of part of the procurement department of the company. This includes development, implementation, and oversight of plans, policies, and procedures related to procurement including vendor sourcing, selection and management, domestic network development and capital investment recommendation.
Quality, Health, Safety and Environment Department
The main functions of QHSE Department in PT Cipta Krida Bahari are:
Provides a safe working environment for all staff, students and visitors
Activities are undertaken in a safe manner, and
Complies with the requirements of the Health and Safety at Work Act and other relevant legislation
Warehouse department
The main functions of Warehouse Department in PT Cipta Krida Bahari are:
Receiving, Packing, Shipping
Identification and sorting
Dispatching to storage
Placing in storage
Storage
Retrieval from storage 4.1.9 Our Network Coverage
Head Office
Gedung TMT 1, 7th Floor Suite 701 Jl. Cilandak KKO No. 1, Jakarta 12560
Phone: (021) 2997 6777/88 Fax: (021) 2997 6797/98
Jakarta Super Hub
Jl. Raya Cakung Cilincing Pal II Blok A1
Kelurahan Sukapura, Kecamatan Cilincing, Jakarta Utara 14140 Phone: (021) 2945 4545
Fax: (021) 2945 4546/47/48
TNS Warehouse
Komplek Pergudangan Soewarna Unit E9
Soekarno Hatta International Airport, Jakarta 19110 Phone: (021) 5591 1405
Fax: (021) 5591 1406
CHAPTER V
DATA COLLECTION AND ANALYSIS
5.1 Data Collection
The data collection is only focused on land transportation from one customer which is Robert Bosch Indonesia.
Number of lateness delivery process
Month Number of order
per month
Number of lateness problem
May 2014 440 15
June 2014 510 20
July 2014 510 0
August 2014 475 7
September 2014 480 3
October 2014 825 35
November 2014 490 0
December 2014 530 12
January 2015 325 0
February 2015 315 5
March 2015 253 2
April 2015 425 0
May 2015 592 70
Total 6170 169
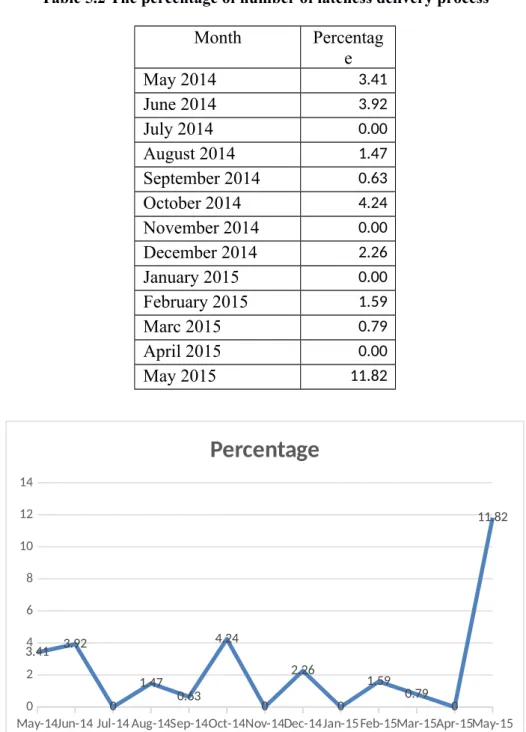
The data is taken from May 2014 until May 2015 from the planning department only from one customer which is Robert Bosch Indonesia. From the table there is 169 lateness of total order 6170; means 169 order cannot be delivered by the company on time. As the result the company should pay much money for the penalty, and it will reduce the profit and the worst case is the trust. On May 2014 the number of order that cannot be sent on time is 15, but on the other hand on May 2015 the number of lateness is increase significantly into 70. It indicates that
there is problem inside the delivery process of PT Citra Krida Bahari. In order to make it simple, the number of lateness is converted to percent and after that the graph is made to graphically the fluctuation of lateness for one year.
Table 5.2 The percentage of number of lateness delivery process
Month Percentag
e
May 2014 3.41
June 2014 3.92
July 2014 0.00
August 2014 1.47
September 2014 0.63
October 2014 4.24
November 2014 0.00
December 2014 2.26
January 2015 0.00
February 2015 1.59
Marc 2015 0.79
April 2015 0.00
May 2015 11.82
May-14Jun-14 Jul-14 Aug-14Sep-14Oct-14Nov-14Dec-14Jan-15 Feb-15Mar-15Apr-15May-15 0
2 4 6 8 10 12 14
3.41 3.92
0 1.47
0.63 4.24
0 2.26
0
1.59 0.79 0
11.82
Percentage
Figure 5.1 Number of lateness delivery process
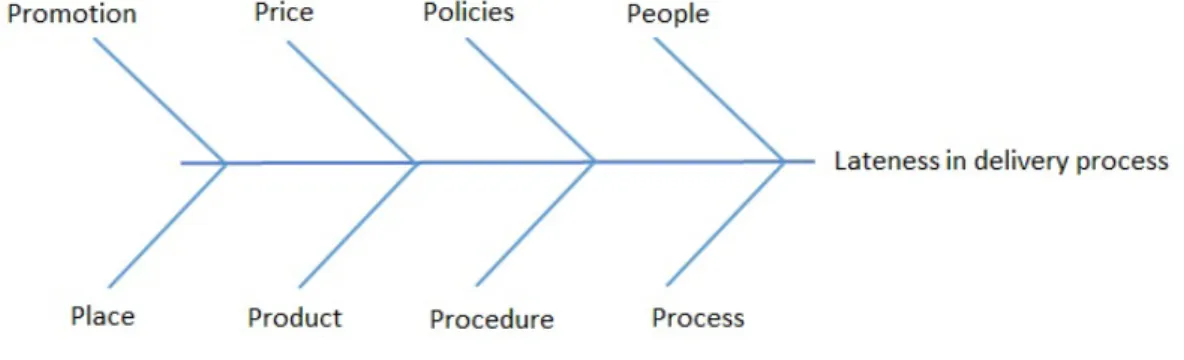
After knowing the problem, the fishbone diagram is made to categorize the factor that influences the lateness problem in PT Citra Krida Bahari. Based on the study
literature, the fishbone diagram is used to describe the problem that happened in PT Citra Krida Bahari. The head becomes the problem that will be solved, while the bone becomes the causes that made the problem. Since PT Citra Krida Bahari is one of the company that focus on logistic means on service industry that approaching fishbone using 8 P’s; people, process, policies, procedures, price, promotion, place, and product. But in order to ease the calculation and analysing, only the significant factor that will be used in the questionnaire. The figure 4.2 shows the factor that affects the delivery order.
Figure 5.2 Fishbone diagram of lateness factor
The detail of fishbone diagram above is;
People : 1. the driver does not have enough training from the company
Policies : 1. Lack of information about the departure
Price : 1. the transportation cost does not enough in delivery process
Promotion : does not affect the lateness
Process : 1. the cycle time in cross docking longer
2. Delivery process got the problem due to the traffic jam 3. Delivery process got the problem due to the poor condition of the street
Procedure : does not affect the lateness
Product : 1. the size of product is various
2. The size of pallet is various
Place : does not affect the lateness
The detail of fishbone is inputted to the questionnaire before it spreads to the people who work in the PT Citra Krida Bahari. Questionnaire will be used to calculation and analysing. There is only 30 samples that will be used for calculation and analysing since the number of people in PT Citra Krida Bahari is limited because the major of people is driver that are not always available in the company.
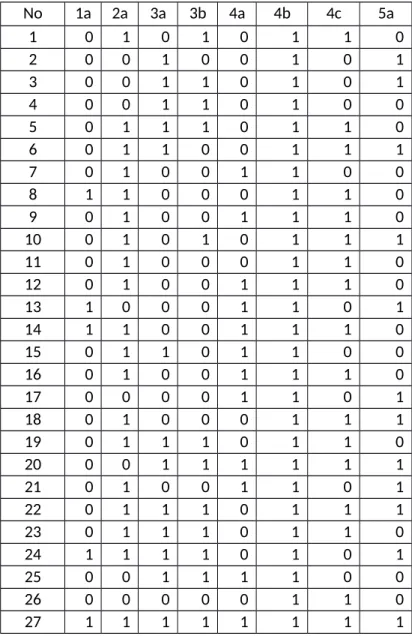
Table 5.3 the result of questionnaire
No 1a 2a 3a 3b 4a 4b 4c 5a
1 0 1 0 1 0 1 1 0
2 0 0 1 0 0 1 0 1
3 0 0 1 1 0 1 0 1
4 0 0 1 1 0 1 0 0
5 0 1 1 1 0 1 1 0
6 0 1 1 0 0 1 1 1
7 0 1 0 0 1 1 0 0
8 1 1 0 0 0 1 1 0
9 0 1 0 0 1 1 1 0
10 0 1 0 1 0 1 1 1
11 0 1 0 0 0 1 1 0
12 0 1 0 0 1 1 1 0
13 1 0 0 0 1 1 0 1
14 1 1 0 0 1 1 1 0
15 0 1 1 0 1 1 0 0
16 0 1 0 0 1 1 1 0
17 0 0 0 0 1 1 0 1
18 0 1 0 0 0 1 1 1
19 0 1 1 1 0 1 1 0
20 0 0 1 1 1 1 1 1
21 0 1 0 0 1 1 0 1
22 0 1 1 1 0 1 1 1
23 0 1 1 1 0 1 1 0
24 1 1 1 1 0 1 0 1
25 0 0 1 1 1 1 0 0
26 0 0 0 0 0 1 1 0
27 1 1 1 1 1 1 1 1
28 1 1 1 1 1 1 1 1
29 0 0 0 0 0 1 1 1
30 1 0 1 1 1 1 0 1
Yes (1) 7 20 15 14 14 30 19 15
No (0) 23 10 15 16 16 0 11 15
The table above are the result of questionnaire from 30 respondent of PT Citra Krida Bahari. The code 1a means the statement for the driver does not have enough training from the company. Code 2a means the transportation cost does not enough in delivery process (low transportation cost). Code 3a means the size of pallet is various. Code 3b means the size of product is various. Code 4a means the cycle time in cross docking longer. Code 4b means delivery process got the problem due to the traffic jam. Code 4c means delivery process got the problem due to the poor condition of the street. Code 5a means Lack of information about the departure. Respondent should answer yes or no in the statement by giving cross mark in the questionnaire. In this table 1 means yes and 0 means no.
5.2 Data Calculation and Analysis
Table 5.4 Significant factor that affect the lateness N
o Lateness Factor Answer Answer (%)
Info.
Yes No Yes No
1 Lack of training 7 23 23.33% 76.67% No problem
2 Low transportation cost 20 10 66.67% 33.33% Problem
3 Size of pallet is various 15 15 50.00% 50.00% No Problem 4 Size of product is
various
14 16 46.67% 53.33% No Problem
5 Cycle time of cross docking is longer
14 16 46.67% 53.33% No Problem
6 Traffic Jam 30 0 100.00% 0.00% Problem
7 Poor condition of the street
19 11 63.33% 36.67% Problem
8 Lack of information 15 15 50.00% 50.00% No Problem
Information:
% Yes : Respondent choose “yes” / total respondent x 100%
% No : Respondent choose “no” / total respondent x 100%
Problem : If the % yes < % no No problem : If the % yes < % no
To find out the factor that categorized as problem or no problem, the researcher uses the equation to calculate mean:
Mean=Σ xi n
Mean=23.33 %+66.67 %+50 %+46.67 %+46.67 %+50 %+100 %+63.33 % 8
Mean=446.67 8
Mean=55.83 %
If % yes < 55.83% it means there is no problem, but if % yes > 55.83% it means there is problem.
Lack of training Low transportation cost Size of pallet is various Size of product is various Longer cycle time Lack of information Traffic Jam Poor condition of street
0.00% 20.00% 40.00% 60.00% 80.00% 100.00% 120.00%
Chart Title
Problem No Problem
Figure 5.3 Clustered bar diagram of lateness factor
On the graph above it shows there are three problems founded from eight factors that collected from questionnaire. Researcher calculated the factor based on the average of respondent that answer yes and no in the questionnaire. If the frequency of answer “Yes” greater than “no” it means that factor has problem.
Traffic jam is the most influence factor that causes the lateness of delivering process. It is shown from the result of questionnaire, 100% answer yes the traffic jam causes lateness. Low transportation cost and poor condition street are also contributed to the lateness problem of delivery process. The values are 66.67 % and 63.33% respectively.
On the other hand, the percentage of respondent that answer yes and no lack of information about the delivery’s destination is balance. Because the percentage of respondent balance, it does not need significant attention.
Table 5.5 the ranking of factor N
o
Lateness factor Yes No Info Ranking
1 Lack of training 23.33% 76.67% No
problem 2 Low transportation
cost
66.67% 33.33% Problem 2
3 Size of pallet is various
50.00% 50.00% No
Problem 4 Size of product is
various
46.67% 53.33% No
Problem 5 Cycle time of cross
docking is longer
46.67% 53.33% No
Problem
6 Lack of information 50.00% 50.00% No
Problem
7 Traffic Jam 100.00% 0.00% Problem 1
8 Poor condition of 63.33% 36.67% Problem 3
the street
Based on the table above, there are three factors that influence the delivery process to the lateness. They are traffic jam, low transportation cost and poor condition of the street. Every factor will be analysed deeply to know the root causes of the problem. The root causes analysis is used to identify the factor and make a solution to reduce the lateness problem in PT Citra Krida Bahari.
1. Traffic jam
Figure 5.4 Root cause analysis of traffic jam
Traffic jam is the most influential factor causing congestion in because of road conditions that cannot accommodate the number of vehicles. Then there are accumulations of vehicles on the road. Hour of rush hour is the time to go to work 6:00 am- 9:00 am and when I go home 16:00 pm - 18:00 pm. solution to this problem is to dispatch a fleet of delivery earlier than rush hour 1 hour or 2 hours before rush hour. If it is still affected by rush hour traffic jams at least not too exposed and delivery of goods is not too late.
2. Low transportation cost
Figure 5.5 Root cause analysis of low transportation cost
The second most influential of the delay in delivery is the low transportation cost due to an error in the manufacture SIJK (vehicle road license) will be undertaken by the fleet department; thereby causing the vehicle cannot get to the destination and wait for the additional money transferred by the fleet department staff. Thus requiring additional time to wait money and cause delays in delivery of goods.
Rush Hour
Traffic Jam
Lateness in delivery
process
Wrong SIJK
Traffic Jam
Lateness in delivery
process
Solution to this problem is fleet and distribution staff must work together to prevent a miss communication and check back SIJK (license to drive the vehicle) before giving money to the driver in order to comply with the required driver.
3. Poor condition of the street
Figure 5.6 Root cause analysis of street condition
The third most influential of the delay in delivery is poor road access in because there are a lot of things such as road repairs, the road is bumpy, flooding, road is narrow and others. Besides it is the fault of the drivers who deliberately avoid road traffic jams and pass a new road or had never been crossed but make longer travel time. The solution is if you already know the roads impassable in poor condition and estimates set out to place the delivery is extended so as not to be late to the place of delivery of goods.
New road Traffic Jam
Lateness in delivery
process
CHAPTER VI
CONCLUSIONS AND RECOMMENDATIONS
6.1. Conclusion
Based on the internship report made on "Analyzing Lateness the factor of delivery process in PT. CKB using root cause analysis method” it can be concluded:
1. By using root cause analysis method, PT. Cipta Krida Bahari can solve the delay problem by identifying the root cause of the error or problem.
2. Every logistics companies need to manage the delivery time of goods well.
3. One way to manage the delivery of good order and reduce the risk of late is to increase the delivery time from the time estimate
4. By using root cause analysis method, PT. Cipta Krida can identify the cause of delay so that it can be a solution to reduce the problem of delay.
6.2. Recommendation
Recommendations for future research are to analyze the more the causes of delay in delivery of goods by PT. Cipta Krida Bahari by using root cause analysis or to develop problems and solutions that have been written in this report to determine the cause of the delay others.
In addition, there are some recommendations for PT. Cipta Krida Bahari on delivery:
1. Adding the delivery time from the time estimate.
2. Develop customer satisfaction seriously to reduce the risk of delay in delivery of goods.
REFERENCES
http://www.investopedia.com/terms/l/logistics.asp
EFFECTIVE ROOT CAUSE ANALYSIS AND CORRECTIVE ACTION PROCESS Branislav TOMIĆ1, Vesna SPASOJEVIĆ BRKIĆ2
http://www.investopedia.com/terms/i/ishikawa-diagram.asp
APPENDIXES
May 2014
PROFORMANCE LEADTIME DELIVERY
HIT On Time 440 97%
On Proses 0 0%
FAIL 15 3%
TOTAL 455 100%
June 2014
PROFORMANCE LEADTIME DELIVERY
HIT On Time 510 96%
On Proses 0 0%
FAIL 20 4%
TOTAL 530 100%
July 2014
PROFORMANCE LEADTIME DELIVERY
HIT On Time 510 100%
On Proses 0 0%
FAIL 0 0%
TOTAL 510 100%
August 2014
PROFORMANCE LEADTIME DELIVERY
HIT On Time 475 99%
On Proses 0 0%
FAIL 7 1%
TOTAL 482 100%
September 2014
PROFORMANCE LEADTIME DELIVERY
HIT On Time 480 99%
On Proses 0 0%
FAIL 3 1%
TOTAL 483 100%
October 2014
PROFORMANCE LEADTIME DELIVERY
HIT On Time 825 96%
On Proses 0 0%
FAIL 35 4%
TOTAL 860 100%
November 2014
PROFORMANCE LEADTIME DELIVERY
HIT On Time 490 100%
On Proses 0 0%
FAIL 0 0%
TOTAL 490 100%
December 2014
PROFORMANCE LEADTIME DELIVERY
HIT On Time 530 98%
On Proses 0 0%
FAIL 12 2%
TOTAL 542 100%
January 2015
PROFORMANCE LEADTIME DELIVERY
HIT On Time 325 100%
On Proses 0 0%
FAIL 0 0%
TOTAL 325 100%
February 2015
PROFORMANCE LEADTIME DELIVERY
HIT On Time 315 98%
On Proses 0 0%
FAIL 5 2%
TOTAL 320 100%
March 2015
PROFORMANCE LEADTIME DELIVERY
HIT On Time 253 99%
On Proses 0 0%
FAIL 2 1%
TOTAL 255 100%
April 2015
PROFORMANCE LEADTIME DELIVERY
HIT On Time 425 100%
On Proses 0 0%
FAIL 0 0%
TOTAL 425 100%
May 2015
PROFORMANCE LEADTIME DELIVERY
HIT On Time 522 88%
On Proses 0 0%
FAIL 70 12%
TOTAL 592 100%