However, soil decomposition rates are sensitive to indirect effects of elevated CO2, including changes in pH and organic acid concentration. For effective comparison of weathering rates and identification of factors affecting them, changes in the surface must be taken into account in reporting dissolution rates.
List of Tables
INTRODUCTION
- Motivation
- Research Objectives and Scope
- References
Investigating the factors that influence the weathering of these soils can provide information on the validity of the hypothesized direct effect of CO2 included in some models. To complement the fieldwork, laboratory studies were conducted to compare the dissolution rates of soils from different locations and to independently investigate the effects of the different factors.
BACKGROUND
Geochemical Interactions Involved in Soil Mineral Weathering
- Introduction to Mineral Weathering
- The Surface Chemistry of Mineral Weathering
- Factors Affecting Mineral Weathering Rates
- Rate Dependence on pH
- The Role of Low-Molecular-Weight (LMW) Organic Acids
- Mineral Weathering and CO 2
Four sequential steps are involved in chemical weathering: (1) transport of reactive species (e.g. H+, OH-, ligands, etc.) from the bulk solution to the mineral surface, (2) interaction of these reactive species with the surface metal centers (which destabilize the bonds between the surface metal centers and the crystal lattice), (3) detachment of the metal ion from the surface, and (4) transport of the reaction products (ie, the metal ions) from the surface to the bulk solution (Stumm, 1987). This relationship only holds if the solution is undersaturated (ie, the system is far from equilibrium) so that the net dissolution rate, Rdissnet, is equal to Rdiss.
Quantifying Soil Mineral Weathering Rates .1 Introduction to Different Approaches
- Field versus Laboratory Derived Rates
- Need for Dissolution Experiments with Whole Soils
Therefore, to compare weathering rates calculated from field-based and laboratory-based methods, the surface area of minerals exposed to weathering in the field must be estimated. An additional approach to bridging the gap between laboratory and field weathering rates involves conducting laboratory dissolution experiments on intact soils rather than pure minerals.
The Field Site
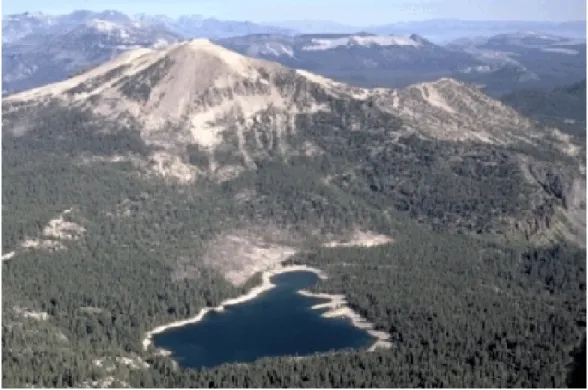
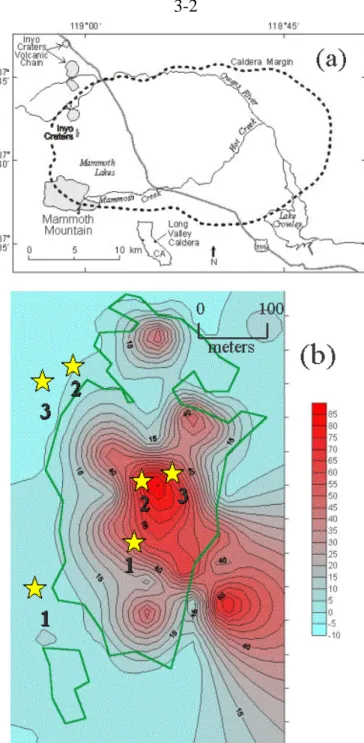
- Mammoth Mountain, California
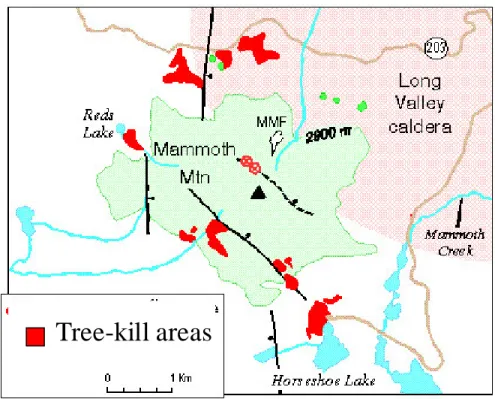
- Horseshoe Lake Tree-Kill Area
- Volcanic Ash Soils
- Previous Research at the Site
The δ13C values of CO2 in soil gases outside the Horseshoe Lake tree kill area are within the range expected in a typical forest soil (-19 to -25 Å). The snowpack in winter is usually larger than 3 m, but the ground remains unfrozen due to the insulating effect of the snowpack (McGee and Gerlach, 1998), and water easily infiltrates into the ground (Seney and Gallegos, 1995).
Influence of pH and competitive adsorption on the kinetics of ligand-promoted dissolution of alumina. An experimental investigation of the dissolution rates of basaltic glass as a function of the aqueous Al, Si and oxalic acid concentration at 25 oC and pH = 3 and 11.
COMPARATIVE CHARACTERIZATION OF VOLCANIC ASH SOILS EXPOSED TO DECADE-LONG ELEVATED CARBON
CALIFORNIA*
Introduction
The volcanic ash soils found on Mammoth Mountain have particularly low resistance to chemical weathering compared to other soils due to the predominance of volcanic glass and other noncrystalline phases (Dahlgren et al., 1993). This paper presents a comparison of soil chemistry and mineralogy and LMW organic acid composition in soils from high CO2 and an adjacent control area.
Background .1 The Field Site
- Soil Mineral Weathering
Metastable solid phases of short-range order, including allophane, imogolite, and ferrihydrite, are often formed as weathering products of volcanic glasses due to their rapid weathering rates (Dahlgren et al., 1993). Because of the relatively rapid timescale for weathering of volcanic ash soils (Dahlgren et al., 1993), Mammoth Mountain soils can respond quickly to changes in weather conditions.
Methods .1 Sampling
- Chemical Analyses
- Mineralogical Analyses
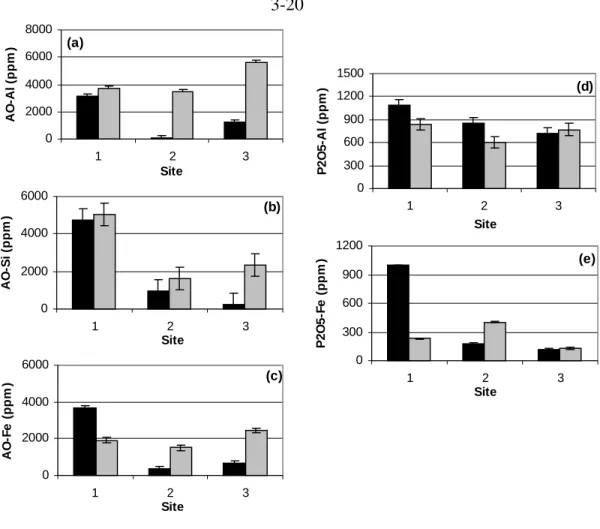
In the dithionite-citrate digestion procedure, 0.5 g of soil sample was mixed with 25 ml of 0.68 M sodium citrate, 0.4 g of dithionite powder. For acid-ammonium-oxalate digestion, 0.25 g of soil sample was mixed vigorously with 0.2 M ammonium oxalate adjusted to pH 3 in the dark for 2 h (McKeague and Day, 1966).
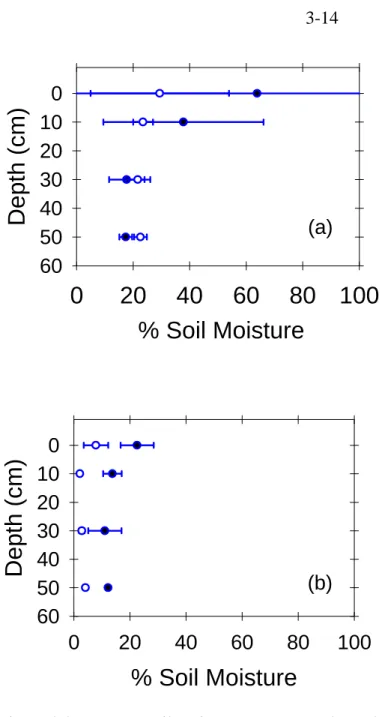
- Percent soil moisture
- Dithionite-citrate extraction
- Acid oxalate extraction
- Pyrophosphate extraction
- Interpretation and critique of results of selective extractions
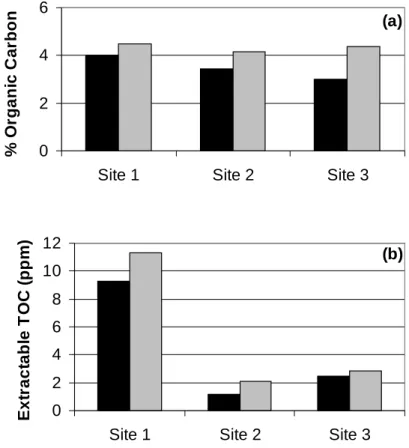
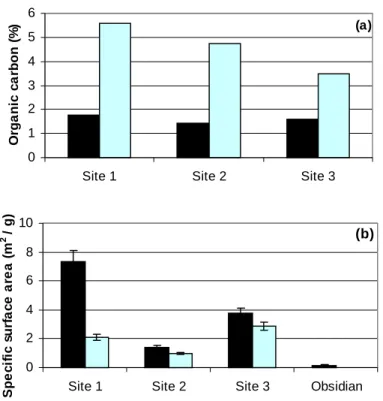
- Organic Analysis .1 Total organic carbon
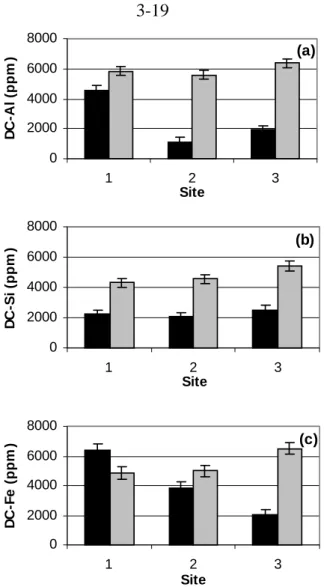
Black = High CO2 soil Gray = control soil digestion methods, no clear trend is observed comparing high CO2 and control soils. No clear or significant trends were observed in the comparison of organic acid concentrations in high CO2 and control soils.
Conclusions
An alternative explanation for the differences in the intensity of weathering of soils with high CO2 content compared to the control soil could be temperature, as a temperature dependence of weathering of volcanic ash soils has been found (Dahlgren et al., 1993). Although LMW organic acid concentrations measured in high CO2 soils and control soils did not show consistent trends, spatial and seasonal variation in organic acid concentrations should be examined to determine whether organic acids may exist.
Influence of solution saturation state on the kinetics of ligand-controlled dissolution of oxide phases. Annual cycle of magmatic CO2 in a tree-killing soil at Mammoth Mountain, California: Implications for soil acidification.
LABORATORY DETERMINATION OF DISSOLUTION RATES OF MAMMOTH MOUNTAIN SOILS
Introduction
Although several researchers have conducted laboratory experiments on whole soils (Asolekar et al., 1991; Etringer, 1989; Schnoor, 1990), to my knowledge no such studies have been conducted with volcanic ash soils. These experiments tested the hypothesis that soil exposed to more intensive weathering conditions in the field would exhibit slower weathering than unexposed soil in laboratory dissolution experiments.
Materials and Methods
- The Volcanic Soils of Mammoth Mountain
- Experimental Procedure
Both the obsidian and tuff material in the tephra are largely noncrystalline because rapid cooling of the lava inhibits crystal growth (Busch, 1997). The washed and fractionated soil was dried overnight at 60oC before being used in the experiments.
Results and Discussion
- Determination of Weathering Rates
- Comparison of Weathering Rates
- Individual Contributors to Overall Dissolution Rates
- Evidence Against Formation of Secondary Phases
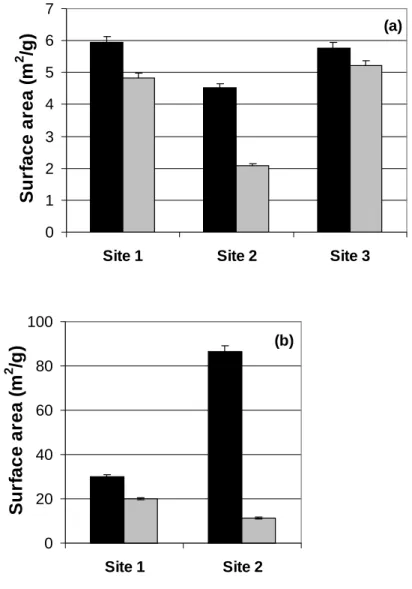
- A Decrease in Specific Surface Area Observed
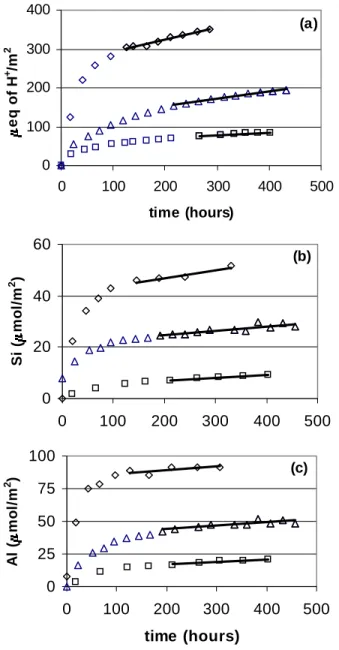
The H+ data and the sum of the µ equivalents of measured cations are similar in magnitude when dissolving soil from control site 1 (Fig. 4.3c). In the latter case, the specific surface area decreased by 61–94%, a range similar to that of the decreases observed in these soil dissolution experiments.
Conclusions
The influence of percolation rate on the weathering rates of silicates in an E horizon of an Umbrian Albaqualf. Influence of temperature and mineral surface characteristics on feldspar weathering rates in natural and artificial systems: A first approach.
OXALATE
Introduction
Laboratory studies of dissolution of isolated pure minerals or synthesized solid phases are the primary basis of the current understanding of weathering kinetics. This chapter reports on laboratory dissolution experiments designed to assess the effects of each of these three factors, pH, CO2, and LMW organic acids, on the dissolution rate of Mammoth Mountain's volcanic ash beds.
Materials and Methods
- pH-stat Batch Experiments
- Flow-through Experiments
- Oxalate Adsorption Methods
However, in dissolution experiments of soils with their complex mixture of different Si and Al phases, the release of Al provides additional kinetic information on the dissolution of Al phases. Although the control experiments were not performed under the specific conditions of the oxalate adsorption studies, the assumption that these filters did not affect the subsequent Al measurement is made based on the similarity of the conditions of the control experiments discussed in Chapter 4.
Results and Discussion
- Decrease in specific surface area
- Lack of dependence on CO 2
- Dependence on oxalate
- Comparison of Rates in Batch and Flow-through Reactors
- Implications for Weathering of Mammoth Mountain Soils
In the absence of reliable postdissolution soil measurements from flow reactors, postdissolution specific surface area values from batch reactors (taken at pH 4.0) were used to calculate dissolution rates for flow experiments. The dissolution rates of the Mammoth Mountain soil derived from the H+ and Si data increase with decreasing pH over the pH range from 2.78 to 4.0, although the rates derived from the Al release data do not show a pH dependence (Fig 5.2 ).
Conclusions
More detailed investigation of the microbial populations and spatial and temporal distributions of the concentrations of LMW organic acids in the Mammoth Mountain soils are needed to understand how LMW organic acids affect the mineral weathering regimes of these soils. Further research examining ligand-promoted dissolution of Mammoth Mountain soils in detail and assessing the combined effects of pH and organic acids would improve understanding of soil dissolution at the Mammoth site as well as the more general effects of factors on dissolution rates.
An experimental study of the dissolution and precipitation kinetics of kaolinite as a function of chemical affinity and solution composition at 150oC, 40 bar and pH 2, 6.8 and 7.8. An experimental study of the dissolution rate of basaltic glass as a function of aqueous concentration of Al, Si and oxalic acid at 25.
CHEMISTRY MODEL
Introduction
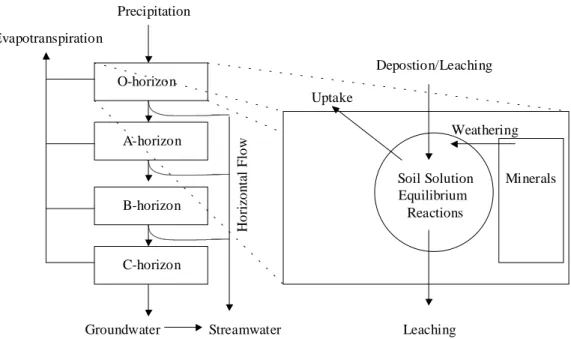
The weathering submodel synthesizes kinetic information about mineral weathering, determined from theoretical analysis of laboratory data and dependent on the mineral composition of the soil. The total weathering rate (expressed as release of Si, Al, Ca, Mg, K and Na) of the entire soil column is calculated as the sum of the weathering rate of each soil layer.
Thus, the inclusion of a pH-independent CO2 effect in the PROFILE model appears to be erroneous and misleading. Other modelers of the global carbon cycle have been more conservative and, in the absence of evidence for a direct effect of CO2, have neglected the possible direct dependence of silicate dissolution rates on PCO2 (Berner et al., 1983).
Applications of the PROFILE Model
Other users of the model have also found that the weathering rates predicted by PROFILE are very sensitive to the specific area input by the user (Hodson and Langan, 1999; Jonsson et al., 1995). In addition, the PROFILE model requires the determination of bulk surface as well as an estimate of the bulk surface contribution of each soil mineral (the user must enter the mineral composition as a % of the total surface).
Illustration of the CO 2 Dependence
A related risk is CO2 leakage from the reservoir through the soil back in. In the soils where the CO2 seeps through, 30-90% of the soil gas is measured as CO2.
Conclusions
The extremely high soil CO2 conditions entered into this series of calculations may appear unrealistic; however, scenarios exist where researchers may be interested in calculating weathering rates under such conditions. The inclusion of this CO2 dependence in the PROFILE model may lead to erroneous conclusions in future applications and may perpetuate confusion on this issue.
New data on the kinetics of the dissolution of alkali feldspar at 200oC in CO2 charged water. Assessing the regional variation in weathering rates of loess and clay soils in the Netherlands.
CONCLUSIONS
Summary
The indirect effects of CO2 are included in the RH and RL terms, so reaction 1 must be rewritten as:
Environmental Implications
Hopefully this works with the work of others who have reported changes in their dissolution rate based on changes in specific surface area that occur during dissolution experiments. Burch et al., 1993; Stillings and Brantley, 1995), will convince researchers that the convention of calculating dissolution rates based on measurements of initial specific surface area is likely to be a gross oversimplification leading to the reporting of erroneous rates of mineral dissolution.
Suggestions for Future Research
Appendix A
DETAILS OF SOIL MINERALOGICAL ANALYSIS
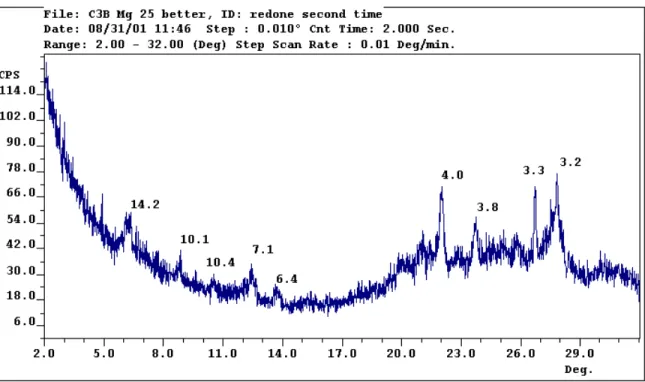
X-ray Diffraction
- Methods
- Results
The peak at 14.2 angstroms (A)1 represents the presence of smectite, vermiculite or chlorite, the peak at 10.1 suggests mica or halloysite, the peak at 7.1 indicates kaolinite or serpentine, the peak at 4.0 cristobalite, the peak of 3.8 peak gypsum, the peak of 3.3. is quartz, and the 3.2 peak is K-feldspar or hornblende. The small peak of 14.2 Å remaining after glycol treatment collapses at K saturation, indicating the presence of vermiculite.
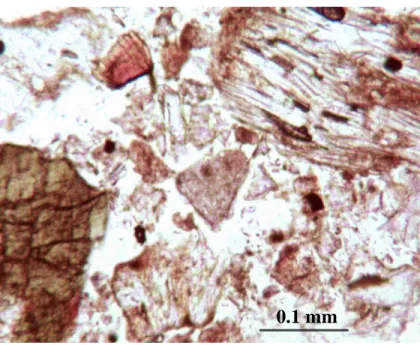
Petrographic Microscope
Transmission Electron Microscope (TEM)
Whether or not these minerals are present in the Mammoth Mountain soils provides some information about the weathering stage of these soils. A synthesized imogolite sample was used as a standard to ensure the detection of the rings reported in the literature.
Appendix B
ADDITIONAL EXPERIMENTAL DATA