The advice and help from members of the Intracellular Engineering team made my life a lot easier. I could not have obtained my data without the help and guidance of the treating gynecologists, especially dr.
Introduction and Motivation
The see and treat system will also save time and expense for patients who have to travel long distances for medical care. In this thesis, the potential of using Raman spectroscopy for the detection of cervical dysplasia is investigated with the long-term goal of using Raman spectroscopy as part of a see and treat strategy for cervical cancer screening.
Specific Aims
An understanding of cellular contributions to Raman spectra improved the characterization of spectral differences between tissue categories.
Classification of the spectra in the test set determines the unbiased accuracy of the algorithm. In training the algorithm, the algorithm coefficients (b) and residual constant (a) are derived by determining the best of the training set inputs and their corresponding assigned scores (assigned by the user).
BACKGROUND
Anatomy and Histology of the Cervix
The cervix is the most inferior part of the uterus and measures 2.5-3 cm in length in the nulliparous adult woman [1]. A small opening in the center of the cervix, called the external os, serves as a connection and passageway between the uterine body and the vagina.
Cervical Dysplasia
Cervical Intraepithelial Neoplasia (CIN) is a general term for dysplastic changes limited to the epithelium of the cervix. The development of cervical cancer is typically a slow process that takes several years for the transformation from normal epithelium to dysplasia to invasive carcinoma.
![Figure 2.1: Diagram illustrating the stages of development of cervical cancer [3]](https://thumb-ap.123doks.com/thumbv2/123dok/10731758.0/16.918.227.698.176.561/figure-2-diagram-illustrating-stages-development-cervical-cancer.webp)
Current Methods of Screening/Diagnosis
- Pap Smear
- Colposcopy
- HPV testing
- A flawed gold standard
HPV testing has been shown to be a more effective tool in triaging women when Pap results show atypical squamous cells of undetermined significance. Because only a minority of these lesions will progress to high-grade lesions, HPV testing can help determine which women should be evaluated with colposcopy because of the increased likelihood that lesions will progress to high-grade SIL in HPV-infected women [8].
New Technologies in Cervical Cancer Screening
Most of the variation in interpretation comes in distinguishing intermediate grades from pathology such as low-grade dysplasia. A real-time diagnosis will improve the cost and time efficiency of the screening process by eliminating the additional time and cost of pathological diagnosis and reducing the number of visits to healthcare providers.
Use of Spectroscopy in Diagnosis of Cervical Lesions
- Fluorescence Spectroscopy
- Near Infrared Absorption Spectroscopy
- Confocal Imaging
- Cost Effectiveness of Spectroscopy
The nuclear-cytoplasmic ratio, calculated using image processing software, was able to distinguish CIN II/III from all others with a sensitivity and specificity of 100% and 91%, respectively [27]. In an analysis of the cost-effectiveness of different strategies for diagnosis and treatment, Cantor et.
Raman Spectroscopy for Diagnosis of Cervical Lesions
- What is Raman Spectroscopy?
- Discrimination Algorithms
- In vivo Raman spectroscopy for the detection of dysplasia and cancer
- Previous Studies using Raman Spectroscopy for Diagnosis in Cervix
In the leave-one-out method, one spectrum is removed from the data set and the algorithm is inferred using the remaining spectra. In the first study investigating the potential of using Raman spectroscopy for cervical diagnosis, Mahadevan-Jansen et.
Spectral comparisons show that the Raman spectra of the raft cultures are similar to those obtained from the cervix in vivo for both normal and Thus, my research has shown that Raman spectroscopy can distinguish high-grade dysplasia from benign areas of the cervix.
CHARACTERIZATION OF RAMAN SPECTRA MEASURED IN VIVO FOR THE
Abstract
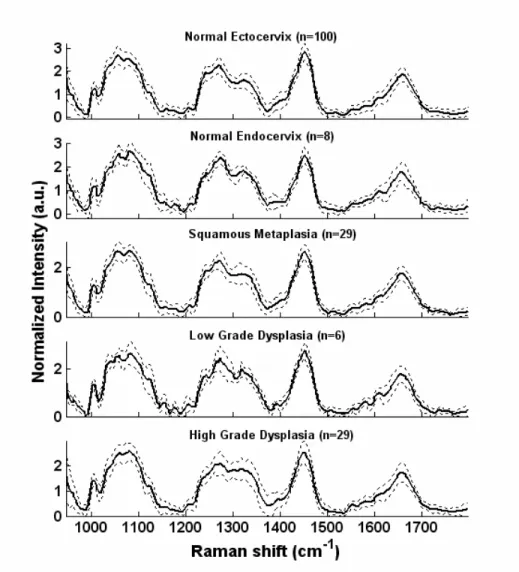
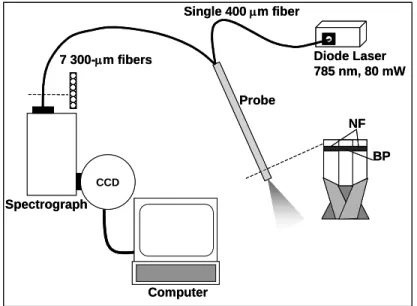
In previous in vitro and in vivo studies, Raman spectroscopy has been shown to have the potential to provide differential diagnosis in the cervix with high sensitivity and specificity. Using a portable system, Raman spectra were collected from the cervix of 79 patients before excision procedures using clinically feasible integration times (5 seconds).
Introduction
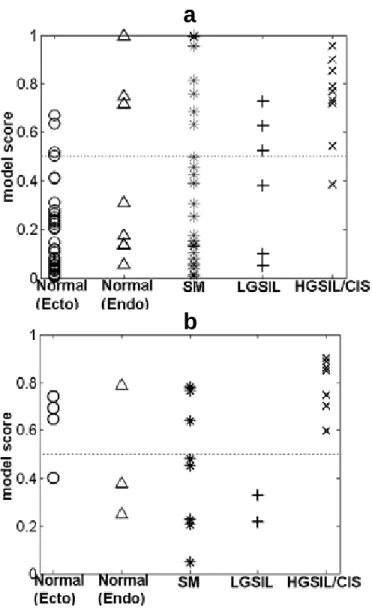
An unbiased assessment of model accuracy shows that Raman spectroscopy was able to distinguish between high-grade dysplasia and benign areas of the cervix (normal ectocervix and squamous metaplasia) with a sensitivity of 89% and a specificity of 81%, while colposcopy in expert hands was able. to discriminate with a sensitivity of 87% and specificity of 72%. Our current study was designed to follow up on the results of the pilot study to further test the potential of using Raman spectroscopy to perform real-time in vivo diagnosis on the cervix.
Methods
- Study Design
- Data Pre-Processing and Extraction
- Data Analysis
Colposcopic examination of the cervix was first performed to identify normal and abnormal areas of the cervix. Colposcopic examination of the cervix was performed first to identify all colposcopically normal and abnormal (if any) areas of the cervix.
Results
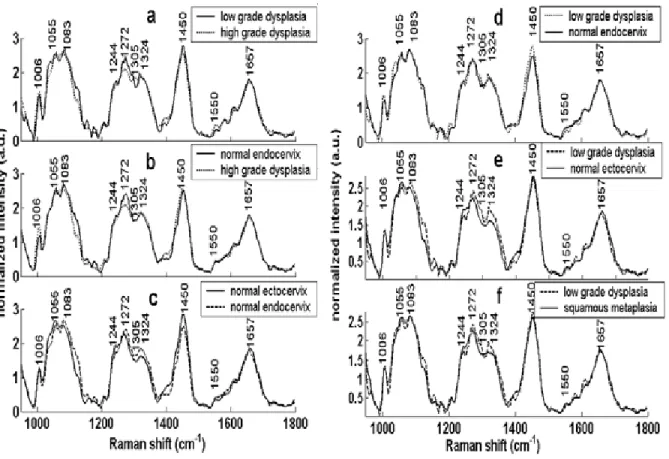
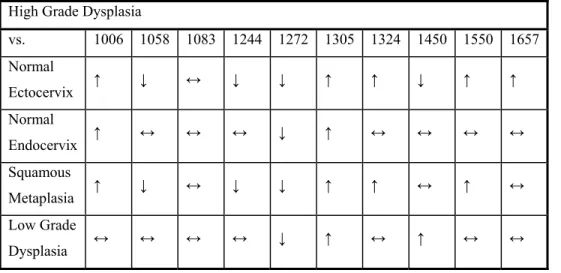
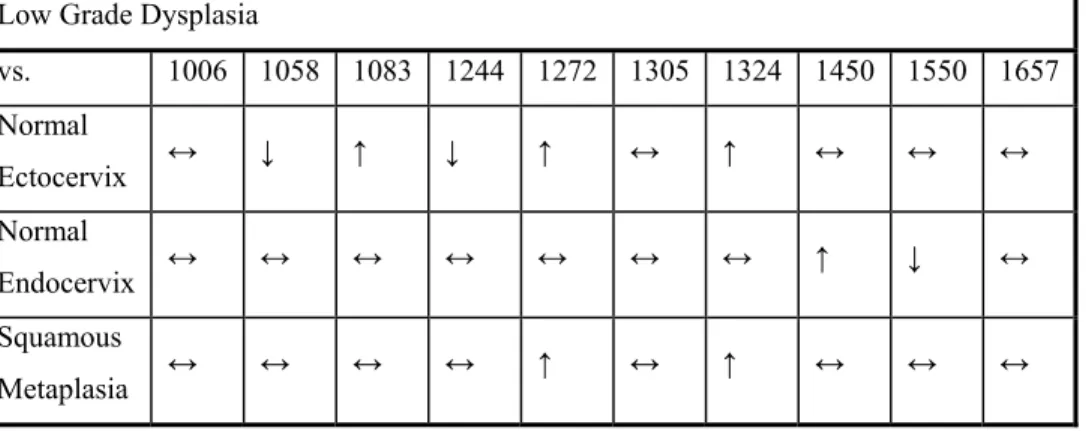
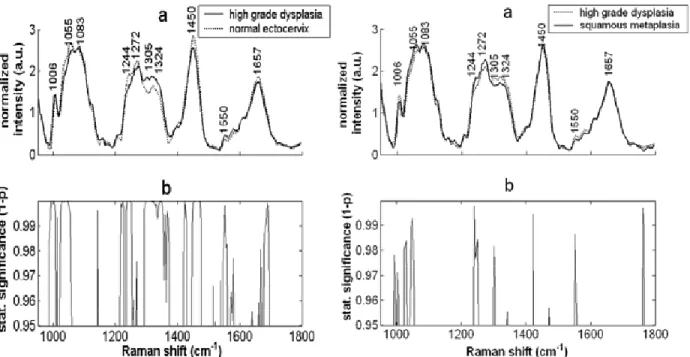
The spectral differences between high-grade dysplasia and normal ectocervic spectra (figure 3.3) and high-grade. The 1006 cm-1 peak shows an increase in the high grade dysplasia spectra, a change that is also seen compared to the normal ectocervic spectra.
Discussion
A true estimate of a model's power can only occur with a larger data set and an increase in the number of low-grade dysplasia and normal endocervix spectra. Encouragingly, the most significant spectral differences of all pathology comparisons are seen in the normal ectocervix/high-grade dysplasia spectral comparison.
Comparing the epithelial spectra of normal and dysplastic raft cultures (figure 5.6b,c), certain differences can be observed. However, there are many additional components present in the stromal layer in vivo (such as inflammatory cells, glandular structures, capillaries) that are not included in the construction of raft cultures.
CHARACTERIZATION AND QUANTIFICATION OF THE SOURCES OF
Abstract
This study seeks to understand and quantify the sources of variance within the spectra of normal ectocervix. Further analysis of the sources of variability between patients examined the spectral differences due to menopausal status, smoking history, and overall patient diagnosis (normal in normal patients versus normal in dysplasia patients).
Introduction
To understand and predict whether Raman spectroscopy can be an effective screening method for cervical cancer, the origin and relative contributions of sources of this variation must be understood. Thus, this study was designed to examine and determine the sources of intrinsic spectral variation observed in vivo.
Methods
- Clinical Study Design
- Data Collection
- Data Pre-Processing and Extraction
- Data Analysis
The use of acetic acid was investigated as a possible source of intrapatient variation, and the optimal duration of signal acquisition was quantified. The effect of acetic acid on the Raman spectra was analyzed using an average spectral overlay and Student's t-test to compare the spectral variability at each wavenumber of spectra collected from areas of dysplasia before and after application of acetic acid.

Results
A bar graph illustrating the spectral differences at different time points after the application of acetic acid is shown in figure 4.3c. In figure 4.6, the spectra of normal ectocervix are stratified according to menopausal status, and the average spectra of pre-menopausal and post-menopausal women are compared.
Discussion
The analysis of the variance components revealed that the main source of variance between spectra of normal ectocervix lies in patient-to-patient variation (Figure 4.4). The spectral variation due to inherent measurement error accounts for less than 2% of the total signal intensity.
Raman spectra from the epithelial and stromal layers were collected separately using the same system (Figure 5.2) and protocol used to collect spectra from the intact raft cultures. Improvements in fiber optic probe design could help solve these problems.
ORGANOTYPIC RAFT CULTURES AS AN EFFECTIVE IN VITRO TOOL FOR
Abstract
Raman spectra of normal as well as dysplastic raft cultures were measured and compared with in vivo spectra from the corresponding tissue type. These results demonstrate that organotypic raft cultures are an effective and useful tool for cellular and biochemical spectroscopic analysis of tissues.
Introduction
The float cultures were compared both morphologically (via histology) and spectroscopically (via Raman spectroscopy) with in vivo tissue data from an ongoing clinical study using Raman spectroscopy for the detection of cervical precancers [ 25 ]. Thus, the utility of float cultures as a suitable model system for the preliminary understanding of the effect of tissue morphology and biochemistry on optical signatures was demonstrated.
Materials And Methods
- Construction of Rafts
- Measurement of Raman Spectra
- Epithelium and Stroma Measurements: Raft Cultures
- Epithelium and Stroma Measurements: Tissue
- Thickness Analysis
- Data Pre-Processing and Extraction
Raman spectra obtained from the epithelium and stroma of intact tissues were compared with the corresponding spectra from raft cultures. Raman spectra were collected from raft cultures on days 4, 8, and 14 after the raft cultures were grown to the air-liquid interface.
Results
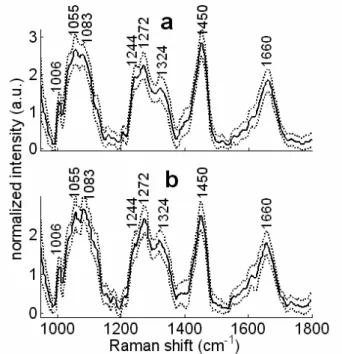
Raman spectra from (a) normal and dysplastic regions of the cervix obtained in vivo [25] and (b) normal (NHK) and two types of dysplastic (SiHa, A431) raft cultures. c) Difference spectra calculated between normal and dysplastic signals from raft cultures and in vivo tissues. Epithelium and stroma separated from (a) normal cervical biopsy (b) normal raft cultures and (c) dysplastic raft cultures.

Discussion
Raman spectra of the raft cultures as well as in vivo human cervical tissues indicate that the region around 1325 cm-1 shows the most consistent differences between normal and dysplastic tissue. The changes seen in the relative size of the peak at 1325 cm-1 can thus primarily be associated with changes seen in the epithelial layer.
The remaining pathology categories were included in the test set, and although only 2/3 of the squamous. Many of the in vitro studies in the literature used only biopsy specimens with a single pathology throughout the specimens.
CONCLUSIONS AND FUTURE DIRECTIONS
Summary
Thus, the current work represents a significant advance in understanding the power and limitations of Raman spectroscopy for diagnosis in the clinic and operating room. Difference spectra measuring the divergence of dysplasia from normal spectra showed that the raft culture spectra exhibit similar deviations as observed in vivo, with the exception of the peak at 1450 cm-1.
Limitation of Current Results and Future Directions
Logistic regression was chosen based on the nature of the desired classification and the amount of data available. A continuation of the float culture experiments should not only improve the understanding of the effect of biological variables on the tissue spectra, but also the development of robust algorithms and accuracy of classification.
Protection of Research Subjects
While Raman spectroscopy provides a spectral fingerprint of the chemical bonds present in the tissue and is therefore a very specific technique, fluorescence spectroscopy provides a measure of the metabolic state of the tissue and has a good overall sensitivity. For the in vivo clinical studies, the Vanderbilt Institutional Review Board approved the two separate protocols entitled "Detection of Cervical Precancers Using Near-Infrared Raman Spectroscopy: A Pilot in Vivo Study" (IRB# 010245) and "Study of Normal Cervix using Raman, reviewed and approved" Spectroscopy" (IRB # 02-0345).
Societal Benefits
Informed consent was obtained before each study, and patients had the right to refuse to participate or withdraw from the study at any time without compromising their care. The clinical study did not add any pain to the procedure, and steps were taken to minimize any additional inconvenience or discomfort the patient may experience due to the longer time required for the study.
From Collection of Spectrum to Generation of First Algorithm
Generation of Second Algorithm
The figure also illustrates the results from the model classification of the remaining three pathology types (normal endocervix, squamous metaplasia, low-grade dysplasia). CHARACTERIZATION AND QUANTIFICATION OF THE SOURCES OF VARIABILITY PRESENT IN RAMAN SPECTRA OF THE CERVIX.