The Role of the Nonprofit Sector in the Indianapolis Area
©2002 Center for Urban Policy and the Environment (02-C10) School of Public and Environmental Affairs Indiana University–Purdue University Indianapolis 342 North Senate Avenue • Indianapolis, Indiana 46204-1708
Central Indiana’s Future:
Understanding the Region and Identifying Choices
Central Indiana’s Future: Understanding the Region and Identifying Choices, funded by an award of general support from Lilly Endowment, Inc.,is a research project that seeks to increase understanding of the region and to inform decision-makers about the array of options for improving quality of life for Central Indiana residents. Th e Ce nter for Urban Po l i cy and the Env i ro n m e nt faculty and staff, with other researchers from several universities, are working to understand how the broad range of invest- ments made by households, government, businesses, and nonprofit organizations within the Central Indiana region contribute to quality of life. The geographic scope of the project includes 44 counties in an integrated economic region identified by the U.S.Bureau of Economic Analysis.
The Ce nter for Urban Po l i cy and the Env i ro n m e nt is part of the School of Pu b l i c and Env i ro n m e ntal Affairs at Indiana Unive r s i ty – Pu rdue Unive r s i ty Indianapolis.
For more information about the Central Indiana Project or the research reported here, contact the center at 317-261-3000 or visit the center’s Web site at www.urbancenter.iupui.edu.
Central Indiana Region
TABLE OF CONTENTS
Executive Summary 1
Introduction 3
Methodology 5
The Nonprofit Organizations in the Indianapolis MSA Are Diverse 7 Nonprofit Organizations Make Contributions to Individuals and the Community 13 Nonprofit Organizations Interact with Other Organizations for Many Purposes 23 Understanding Nonprofits Strengthens the Sector and the Community 29
References 31
Appendix: Nonprofit Questionnaire 33
AUTHORS
Wolfgang Bielefeld, Ph.D.
Faculty Fellow
Center for Urban Policy and the Environment Associate Professor
School of Public and Environmental Affairs Indiana University–Purdue University Indianapolis E-mail:[email protected]
Wendy McLaughlin Graduate Research Assistant
Center for Urban Policy and the Environment
Kami Linders
Graduate Research Assistant
Center for Urban Policy and the Environment
FIGURES
Figure 1: Education Is the Most Common Type of Primary Service Provided 6
Figure 2: Most Nonprofits Report an Increase in Demand for Services 9
Figure 3: Income from Government Agencies Is the Smallest Revenue Source 9
Figure 4: Organizational Age Ranges from 1 to 171 Years 10
Figure 5: Most of the Responding Nonprofits Are Less than 25 Years Old 11
Figure 6: On Average, Recreation Nonprofits Serve More People 12
Figure 7: On Average, Recreation Nonprofits Have More Volunteers 14
Figure 8: On Average, Religion Nonprofits Report Higher Memberships 15
Figure 9: On Average, Health Nonprofits Employ Many More Workers 15
Figure 10: Most Nonprofits Provide Training Opportunities for Employees and Volunteers 16 Figure 11: Training Opportunities Are Provided by Nonprofits in Every Service Category 16 Figure 12: A Number of Organizations Have Been in Their Neighborhoods for Many Years 17 Figure 13: Nonprofits Provide Mostly High or Moderate Opportunities for People to Develop Beneficial Ties or Contacts 18 Figure 14: Opportunities Provided by Nonprofits to Develop Ties or Contacts Are High across Service Categories 18 Figure 15: Income from Private Sources Is Important to the Funding of Nonprofits in All Service Categories 19
Figure 16: Indianapolis MSA Nonprofits Also Rely on Self-Generated Income 20
Figure 17: On Average, Health Nonprofits Spent the Most in One Year on Building Repairs 20 Figure 18: On Average, Health Nonprofits Spent the Most in One Year on Additions or Remodeling 21 Figure 19: The Most Common Interaction between Nonprofits and Other Organizations Is for Funding or Resources 23 Figure 20: Nonprofit to Nonprofit Interaction through Competitive Situations Is Relatively Low for All Service Categories 24 Figure 21: Nonprofit to For-Profit Interaction through Competitive Situations Is Relatively Low for All Service Categories 25 Figure 22: Importance of Nonprofit to Government Interaction through Regulatory Issues Varies across Service Categories 26 Figure 23: Average Percent of Income from Government Sources Ranges from 1 to 24 Percent across Service Categories 27 Figure 24: Most Nonprofits Do Not Attribute Increase in Demand for Services to Welfare Reform 27 Figure 25: Attributing Increased Demand to Welfare Reform Varies across Service Categories 27
TABLES
Table 1: There Are Numerous Ways to Measure the Size of Indianapolis MSA Nonprofits 8
Table 2: Average and Median Income, Expenditures, and Capital Fund 9
Table 3: Primary Service Types Can Be Condensed into 10 Categories 13
MAPS
Map 1: Indianapolis Metropolitan Statistical Area 5
EXECUTIVE SUMMARY
The goal of this report is to provide detailed information about the nonprofit sector in the Indianapolis area. A survey of 749 IRS category 501(c)(3) organizations in the Indianapolis metropolitan statistical area (MSA) found:
• Three-fourths of all organizations report that they provide more than one type of service.
• The most frequent choices for primary service include education (29 percent), and religion or spiritual development (20 percent).
• Based on the number of employees, members, and volunteers, many of the responding organizations are small and a few are large.
• More than half of reporting organizations (61 percent) state that the demand for their services has increased in the past year.
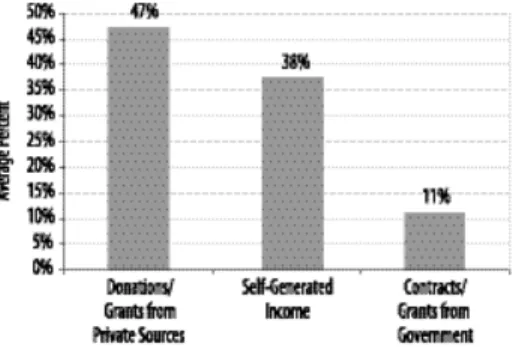
• Nonprofits report that 47 percent of their income comes from private donations, 38 percent from self-generated sources, and 11 percent from government. These results confirm a heavy reliance on the generosity of individuals, foundations, and corporations.
• Most organizations (56 percent) are less than 25 years old, but a small number of organizations (7 percent) existed before 1900.
• Many nonprofit organizations (73 percent) report interacting with other non- profit organizations. Additionally, 53 percent of organizations report interacting with government agencies and 51 percent of organizations report interacting with for-profit organizations.
• Nonprofit organizations interact with other nonprofit organizations most fre- quently for cooperative arrangements (54 percent),with government agencies for funding and resources (39 percent),and with for-profit organizations for funding and resources (44 percent).
The nine counties in the Indianapolis MSA are: Boone, Hamilton,Hancock, Hendricks, Johnson,Madison,Marion,Morgan,and Shelby. The survey was conducted between December and June 2000-01. The authors designed the sur vey instrument to collect information from nonprofit organizations located in the Indianapolis MSA regarding their size, function,and relationship with other sectors. This information will provide a better understanding of nonprofit organizations in the Indianapolis MSA. This is fundamental to furthering the appreciation and improvement of the voluntary sector.
INTRODUCTION
The nonprofit sector in the United States today is composed of a vast array of organ- izations. Over 1.3 million nonprofit organizations were registered with the Internal Revenue Service (IRS) in 1999. To this number, one can add many small organiza- tions as well as churches, which are not required to register.1Included in the IRS fig- ures for 1999 are over 770,000 public benefit organizations (IRS category 501(c)(3)).
These public benefit organizations provide the types of services with which we are most familiar. Their role in the Indianapolis area is the focus of this report.
Nonprofit organizations traditionally have been important in American life and have contributed to our individual and community welfare since colonial times.
Alexis de Tocqueville, in fact, pointed out to the world in 1835 how important volun- tary and collective action was to our way of life in the United States. Many authors since then have described the multitude of ways that the nonprofit sector impacts us and embodies many of our cherished values.
Jon Van Til (1988,2000) and Lester Salamon (1999,2000),for instance, describe the nonprofit sector’s place as one of the four basic sectors of society, alongside the political (government),economic (for-profit),and cultural (family, neighborhood, and community) sectors. As such,its role involves both providing important services and relating to the other sectors as they function.
The nonprofit sector provides us with services that neither the government nor the for-profit sector will provide. On one hand, a democratic government will provide public goods, such as parks, only to the level that the voters will support.
Those who desire more of these goods will turn to nonprofit organizations to pro- vide them. In other cases, some individuals, such as the poor, may not be in a posi- tion to obtain the goods or services available in the marketplace. They will,likewise, turn to the nonprofit sector as an alternative supplier. Through these activities, the nonprofit sector addresses unmet needs and promotes greater access, diversity, and equity.
The nonprofit sector also works in partnership with both the public and for- profit sectors. It is the recipient of government contracts to deliver public services such as social welfare. In addition, corporations traditionally have funded nonprofit organizations, and cooperative arrangements between nonprofits and their corpo- rate partners, such as cause-related marketing, are becoming increasingly common.
In its provision of goods and services and its relationships with the government and for-profits, moreover, the nonprofit sector has been an important source of innova- tion,often leading the way toward finding solutions for our social problems.
1 Elizabeth Boris (1999) provides an overview of the sector for those seeking additional details.
The nonprofit sector has served as an advocate on behalf of those who criticize or seek to change either government or for-profit corporate activity. It mobilizes public attention to community problems or needs and allows people to be heard on issues they consider important. In this way, it provides an important social safety valve as it functions as part of our pluralistic system to assure democracy and con- tribute to social justice.
On another level,the nonprofit sector helps bring us together. Through joining with others, we can ease the isolation that we might encounter living in modern society. Moreover, participation is a way for us to build solidarity and integration. By cooperating and working with others, we strengthen our communities. The bonds of trust and reciprocity (social capital) that develop between people participating together in nonprofit organizations can help them work together outside the organi- zation to address community issues.
Furthermore, the nonprofit sector provides us with a way to express other important values. Chief among these are altruism, expressed through helping others.
More generally, both those seeking to preserve old values, ideals, and traditions and those seeking to change them or create new ones utilize nonprofit organizations (for example, through educational or political organizations).
Finally, we should not forget the many opportunities for personal enrichment and enjoyment that the nonprofit sector provides (Smith 1983). Through arts, cultur- al,and religious organizations, our lives are given meaning and a sense of mystery, wonder, and the sacred. Through self-help organizations we can be liberated and enhance our individual capacities and potentialities. Less seriously, many organiza- tions are there to let us play, something that is becoming increasingly important in our stressful world.
The nonprofit sector in Indianapolis plays all of these roles for the individuals and communities that make up this metropolitan area. Unfortunately, the sector in this area is often unfamiliar, underappreciated, or misunderstood. The goal of this study is to describe an important portion of the Indianapolis area nonprofit sector and the contributions that these nonprofit organizations make to this community.
We hope that our findings will foster a greater appreciation of the nonprofit sector by community leaders, policymakers, and citizens, helping them to both understand the strengths of the sector and to take action to improve the sector.
METHODOLOGY
The Center for Urban Policy and the Environment (Center),funded partially by an award of general support from Lilly Endowment, Inc., conducted a mail survey of 501(c)(3) nonprofit organizations in the nine-county Indianapolis metropolitan sta- tistical area (MSA). The metropolitan counties include Boone, Hamilton,Hancock, Hendricks, Johnson,Madison,Marion,Morgan,and Shelby.
Organizations that received this survey were identified as part of a study of the Indiana nonprofit sector led by Kirsten Grønjberg of the School of Public and Environmental Affairs at Indiana University in Bloomington. All 501(c)(3) nonprofit organizations in the nine-county Indianapolis MSA that were registered with the IRS in 1997 and in 1999 were compiled into a combined list. Staff and research assis- tants reviewed the list and eliminated duplicate organizations and organizations that were inappropriate (operating outside of Indiana) to the study. This resulted in a list of 4,658 organizations.
Staff at the Center designed the survey instrument.Surveys were mailed in three phases over the course of six months to ensure the best response rate possi- ble. The first mailing was sent to all organizations in December 2000. The second mailing was sent in February 2001, to 3,849 nonprofit organizations. The third and final mailing was sent in May 2001, to 3,398 nonprofit organizations. Over the course of these mailings, 748 (16 percent) surveys were returned as undeliverable.
Of the remaining 3,910 organizations, responses were obtained from 788 (20 per- cent). It was subsequently determined that 39 of these were ineligible for the study for a variety of reasons including: not located in the study area,not classified as a 501(c)(3) organization,or inactive at this time. This analysis is based on responses from 749 organizations.
Staff designed a two-page survey (see Appendix) which contained questions about the types of services provided, organizational age, staff, members and volun- teers, people served, change in demand for services, length of time in the communi- ty, finances, improvements to physical structures, promotion of social capital,and contacts with other nonprofits, for-profits, and government agencies.
Map 1: Indianapolis Metropolitan Statistical Area
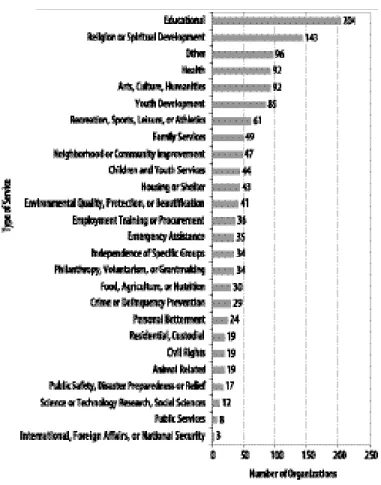
Figure 1: Education Is the Most Common Type of Primary Service Provided (n = 712)
THE NONPROFIT ORGANIZATIONS IN THE INDIANAPOLIS MSA ARE DIVERSE
This section presents a general description of the nonprofit organizations that responded to the survey. This overview will provide a broad picture of the voluntary sector in the Indianapolis MSA. It includes summaries of the types of services pro- vided and indicators of size along with information about the demand for services, finances, and organizational age.
Indianapolis MSA Nonprofits Provide a Broad Range of Services To classify the types of services nonprofit organizations provide, a typology has been developed by the National Center for Charitable Statistics at the Urban Institute (http://nccs.urban.org/ntee-cc/index.htm). This typology contains 26 types of services. Respondents were presented with this list of services and asked to rank in order of importance the services their organization provided (ranks could be tied). For details on service types, refer to question four in the Appendix.
Respondents from 723 organizations provided rankings. Of these respon- dents, 75 percent chose more than one service type to describe their services. The service or services that were ranked number one were designated as the organiza- tion’s primary service type. Of the 712 organizations that indicated a primary serv- ice type, nearly 60 percent reported a single primary service type and nearly 40 per- cent reported more than one primary service type, indicating that many organiza- tions provide their primary services in multiple service types. For those reporting more than one primary service type, the average number of primary services was three. Besides their primary service types, many organizations gave other service types lesser rankings (second, third, etc.). Roughly, 56 percent of organizations reported at least one secondary service.
Since organizations could indicate more than one primary service type, a total of 1,316 primary services were reported. Figure 1 shows the breakdown of these reports. The most frequent choices for primary service were educational (29 percent) and religion or spiritual development (20 percent). Other frequently chosen primary service types included health,arts/culture/humanities, youth devel- opment, and other. The primary service types chosen by the fewest organizations were public services (1 percent) and international/foreign affairs/national security (0.4 percent).
The Size of Nonprofit Organizations in the Indianapolis MSA Varies Widely Regardless of Measurement Used
The size of a nonprofit organization can be assessed in a variety of ways, including the number of employees, members, or volunteers;the number of people served;or income and expenditures. Several of these measures are shown in Table 1.
Employees
The survey asked organizations to report the number of their full-time equivalent (FTE) employees. The number of employees varied widely, ranging from zero to 8,900.
Many organizations, however, are small or run by volunteer staff, and the most fre- quent response was zero, reported by 31 percent of the organizations. Another 13 percent reported only one FTE employee. The pattern of many small organizations and a few very large ones is typical of the nonprofit sector. As a result, an average (the mean) often is misleading, being influenced primarily by the largest reports.
Consequently, the median (the number halfway between the largest and smallest numbers) more realistically represents the “typical”organizations. This case is a good example because the average number of FTE employees per organization is 69,while the median is only 2. The organizations with the largest numbers of employees are health providers.
Members
Organizations also were asked to report their membership numbers. The range of responses to this question was even larger than the range of employees. The number of members ranged from zero (62 respondents) to 834,037. The two largest organiza- tions were an international religious organization with 834,037 members and a national religious organization with 600,000 members. The memberships of these large organizations significantly impact the average per organization,which is 7,351 members. The median,which is more representative in this case, is 84 members.
Volunteers
Another measure of size is the number of volunteers an organization utilizes. The number of volunteers reported ranged from zero, the number reported most frequent- ly (72 organizations), to 22,039. The average number of volunteers per organization is 305 and the median is 30.
People Served
The final measure of size (shown in Table 1) is the number of people the organization serves. This measure had a very large range, from zero (18 organizations) to an
Number Average Median Mode Reporting
Employees (FTE) 69 2 0 697
Members 7,351 84 0 508
Volunteers 305 30 0 583
People Served 65,154 750 500 513
Table 1: There Are Numerous Ways to Measure the Size of Indianapolis MSA Nonprofits
astounding 8,000,000 (an international religious organization). Other large numbers included 6,000,000 people served by a statewide recreation organization and 3,800,000 by a statewide public service organization. Ten organizations reported over one million people ser ved. Based on the few extremely large numbers, the resulting average per organization is 65,154. More representative numbers are the median,750,and the mode (most common number reported),500.
The Demand for Services by Nonprofit Organizations is Increasing Given their role as service providers, it is important to assess whether or not the organizations have experienced increased demand for their services. The survey asked if over the last two years demand had increased, decreased, or stayed about the same. Figure 2 shows the responses to this question. Well over half (65 percent) of the organizations reported that demand for their services had increased over the past two years. Far fewer (28 percent) reported that demand had stayed about the same, and few (3 percent) reported that demand decreased. Taken together, these results clearly show that the nonprofit sector is becoming increasingly important as
a deliverer of services to the citizens of the Indianapolis area.
Financial Aspects of the Nonprofit Sector Also Vary Widely
Finances are an important factor in the ability of an organization to function. To help understand the financial situations of area nonprofits, the survey asked for informa- tion about income, expenditures, and capital funds. These results are shown in Table 2. Income ranged from zero to $700 million. The average reported income is
$4,468,679 and the median is $170,000. Operating expenditures ranged from zero to $900 million. The average is $5,923,627 and the median is $164,393. The capital fund range is ze ro to $144,549,582. The ave rage is $1,787,680, and the median is $250.
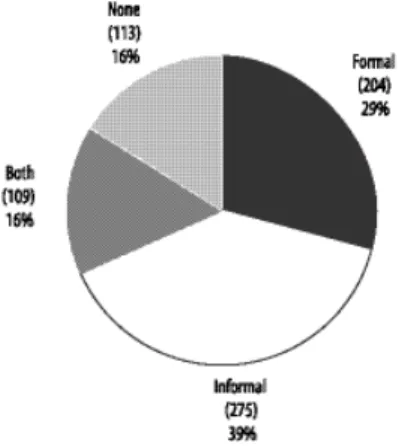
Another important factor is where nonprofits obtain their funds. The survey asked about the percentage of income from donations or grants from private sources, contracts or grants from government agencies, and self-generated sources such as program service revenue. Figure 3 displays the responses. For these, the average percent of income from private sources was 47 percent, the average that came from self-generated sources was 38 percent, and the average that came from government sources was 11 percent. This tells something about the character of the local non- p rofit secto r. It is heavily re l i a nt on the genero s i ty of private individuals, f o u n d a- t i o n s, and co r p o rat i o n s . It also is quite re l i a nt on generating its own income fro m re l ated or unre l ated income source s . As a source of inco m e, g ove r n m e nt funding is a distant third.
Table 2: Average and Median Income, Expenditures, and Capital Fund
Number Average Median Reporting
Income $4,468,679 $170,000 465
Operating
Expenditures $5,923,627 $164,393 622
Capital Fund $1,787,680 $250 302
Figure 2: Most Nonprofits Report an Increase in Demand for Services (n = 698)
Figure 3: Income from Government Agencies Is the Smallest Revenue Source (n = 669)
Most Nonprofit Organizations in the Indianapolis MSA Were Established within the Past 25 Years
Another way to characterize a nonprofit sector is by the age of the organizations in it. Do we find many older, stable organizations or have most been founded recently?
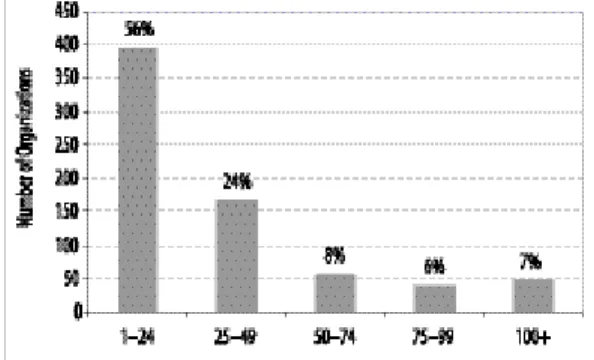
The survey asked organizations when they were founded. Age was calculated by subtracting the year the organization was founded from 2001. The results are shown in Figure 4. The range of organizational age is 1 to 171 years. The average age is 33 years, the median age is 21 years, and the most frequent answer is 3 years. From this information,it is clear that most (56 percent) of the organizations surveyed are less than 25 years old. Many organizations are older, however, and a number have very long histories in this area. The responses indicate that 24 percent are between 25 and 49 years old, 8 percent are between 50 and 74 years old, 6 percent are between 75 and 99 years old, and 7 percent are 100 or more years old. Among the 46 organi- zations that report a founding date before 1900,most are religious organizations.
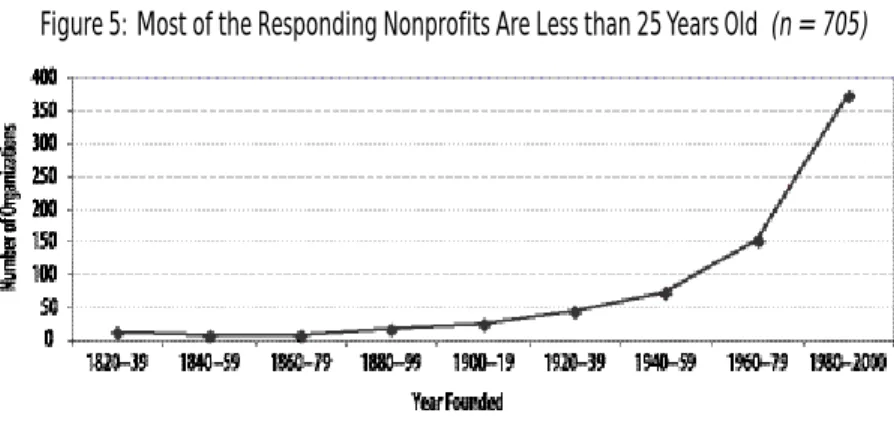
Placing the year the organization was founded on a line graph ranging from 1830 to 2000 (Figure 5) shows the pattern in more detail. The graph shows a steep slope for organizations founded in the past 20 years. The figure shows 47 percent with a founding date before 1979,and 53 percent founded between 1980 and 2000.
The graph shows a more horizontal line for organizations founded in earlier years.
This pattern is the result of several factors. First, the nonprofit sector has grown rapidly since the late 1970s. In 1982,there were approximately 793,000 non- profit organizations that were considered 501(c)(3) or 501(c)(4) or religious congre- gations in the United States (INDEPENDENT SECTOR 2001). This number jumped to approximately 1,230,000 by 1998,an increase of 55 percent. Second, organizational mortality is highest in the early years of an organization’s life. Consequently, those organizations that survive this period are likely to continue for a longer period, creat- ing the stable pattern found in the graph.
Figure 4: Organizational Age Ranges from 1 to 171 Years (n = 705)
Figure 5: Most of the Responding Nonprofits Are Less than 25 Years Old (n = 705)
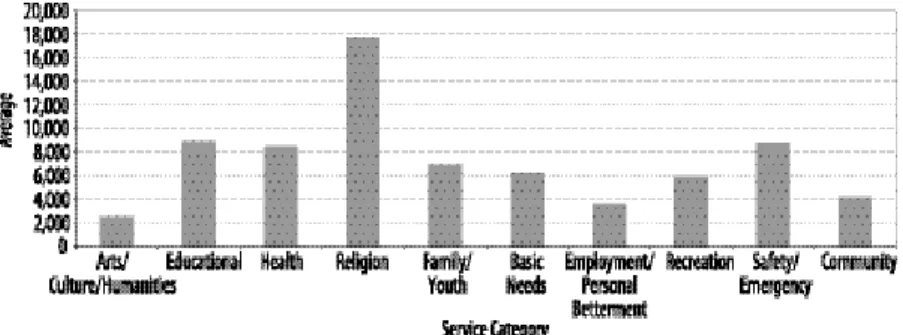
Figure 6: On Average, Recreation Nonprofits Serve More People (n = 513)
NONPROFIT ORGANIZATIONS MAKE CONTRIBUTIONS TO INDIVIDUALS AND THE COMMUNITY
A number of survey questions were designed to provide a more detailed picture of the many contributions the nonprofit sector makes to the citizens and communities of the Indianapolis area. This section examines the provision of services, the benefits derived from participation,and the contributions the sector makes to social capital and community infrastructure and stability. This information shows that nonprofit organizations provide individuals with useful opportunities to work together, to influence the community, and to enhance their lives.
Much of the analysis focuses on the specific service types of the nonprofits in the study. To make these analyses easier to present, the original 26 service types were condensed into 10 service categories. Organizations were grouped into 10 new categories according to their primary service type(s).
Nonprofits Provide Services and Opportunities to Individuals
Nonprofits provide benefits by offering services that directly assist people. The first nine of the ten categories in Table 3 are composed of such services. For example, nonprofits directly benefit people by providing services such as health,food and shelter, recreation,children and family services, and religion.
In addition,nonprofits provide volunteer and membership opportunities, mak- ing people feel active and engaged in their community. Finally, nonprofits are a significant source of employment and often provide training opportunities for indi- viduals to gain additional skills to enhance their employment prospects.
Services to Individuals
As stated previously, the average number of people served per responding organiza- tion is 65,154. Figure 6 shows the number of people ser ved, on average, by the non- profits in the various service categories. It indicates that within the nine categories that directly assist people, the average number of people served is highest in the recreation category. This number, however, is large because of two organizations—
one is a statewide recreation organization serving 6 million people and another is a multi-service organization serving 1 million. The next largest number of people served is by organizations in the religion category. The lowest average number of people served per organization is in the family/youth category.
Table 3: Primary Service Types Can Be Condensed into 10 Categories (n = 712)
Number of Organizations in Primary Service
Service Category Category
Arts/Culture/Humanities 92
Educational 204
Health 92
Religion 143
Family/Youth (includes Youth Development,
Children/Youth Services, and Family Services) 133 Basic Needs (includes Food/Agriculture/Nutrition,
Housing/Shelter, Residential/Custodial,and
Independence of Specific Groups) 100
Employment/Personal Betterment 51
Recreation 61
Safety/Emergency (includes Crime/Delinquency Prevention, Public Safety/Disaster Preparedness/
Relief, and Emergency Assistance) 64 Community (includes Environmental Quality, Animal
Related, Neighborhood or Community Improvement, Civil Rights/Social Action/Advocacy, International/
Foreign Affairs/National Security, Philanthropy/
Voluntarism/Grant Making, Science or Technology Research/Social Sciences, and Public Services) 136
Volunteering and Membership
Another important way nonprofit organizations contribute to individual well-being is by providing opportunities for volunteering and membership. These activities give people a way to become involved in their communities and potentially increase the quality of their lives. According to a recent report by the Center for Urban Policy and the Environment, church-related and school and youth programs had the highest rates of volunteerism in Central Indiana. The report also found, “…Central Indiana residents (36 percent) were slightly more likely than respondents in the nation (34 percent) or state as a whole (33 percent) to think that they could have a big impact in making their community a better place to live” (Littlepage 2001, p. 3).
As reported earlier, the average number of volunteers per responding organiza- tion was 305. Figure 7 shows the number of nonprofit volunteers, on average, in the various service categories. Volunteers are most prevalent in the recreation category (with an average of 1,035 volunteers). This number was influenced by two national organizations. The second largest number of volunteers per organization is in the family/youth category. Volunteers in the study are least prevalent in the religion cate- gory (with an average of 105 volunteers). It must be noted, however, that churches need not register with the IRS. Some, however, do;national estimates are that about 17 percent (Bowen et al.1994) are registered. This study, which is based on the IRS listing, therefore, includes only a small subset of the churches in the Indianapolis area.
Hence, the findings for the religion category should be regarded as partial findings.
The survey results indicate that the average number of members per responding organization is 7,351. Figure 8 shows the number of members, on average, in the nonprofits in the various service categories. The largest number of members is reported by the organizations in the religion category (with an average of 17,681 members). This number is large primarily due to responses by an international Figure 7: On Average, Recreation Nonprofits Have More Volunteers (n = 583)
organization and a national organization. Other large membership numbers per organization are in the educational,health,and safety/emergency categories. The smallest number of members is reported by the arts/culture/humanities category (with an average of 2,488 members and a median of 80 members).
Employment and Training
Nonprofit organizations are a considerable source of employment in the nation and in the Indianapolis MSA. Boris (1999) reports that 9 percent of paid U.S.employment was in the nonprofit sector in 1994. The average number of employees in the non- profits responding to the survey is 69. Figure 9 shows the number of employees, on average, in the nonprofits in the various service categories. It shows that the largest average numbers of employees are in organizations in the health category, with an average of 364 FTE employees. The organizations that employ the least numbers of people are in the safety/emergency category with an average of nine FTE employees.
Besides being a significant employer, nonprofits also provide people with opportunities to enhance their skills through training. Organizations were asked whether they provide formal or informal training for employees or volunteers.
Figure 9: On Average, Health Nonprofits Employ Many More Workers (n = 697) Figure 8: On Average, Religion Nonprofits Report Higher Memberships (n = 508)
Figure 10 shows that the nonprofit sector is a major provider of training. After removing 10 “unsure” responses, the vast majority (84 percent) indicated that they provide training of some kind, and 45 percent report that they provide formal train- ing or both formal and informal training opportunities for employees or volunteers.
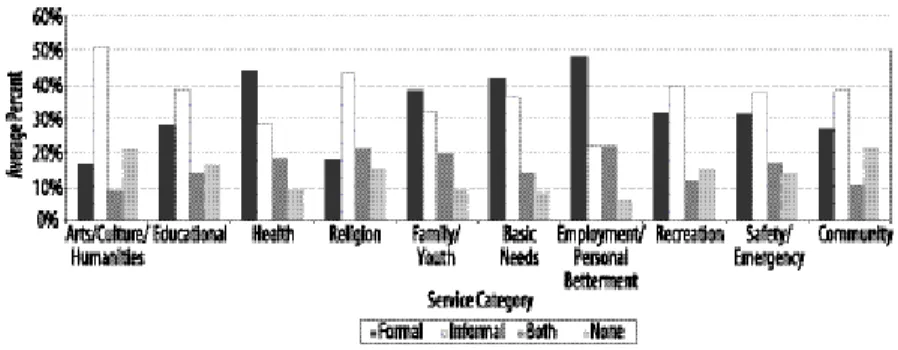
As shown in Figure 11,among organizations providing only formal training, the employment/personal betterment category has the largest proportion (48 percent), and the arts/culture/humanities category has the smallest proportion (17 percent).
Among those providing only informal training, the arts/culture/humanities category has the largest proportion (51 percent),and the employment/personal betterment category has the smallest proportion (22 percent). Among those providing both for- mal and informal training, the employment/personal betterment category has the largest proportion (22 percent) and the arts/culture/humanities category has the smallest proportion (9 percent). Among those that provide no training, the commu- nity category has the largest proportion (22 percent) and the employment/personal betterment category has the smallest proportion (6 percent).
Nonprofit Organizations Are Beneficial to the Community
Nonprofits are important assets to the community and they provide services that directly benefit the community. The safety/emergency category and community category contain organizations providing such services (see Table 3,page 13).
N o n p rofits serve neighborhoods within a co m m u n i ty and their pre s e n ce can co nt r i b u te to neighborhood stability. Sometimes they provide serv i ces at multiple l o c at i o n s . In addition, they generate social capital by providing opportunities for people to develop ties that can be used to address co m m u n i ty issues. Fi n a l l y, t h e y co nt r i b u te to the co mm u n i ty’s infra s t r u ct u re through the upkeep of the buildings in which they are locate d.
Figure 11: Training Opportunities Are Provided by Nonprofits in Every Service Category (n = 711)
Figure 10: Most Nonprofits Provide Training Opportunities for Employees and Volunteers (n = 711)
Years in the Neighborhood
One measure of how beneficial nonprofits are to the community is how long they have been in the neighborhood. For local organizations, this is an indicator of how useful they have been and the willingness of the community to support them.
Organizations were asked how many years they have been located in their neighbor- hood. The length of time ranged from one to 170 years, with 10 years as the most frequent answer. The average was 26 years in the neighborhood and the median was 15 years.
The findings show that a number of organizations have been in their neighbor- hoods for many years. Ten percent of the responding organizations have been locat- ed in their neighborhood between 50 and 99 years, and four percent have been in the same neighborhood for 100 years or more (Figure 12). Organizations can be con- sidered stable in the community if they have existed for many years and have been located in the same neighborhood for most of that time. In this study, organizations were asked to report both their age and the number of years they had been in the same neighborhood. There were 18 organizations that reported existing more than 100 years and being located in their current neighborhood for all of that time. The largest five organizations (according to income) of these stable organizations include one in the arts/culture/humanities category, one in the health category, one in the religion category, one in the family/youth category, and one in the community category. The next 13 largest stable organizations according to income are all reli- gious organizations. Therefore, 78 percent of the largest stable organizations are religious organizations. This result provides an indication of the stability of religious organizations in their communities.
Multiple Locations and Serving within the Neighborhood
To better serve their communities, nonprofits often branch out and serve in more than one location. There were 705 responses to the questions:Does the organization provide services at more than one location? If yes, at how many locations are services provided? Forty-six percent said they serve in more than one location and 72 per- cent of these then reported the number of service locations in operation. The most frequent answer was two locations and the average number of locations was 87.
This is, however, strongly affected by several large national organizations. A more representative number is the median,which is five service locations.
Many nonprofits are community-based organizations and concentrate on serv- ing those in the area in which they are located. The survey asked respondents to:
Estimate the percentage of those that you serve who live within one mile of your
Figure 12: A Number of Organizations Have Been in Their Neighborhoods for Many Years (n = 663)
location and within five miles of your location. There were 437 responses to the one- mile question and 522 responses to the five-mile question. The findings show that a sizeable portion of the Indianapolis nonprofit sec tor is focused on the neighborhoods in which the organizations are located. On average, 22 percent of the people served by those responding lived within one mile of the organization,and 51 percent lived within five miles of the organization.
Social Capital
Social capital can be generated when an organization serves as a place where people can develop ties with one another. These networks then can be used outside the organization to benefit both individuals and the community. Figure 13 shows the results to the question:To what extent does your organization provide opportunities for clients, members, or volunteers to develop ties or contacts with each other that might benefit them or their communities? Seventy-five percent of the organizations report- ed providing these opportunities to a moderate or high extent. According to the results, the nonprofits in the Indianapolis area serve as important generators of social capital. Removing those who answered “unsure,” it is evident that the vast majority (82 percent) provide opportunities for people to build networks, and 43 percent do so to a high degree.
Figure 14 illustrates the social capital responses across the ten service cate- gories. Among those reporting high opportunities for social capital development, the largest proportion is found in the safety/emergency category (52 percent) and the smallest proportion is found in the recreation category (36 percent). Among those reporting moderate opportunities for social capital development, the largest proportion is found in the recreation category (41 percent) and the smallest is found in the employment/personal betterment category (26 percent). Finally, among those
Figure 14: Opportunities Provided by Nonprofits to Develop Ties or Contacts Are High across Service Categories (n = 695)
Figure 13: Nonprofits Provide Mostly High or Moderate Opportunities for People to Develop Beneficial Ties or Contacts (n = 695)
reporting no or only slight opportunities for social capital development, the largest proportion is found in the employment/personal betterment category (28 percent) and the smallest proportions are found in the following categories: arts/culture/
humanities, family/youth,and basic needs (12 percent). Overall,more respondents reported a high level of opportunities, indicating that social capital is indeed a benefit provided by nonprofits to this community.
Community Support
Nonprofits provide their services to the community and depend on the
community—residents and businesses—to help fund their activities. Income from private sources such as donations and grants from individuals, foundations, and cor- porations are important sources of funding for nonprofit activity. The survey asked organizations to report the percentage of their income from grants or donations from private sources. Results are shown in Figure 15. The religion category reports
the highest average percentage (70 percent) of income from private sources. The recreation category reports the lowest average percentage (35 percent) of private sources. The educational category shows an interesting finding. The average of 41 percent is the result of a split bet ween those organizations reporting either high (75 percent or more) or low (25 percent or less) reliance on private sources.
Aside from private donations, nonprofits use the community’s resources to fund their activities through earned income from self-generated sources such as program services, other sales, rents, and interest. Organizations were asked what percentage of their income comes from these sources. Figure 16 shows the results. The recre- ation category emerges as relying the most heavily on self-generated sources (58 percent) and the religion category has the smallest proportion (23 percent).
Figure 15: Income from Private Sources Is Important to the Funding of Nonprofits in All Service Categories (n = 669)
The existence of nonprofits in the community allows for contributions to the community’s infrastructure by way of building repairs, additions, or remodeling.
Research by Nunn (2001) on built investments in Central Indiana found that after residential construction,“investment in stores, malls, hotels, and office buildings made up the next largest category of investments, adding about 71 million square feet and nearly $5 billion in total investment” (Nunn 2001, p. 1). Nunn’s data do not allow separation of nonprofit and for-profit investments.
In this survey, nonprofit organizations were asked to report the amount spent on repairs and additions or remodeling in the past year. Altogether, there were 251 organizations reporting dollars for repairs adding up to $42,739,771,and 151 organizations reporting dollars for additions or remodeling adding up to
$113,076,238. Figures 17 and 18 show the breakdown of average dollars expended for building repairs and additions or remodeling by the different categories of non- profits. These can be considered contributions to Central Indiana’s infrastructure.
Figure 17: On Average, Health Nonprofits Spent the Most in One Year on Building Repairs (n = 543)
Figure 16: Indianapolis MSA Nonprofits Also Rely on Self-Generated Income (n =669)
The health category provides by far the largest contribution to the community in these ways. The average expenditure for building repairs is $387,116 and the aver- age amount spent on additions or remodeling is $881,175. The smallest contribution to community infrastructure in terms of building repairs is among organizations in the arts/culture/humanities category, with an average expenditure of $ 1 1 , 3 4 5 . I n terms of additions or re m o d e l i n g, the smallest co ntribution among the org a n i z ations is in the safety /emergency category, with an average of $27,036 spent on additions or remodeling.
Figure 18: On Average, Health Nonprofits Spent the Most in One Year on Additions or Remodeling (n = 487)
NONPROFIT ORGANIZATIONS INTERACT WITH OTHER ORGANIZATIONS FOR MANY PURPOSES
Nonprofits often rely on for-profit organizations, government agencies, and other nonprofits for funding or resources and other cooperative arrangements.
Alternatively, their service activities may compete with other nonprofits or with organizations in the other sectors, thereby promoting a broader choice of services.
It is through these contacts that the nonprofit sector plays a vital role in encouraging partnerships, fostering innovation,and increasing social capital through trust and reciprocity. To assess the extent and importance of these interactions, the survey asked if the organization regularly has contact with other nonprofits, for-profit organizations, or government agencies for any of the following reasons: funding or resources, cooperative arrangements, competitive situations, regulatory issues, or coalitions or task forces.
Contacts between nonprofits and other organizations are extensive. Overall, 73 percent of nonprofit organizations reported at least one type of contact with other nonprofit organizations, 51 percent reported at least one type of contact with for-profit organizations, and 53 percent reported at least one type of contact with government agencies.
A summary of contacts is shown in Figure 19. The nonprofits surveyed have the most interactions with other nonprofits for cooperative purposes (54 percent), followed closely by funding or resources relationships (51 percent). The least interac- tion with other nonprofits concerns regulatory issues (12 percent). Nonprofits have the most interactions with for-profits in the area of funding or resources (44 per- Figure 19: The Most Common Interaction between Nonprofits and Other Organizations Is for Funding or Resources (n = 749)
cent). Only a few report for-profit interactions having to do with regulatory issues (5 percent). For interactions with government agencies, funding or resources, again, are reported most often (39 percent). The smallest numbers of reported interactions with government are in terms of competitive situations (5 percent). Overall,funding or resources is the most common reason for nonprofit interactions with other groups and competitive situations are the least common reason for interaction. Because they imply joint action,for the remainder of this analysis, cooperative arrangements and coalitions/task forces are combined into one category.
Nonprofits Interact Often with Other Nonprofits
Figure 20 provides more details on nonprofit interactions with other nonprofits. It illustrates the interactions between nonprofits and other nonprofits for funding or resources, cooperative arrangements and coalitions/task forces, and competitive sit- uations in each of the ten service categories. These are the three most significant types of interactions for nonprofits with other nonprofits. In terms of funding or resources, organizations in the arts/culture/humanities category interacted the most (68 percent) and those in the religion category interacted the least (36 percent). In terms of cooperative arrangements and coalitions/task forces, organizations in the basic needs category interacted the most (78 percent) and those in the religion cate- gory interacted the least (48 percent). In terms of competition,organizations in the employment/personal betterment category interacted the most (27 percent) and those in the religion category interacted the least (5 percent).
Figure 20: Nonprofit to Nonprofit Interaction through Competitive Situations Is Relatively Low for All Service Categories (n = 549)
Interactions with For-Profits Are for the Same Purposes as Nonprofit to Nonprofit Interactions
Nonprofits also interact with for-profits. Figure 21 shows the interactions between nonprofits and for-profits for funding or resources, cooperative arrangements and coalitions/task forces, and competitive situations in each of the ten service categories.
These are the three most significant interactions for nonprofits with for-profits. In terms of funding or resources, organizations in the arts/culture/humanities category interacted the most (59 percent),and organizations in the religion category interact- ed the least (15 percent). In terms of cooperative arrangements and coalitions/task forces, organizations in the employment/personal betterment category interacted the most (49 percent),and organizations in the religion category interacted the least (9 percent). In terms of competition,organizations in the employment/personal bet- terment category interacted the most (14 percent),and organizations in the religion category interacted the least (1 percent).
Government Agencies Interact with and Affect Nonprofit Organizations Nonprofits also interact with government agencies for various reasons. In addition, nonprofits are affected by government decisions that involve the provision of public services such as welfare. In particular, government often is a resource for nonprofits, offering support in the form of contracts and grants for service provision.
Figure 22 shows the interactions between nonprofits and government agencies for funding or resources, cooperative arrangements and coalitions/task forces, and regulatory issues in each of the ten service categories. These are the three most sig- Figure 21: Nonprofit to For-Profit Interaction through Competitive Situations Is Relatively Low for All Service Categories (n = 379)
nificant types of interactions for nonprofits with government agencies. In terms of funding or resources, organizations in the the basic needs and employment/personal betterment categories interacted the most (both 61 percent),and organizations in the religion category interacted the least (13 percent). In terms of cooperative arrangements and coalitions/task forces, organizations in the employment/personal betterment category interacted the most (55 percent),and organizations in the religion category interacted the least (13 percent). In terms of regulatory issues, organizations in the employment/personal betterment and the health categories interacted the most (both 37 percent) and organizations in the recreation category interacted the least (13 percent). The small proportions found in Fi g u re 22 for religion may be due to the traditional separation between church and state.
Government Support
Of the three possible sources of income listed in the survey, the percentage of fund- ing from government contracts or grants (11 percent) is significantly less than the others, private donations (47 percent) or self-generated income (38 percent). In fact, most of the organizations (84 percent) reported that less than 25 percent of their income comes from government. Two-thirds reported no government funding whatsoever. Only 16 percent reported that more than 25 percent of their income comes from government.
Figure 23 shows the average percent of income from government for each of the 10 service categories. The employment/personal betterment category has the highest average percent of income from government sources (24 percent).
The lowest average percent is in the religion category (1 percent),once again sug- gesting the separation between church and state.
Figure 22: Importance of Nonprofit to Government Interaction through Regulatory Issues Varies across Service Categories (n = 396)
Demand and Welfare Reform
As reported before, 454 nonprofit organizations responded that demand for their services had increased over the last two years (see Figure 2 on page 9). They were then asked:If demand has increased, can you attribute this directly or indirectly to the effects of 1996 federal welfare reform legislation? Figure 24 shows that most organiza- tions did not attribute the increased demand for their services to the welfare legisla- tion (70 percent). Additionally, more respondents were unsure of the effects (21 per- cent) than attributed increased demand for services to the legislation (9 percent).
Figure 25 shows the organizations which indicated that welfare reform had increased demand for their services across categories. Among the 42 organizations which indicated that the demand for their services had increased because of welfare reform,the basic needs and family/youth categories reported increased demand most often. This result is not surprising considering welfare reform would have an effect on organizations that directly serve families. Interestingly, however, organizations in other categories (community, employment/personal betterment, and educational) also indicate increases in demand for services due to welfare reform.
Figure 24: Most Nonprofits Do Not Attribute Increase in Demand for Services to Welfare Reform (n = 445)
Figure 23: Average Percent of Income from Government Sources Ranges from 1 to 24 Percent across Service Categories (n = 669)
Figure 25: Attributing Increased Demand to Welfare Reform Varies across Service Categories (n = 42)
UNDERSTANDING NONPROFITS STRENGTHENS THE SECTOR AND THE COMMUNITY
The nonprofit sector plays an important, though not well-understood, role in the Indianapolis MSA. The results of this sur vey provide an overall picture of the non- profit sector in the Indianapolis area,including the size of the organizations, the demand for their services, finances, organizational age, and contact with other organizations. The analysis of this information illustrates the many ways that non- profit organizations add value to individuals and communities, and provides infor- mation about the relationships among the sectors.
It is evident through information gathered on volunteering, membership, employment, and training that nonprofit organizations provide individuals with useful opportunities to work together, associate, join together to influence com- munity, and enhance their personal growth and enjoyment. Similarly, nonprofit organizations enhance the community by providing services that directly benefit the community, by investing in their physical structures, and by building social capital.
Interactions between nonprofit organizations and other organizations provide opportunities for working together and building social capital,thereby enhancing trust, services, and reciprocity.
This study provides useful information to key constituents in the Indianapolis area (individuals, agencies, business owners, legislators, etc.). It shows the impor- tance of developing not only a clearer picture of the area’s nonprofit sector, but also a better understanding of its functions. Improved understanding of the nonprofit sector will allow communities to make decisions that will better utilize the strengths of the nonprofit sector and encourage actions to further improve the sector.
REFERENCES
Boris, E.(1999). The nonprofit sector in the 1990s. In Charles Clotfelter and Thomas Ehrlich (Eds.),Philanthropy and the nonprofit sector in a changing America(pp. 1–33).
Bloomington,IN: Indiana University Press.
Bowen,W.G.,Nygren, T.I., Turner, S.E.,& Duffy, E.A.(1994).The charitable nonprofits.
San Francisco: Jossey-Bass Publishers.
de Tocqueville, A.[1945(1835)].Democracy in America. New York: Vintage Books.
INDEPENDENT SECTOR.(2001).The nonprofit almanac IN BRIEF–2001. Washington, D.C.: INDEPENDENT SECTOR.
Littlepage, L.(2001).Community participation and perceptions in Central Indiana:
How do we compare?Indianapolis: Indiana University-Purdue University Indianapolis, Center for Urban Policy and the Environment.
Nunn,S.(2001).Patterns of built investment in Central Indiana 1990-99.
Indianapolis: Indiana University–Purdue University Indianapolis, Center for Urban Policy and the Environment.
Salamon,L.(1999).America’s nonprofit sector: A primer. New York: The Foundation Center.
Salamon,L.(2000). The nonprofit sector: For what and for whom? Working Paper.
Johns Hopkins Comparative Nonprofit Sector Project. Baltimore, MD: Johns Hopkins Comparative Nonprofit Sector Project.
Salamon,L.,Anheier, H.,List, R.,Toepler, S.,Sololowki,S.W.,& Associates.(1999).
Global civil society: Dimensions of the nonprofit sector.Baltimore, MD: Johns Hopkins Comparative Nonprofit Sector Project.
Smith, D.H.(1983). The impact of the voluntary sector on society. Reprinted in Brian O’Connell (Ed.),America’s voluntary spirit. Reprinted from Voluntary Action Research, 1973. Lexington,MA: Lexington Books, D.C.Heath & Co.
Van Til,J.(1988).Mapping the third sector: Voluntarism in a changing social economy.
New York: The Foundation Center.
Van Til,J.(2000).Growing civil society: From third sector to third space. Bloomington, IN: Indiana University Press.
APPENDIX
CENTER FOR URBAN POLICY AND THE ENVIRONMENT NONPROFIT QUESTIONNAIRE
Organization: _____________________________________
Respondent/Position/Phone: _____________________________________
_____________________________________
INSTRUCTIONS: If exact figures are not available, good estimates will do.
If you are unable to answer a question,check “Unsure” or place a question mark in the blank.
1. Averaging over the year 2000,what were the numbers of:
Full Time Equivalent Employees: _____________ (assuming a 40-hour work week)
Members: __________
Volunteers: __________ (not counting the board)
People Served: __________ Unduplicated __________ Duplicated (Clients, patients, students, audiences, etc.)
(If none served, please explain________________________________________) 2. In what year was the organization founded? __________
3. Is the organization a grant-making foundation? _____ Yes _____ No _____ Unsure 4. Indicate the types of services or funding your organization provides and rank order them in terms of your organization’s priorities (1 = most important).You may tie ranks if you wish.
a. _____ Arts, Culture, and Humanities (visual,performing, media,historical,facilities) b. _____ Educational (instruction,libraries or facilities, student or other support services) c. _____ Environmental Quality, Protection,or Beautification
d. _____ Animal Related
e. _____ Health (general/rehabilitative, mental health and crisis, disease treatment) f. _____ Crime or Delinquency Prevention
g. _____ Employment Training or Procurement h. _____ Food, Agriculture, or Nutrition
i. _____ Housing or Shelter (development, search,temporary housing, home owners) j. _____ Public Safety, Disaster Preparedness or Relief (flood, fire, search and rescue) k. _____ Recreation,Sports, Leisure, or Athletics
l. _____ Youth Development (boys/girls clubs, adult-child matching, service clubs)
m. _____ Children and Youth Services (adoption,foster care, day care)
n. _____ Family Services (parent education,single parents, family violence, homemaker) o. _____ Personal Betterment (financial counseling, individual development, self help) p. _____ Emergency Assistance (food, clothing, cash,travelers’ aid, victims’ services) q. _____ Residential, Custodial (group homes, hospice, senior continuing care) r. _____ Independence of Specific Groups (seniors, disabled, women,homeless) s. _____ Neighborhood or Community Improvement, Capacity Building t. _____ Civil Rights, Social Action, Advocacy
u. _____ International, Foreign Affairs, or National Security v. _____ Philanthropy,Voluntarism,or Grantmaking w. _____ Science or Technology Research,Social Sciences
x. _____ Public Services (public administration, veterans, utilities, consumer protection) y. _____ Religion or Spiritual Development
z. _____ Other __________________________________________________________
5. For how many years has the organization been located in this neighborhood? _______________
6. Does the organization provide services at more than one location?
_____ No _____ Yes (If Yes, at how many locations are services provided? _______) 7. Estimate the percentage of those that you ser ve who live:
_____ percent within 1 mile of your location _____ percent within 5 miles of your location 8. Over the last two years, has the demand for your services:
_____ Increased _____ Decreased _____ Stayed About the Same _____ Unsure
9. If demand has increased, can you attribute this directly or indirectly to the effects of 1996 federal welfare reform legislation?
_____ Yes _____ No _____ Unsure
10. To what extent does your organization provide opportunities for clients, members, or volunteers to develop ties or contacts with each other that might benefit them or their communities?
_____ None/Slight _____ Moderate _____ High _____ Unsure
11. Does your organization provide formal or informal training for your employees or volunteers?
_____ Formal _____ Informal _____ None _____ Unsure
12.In the past year, about how much did your organization spend on the building you are in:
_______________ for repairs _______________ for additions or remodeling 13.Check if your organization regularly has contact with other nonprofits, for-profit organizations, or
government agencies for any of the following reasons:
Funding or Cooperative Competitive Regulatory Coalitions or
Resources Arrangement Situations Issues Task Forces
Nonprofits _________ __________ _________ ________ ________
For-profits _________ __________ _________ ________ ________
Government _________ __________ _________ ________ ________
Other Reasons for Contact: _____________________________________________________________
14. What were the following for the last fiscal year?
Income $_______________
Operating Expenditures $_______________
Capital Fund (if any) $_______________
Dates of Fiscal Year Used ________________
15. What percentage of total income did you receive from the following sources last fiscal year?
Donations/grants from private sources (individuals, foundations, corporations, etc.) ______ percent
Contracts or grants from government agencies ______ percent
Self-generated income (program services, other sales, rents, interest, etc) ______ percent