A dissertation submitted in fulfillment of the requirements for the degree of Master of Engineering or Energy Technology. The Graduate School, Prince of Songkla University has approved this thesis in fulfillment of the requirements for Master of Engineering Degree in Energy Technology.
LIST OF TABLES
LIST OF TABLES (CONT’D)
NOMENCLATURE AND ABBREVIATION
INTRODUCTION
- Significance of the study
- Objective
- The Scopes of the study
- The Anticipated results
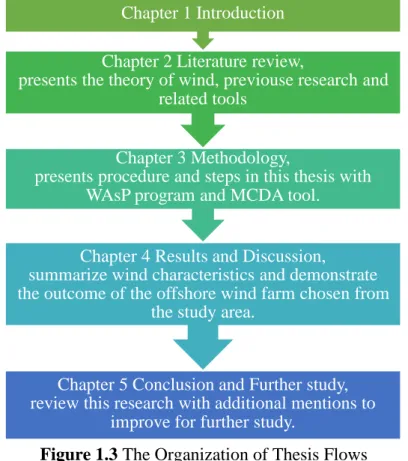
- Organization of Thesis
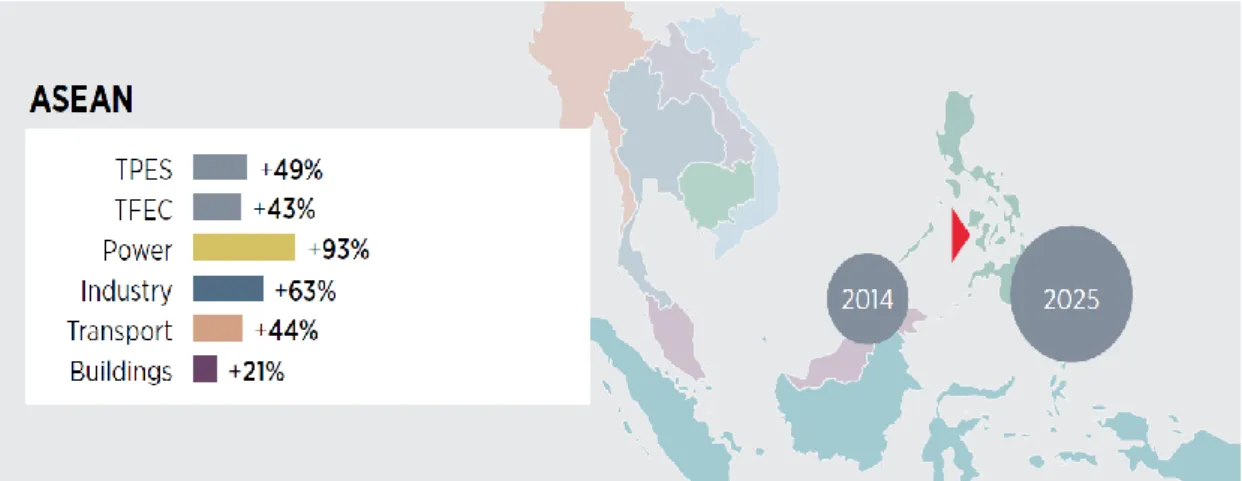
Gulf of Thailand wind estimate and wind data should be updated. In this study, the assessment of wind resources in the Gulf of Thailand was focused by collecting raw meteorological data for 4 years from 2017-2020 along the coastlines of the eastern side of Thailand to predict the average wind speed, wind energy distribution , the frequency distribution of the wind. , Weibull parameters and analyze a wind map using WAsP.
LITERATURE REVIEW
Wind Resources
- Wind characteristics
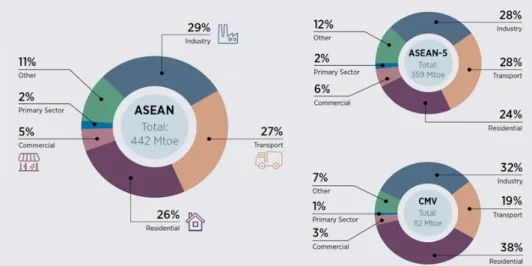
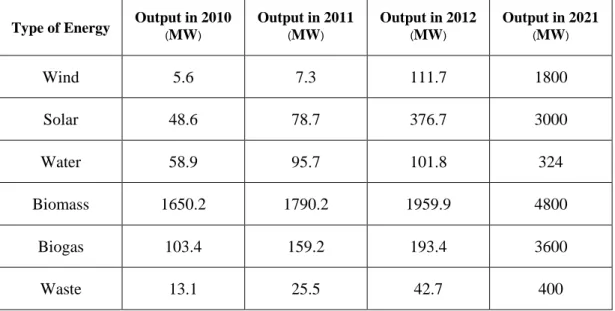
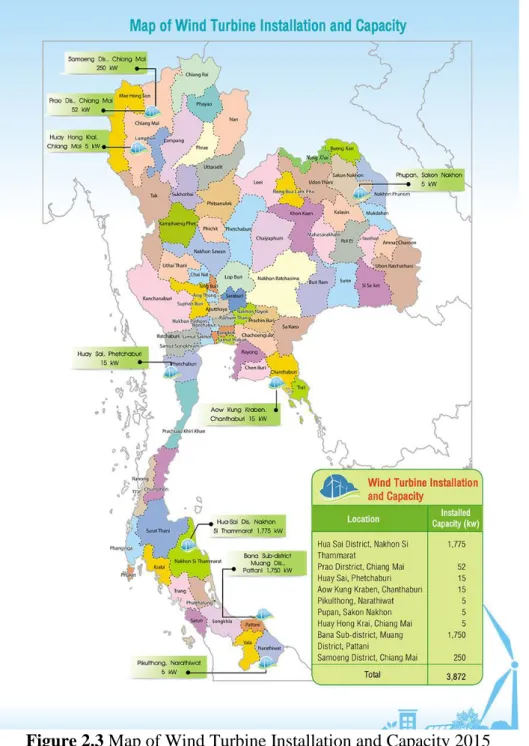
- Wind energy in Thailand
- Seasonal wind in Thailand
- Wind Assessment
- The Beaufort Scale
- Wind power classification
- Wind Rose Distribution
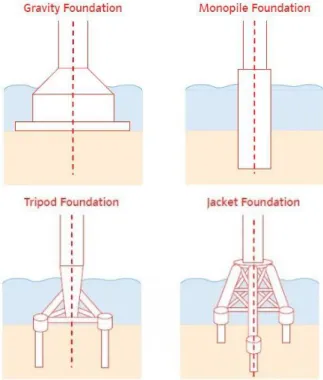
- Offshore Wind farm
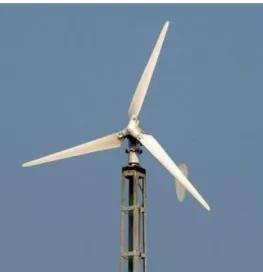
The wind data is then sorted by wind direction to calculate the percentage of time each direction was blowing. The weight of the blade in Figure 2.5 requires considerable support for the construction of this type of turbine.

Related theory
- Air density
- Wind speed distribution
- Various height wind speed
- Analysis energy of wind power [53]
- WAsP Program [50]
- Multi Criteria Decision Analysis (MCDA)
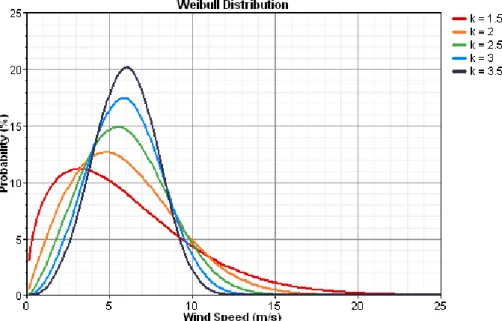
The wind speed can be expressed using the Weibull distribution function, which is a two-parameter function [29]. The wind speed at the height of hub interested in power application, the available wind speed needed to measure at the hub height of the wind turbine. A wind turbine's annual energy production (AEP) is the total amount of electrical energy it produces in a year, measured in kilowatt hours or megawatt hours (kWh or MWh).
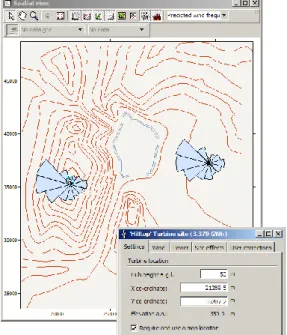
The power from the power curve for each wind speed is estimated by multiplying the power from the power curve by the frequency distribution of wind speeds encountered by the wind turbine and the number of hours in a year. The overall AEP of a wind farm can then be calculated by summing the AEPs of each wind turbine. WAsP is a computer software for complete data analysis and performed for wind climate forecasts, wind resources and wind turbine power generator [37] and to determine wind conditions at the weather station.
To calculate the wind farm's productivity WAsP, estimate the wake losses for each turbine in the park and thus the annual net energy production for each wind turbine and the park as a whole in figures 2.9-2.10. A 'virtual' wind turbine site can be moved across the terrain using the mouse or by entering its coordinates and wind conditions and estimated electricity. Wind Power Potential is calculated by estimating the average annual energy production (AEP) for a wind turbine and giving WAsP the wind turbine's power curve in figure 2.12.
Identify Potential Alternatives
Multi-criteria decision analysis or multi-criteria decision making (MDDM) is a sub-discipline of operations research that explicitly considers multiple criteria in decision-making environments. The Analytic Hierarchy Process (AHP) is a multi-criteria decision analysis method originally developed by Thomas L.
Identify the Problem and Criteria
Step 3: Use Pairwise Comparison to Determine Priority Among Criteria [13]
The Analytic Hierarchy Process (AHP) is a multi-criteria decision analysis method originally developed by Thomas L. Saaty in the 1970s.. method that considers with both qualitative and quantitative information to assess the criteria weights as the following steps: [32]. The scale, which assigns values from 1 to 9, determines the relative importance of one option compared to another, as shown in Table 2.5.

Finding weight of criteria
Identification of Consistency Ratio: C.R
- Related literature review
- Research gap
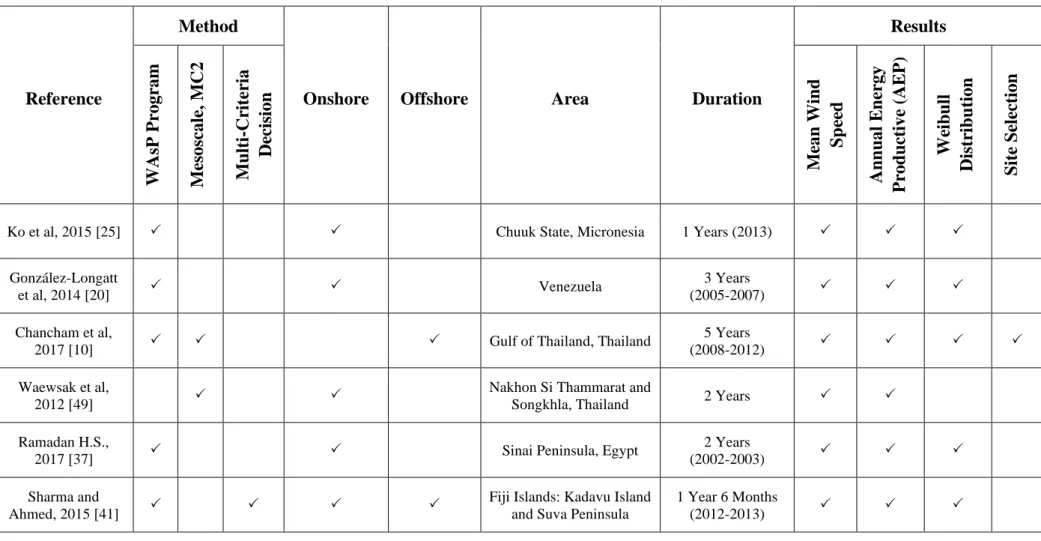
A comparison of related literature, as shown in Table 2.7, shows the methods and results in each previous research. Various studies on wind resource assessment and wind data collection have been conducted in different countries. This study will improve on the previous environmental impact study with MCDA on offshore wind farm site selection.
And in this study various wind data from Thai meteorological mast and updated data are collected. And in Thailand there were study areas from the Gulf of Thailand for 5 years, [10] Nakhon Si Thammarat and Songkhla for 2 years. 49] However, previous studies collected wind data that were quite old, so in this study they used wind data from 2017 to 2020 for four years, which is different from previous MCDA methods [41] [4].
24] using Analytic Hierarchy Process (AHC) tools to analyze wind farms with a number of criteria for optimal wind farm in the Gulf of Thailand. In this study, the WAsP program was used in most of the studies to analyze the wind data as average wind speed, power density and Weibull distribution with an additional method to select the optimal wind farm through Multi Criteria Decision Analysis (MCDA). This study is a further study of the previous Offshore Wind in the Gulf of Thailand study which used the Mesoscale, MC2 method on offshore wind farms in Thailand.
METHODOLOGY
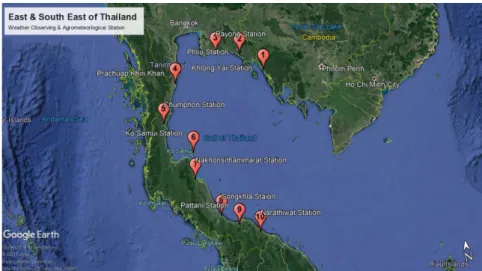
- Khlong Yai Station [47]
- Phliu Station [45]
- Prachuap Station [43]
- Koh Samui Station [43]
- Songkhla Station [42]
- Narathiwat Station [43]
- Territorial water
- Military areas
- Aircraft route
- Pipelines and Cable
- Social Impact
- Environment Impact
- Sea depth
- Analytic hierarchy process: AHP
- Sitting wind assessment and analysis
The Phliu Automatical Weather Station (AWS) is located at the Phlew Agrometeorological Observations Group, Khlung District, Chantaburi Province. Source: Chantaburi Meteorological Station Information, 2019) 3. Rayong Automatical Weather Station (AWS) is located at Rayong Meteorological Station, Muang District, Rayong Province. Source: Rayong Meteorological Station Information, 2019). Prachuap Automatical Weather Station (AWS) is located at Prachuapkhirikhan Meteorological Station, Prachuapkhirikhan Province. Source: http://www.aws-observation.tmd.go.th) 5.
Chumphon Automatical Weather Station (AWS) is located at Chumphon Meteorological Station, Chumphon Province. Source: http://www.aws-observation.tmd.go.th). Samui Automatical Weather Station (AWS) is located at Koh Samui Meteorological Station, Koh Samui District, Suratthani Province. Pattani Automatical Weather Station (AWS) is located at Pattani Meteorological Station, Nongchik District, Pattani Province. Source: http://www.aws-observation.tmd.go.th).
Narathiwat Automatic Weather Station (AWS) is located at Narathiwat Meteorological Station, Muang District, Narathiwat Province. Source: http://www.aws-observation.tmd.go.th) 3.2 Wind potential analysis. For site selection in this study, the main applicable decision criteria included territorial water, sea depth, military areas, aircraft routes, pipelines and cables, social impacts and environmental impacts, shown in Figure 3.15. Wind resource maps were needed to provide vector maps, derived from the Elevation Maps (Figure 3.17) and Roughness Maps (Figure 3.18) in the WAsP Map Editor tool.
RESULT AND DISCUSSION
Wind Potential Analysis of the Gulf of Thailand (GoT)
Khlongyai Station
Phliu Station
Rayong Station
Prachuap Khiri Khan Station
Chumphon Station
Koh Samui Station
Nakhon Si Thammarat Station
Songkhla Station
Pattani Station
Narathiwat Station
- Site Selection for offshore wind farm
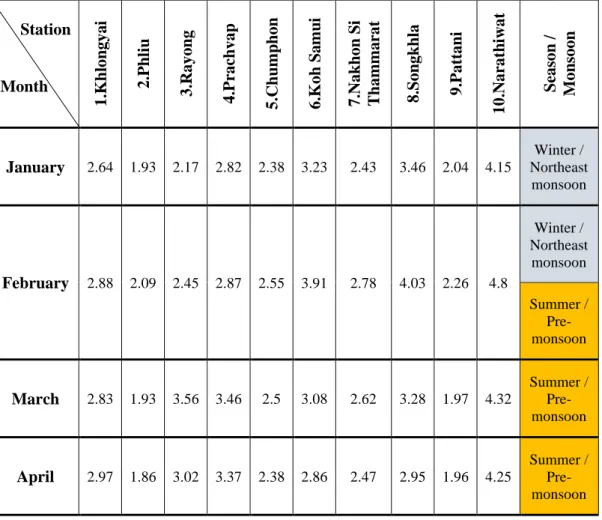
The monthly average wind speed with an average of 4 years is shown in table 4.12 and figure. The results showed that almost all wind data was insufficient to provide power in some months, but average wind data was interesting at Rayong, Prachuap, Songkhla and Narathiwat stations. The winter or northeast monsoon season starts from mid-October to mid-February. Especially from October to November there was a lot of rain in the Gulf of Thailand.
Summer or pre-monsoon starts from mid-February to mid-May. The rainy or southwest monsoon season starts from mid-May to mid-October. In the Gulf of Thailand there will be enough rain from now until the end of the year.
From the season and monsoon in the table, it is clear that the Gulf of Thailand is affected by the direction of the monsoon. As a result, the wind value may fluctuate according to the nature of the incoming monsoons. In this section, the criteria decision was followed up and the Analytic hierarchy process (AHP) method was used to score and find the suitable location for the wind farm.
Territorial Water
Aircraft Routes
Social Impacts
Environment Impacts
Sea Depth
- AHP Results
- Wind assessment analysis for selected sites
- The First wind farm selected site
- The Alternative wind farm selected site
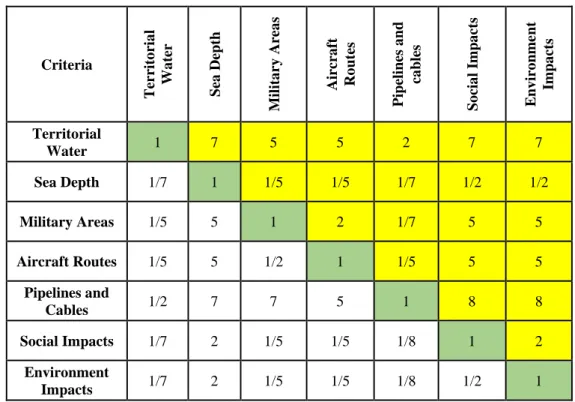
The results of the pairwise comparison matrix for the territorial waters indicated Consistency Ratio (C.R.) = 0.05, which was accepted. The results of the sea depth pairwise comparison matrix indicated Consistency Ratio (C.R.) = 0, which was accepted. The results of the pairwise comparison matrix for the military areas showed Consistency Ratio (C.R.) = 0.03, which was accepted.
The results of the pairwise comparison matrix for the aircraft routes revealed the consistency ratio (C.R.) = 0.02 which was accepted. The results of the pairwise comparison matrix for social influences showed consistency ratio (C.R.) = 0.01 which was accepted. The results of the pairwise comparison matrix for environmental impact showed consistency ratio (C.R.) = 0.13 which was accepted.
The selection weight was calculated from the summary of the criteria weights multiplied by the eigenvector at each wind farm location. The location of the wind farms, the row and the column of the wind farms in the selected areas differed from the nature of the coast. Wind directions, wind farm location and area map were obtained from Google Earth Pro as shown in Figure 4.18.
CONCLUSION AND FURTHER STUDY
Conclusions
The wind direction was from the 240° South-Southwest (SSW) direction at both locations, but calmer winds at the Narathiwat location. The turbine alignments at the Narathiwat site were in 2 rows and 14 columns, but at the Prachuap Khiri Khan site they were in 4 rows and 7 columns with more turbulence in wake loss, which can help reduce uce by separating the wind turbine space into rows with 5D and 10D in column. The 200 m high-resolution wind map with 50×50 km2 showed that there was more wind value energy in all assessments mean wind power, power density and AEP, which means that more distance from the coast was better for the wind values.
The most optimal and suitable offshore wind farm in the Gulf of Thailand in this study was the Narathiwat site, with the highest wind potential and annual energy product located in the south of Thailand. The Prachuap Khiri Khan site was an alternative wind farm selected site with partial criteria conflict, but the location is located in the middle of Thailand, which means it needs more study to determine its worthiness for investment or for installing electricity networks . further study.
Further study
9] Cengage The Gale Encyclopedia of Science “Seasonal Winds.” November 2002, https://www.encyclopedia.com/science/encyclopedias-almanacs-transcripts-and-maps/seasonal-winds-1/ (accessed August 18, 2021). 34; Critical assessment of the current status of wind energy in Thailand. Renewable and sustainable energy assessments. 14] Ministry of Alternative Energy Development and Efficiency Ministry of Energy "Wind Characteristics in Thailand" December 2015.
34;Evaluation of the WAsP Wind Resource Estimation Program for Offshore Applications." Journal of Wind Engineering and Industrial Aerodynamics. 34;Investigation of Wind Properties and Assessment of Wind Energy Potential for Waterloo Region, Canada." Energy turnover &.