To the JPL Spectroscopy Group, thank you for sharing your wealth of knowledge about rotational spectroscopy. And thank you Leticia Calderon for keeping track of all of us (and all our gear) in the Blake Group.
Prebiotic Interstellar Chemistry
There are two possible mechanisms for the formation of these molecules, the first being that a number of prebiotic species were formed before our planetary system was assembled, integrated into planetesimals and introduced to Earth through interplanetary dust and comet or meteorite impacts. More complex prebiotic chemistry could then follow in the mother body, where the products are ultimately delivered to the early Earth through impact.
Grain Surface and Hot Core Chemistry
Current models assume that species such as alcohols and aminoalcohols undergo gas-phase reactions in hot nuclei to form more complex prebiotic species. The most likely route to amino acids in the ISM is gas-phase ion-molecule reactions.
![Figure 1.1: Schematic diagram of a hot core, adapted from [1]. The indicated size scale is that appropriate for a hot core surrounding a high mass protostar](https://thumb-ap.123doks.com/thumbv2/123dok/11219512.0/24.892.178.763.223.555/figure-schematic-diagram-adapted-indicated-appropriate-surrounding-protostar.webp)
Thesis Overview
Detailed laboratory and observational investigations of both the predicted grain surface precursors and more complex prebiotic species are clearly needed before we can understand interstellar prebiotic chemistry. The implications of the results of these studies for the surface chemistry of interstellar grains will be discussed in Chapter 8.
Spectroscopic Techniques
Pulsed Fourier Transform Microwave Spectroscopy
This technique is much more sensitive than standard direct absorption experiments due to the superheterodyne detection and the high finesse of the cavity. Linewidths are limited by Doppler broadening and Doppler splitting due to the angular distribution of the molecules as they enter the cavity.
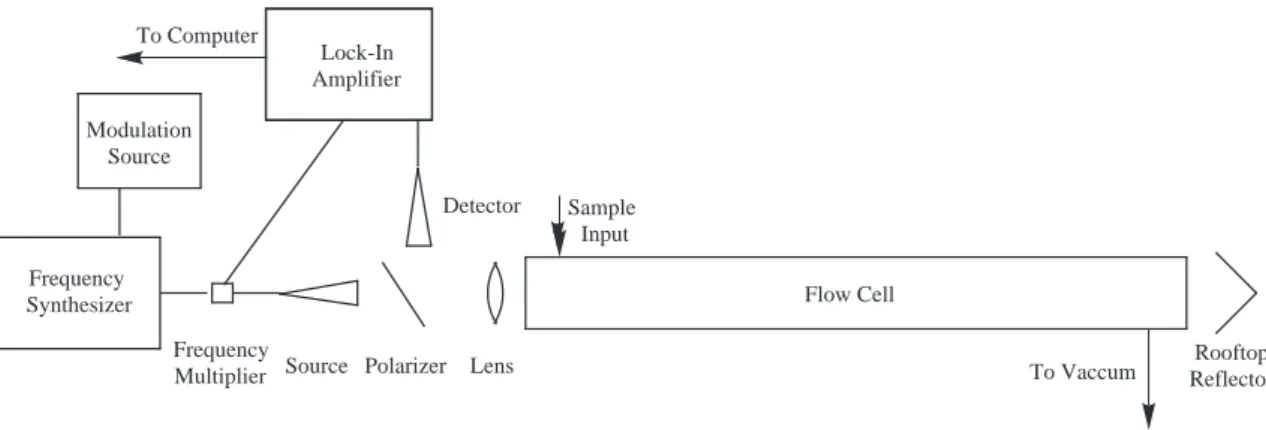
Direct Absorption Flow Cell Spectroscopy
The molecules present in the flow cell absorb this radiation as it passes through the cell, and the dual-pass nature of the setup increases the amount of absorption and thus the signal-to-noise ratio. For example, ~55% of the lines observed in the recent 3 mm survey of the Sgr B2(N-LMH) source remain unidentified [4].
Observatories
Aperture synthesis observations are also required so that the spatial extent of the emission can be determined and appropriate beam dilution corrections can be applied.
Column Density Calculations
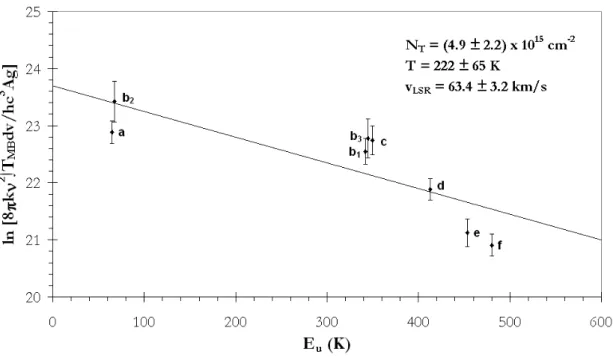
- Rotation Diagrams
- Integrated Intensities
- Line Strengths
- Molecular Partition Functions
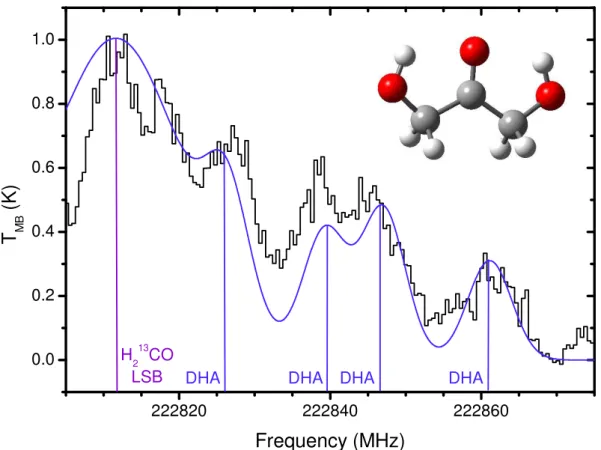
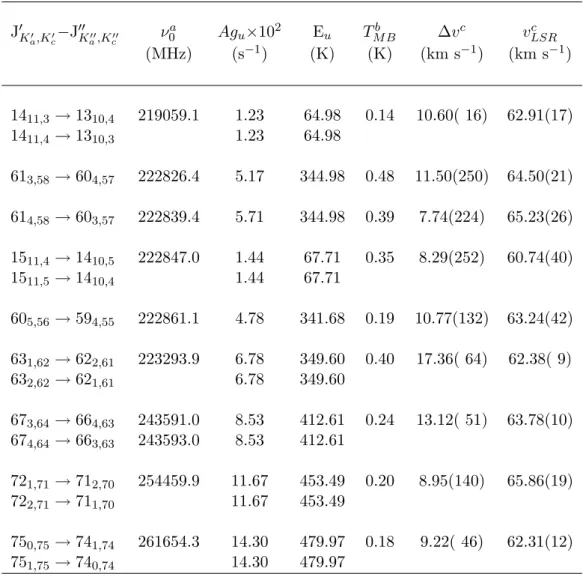
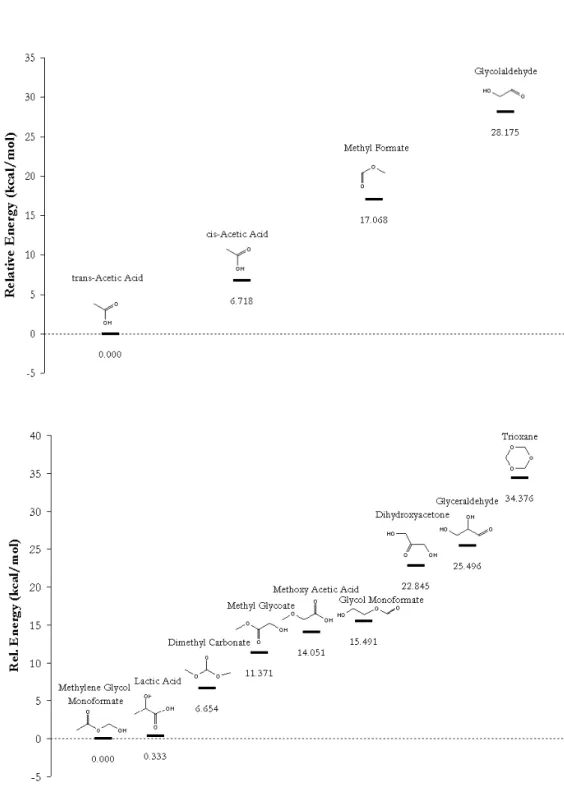
The line strength in terms of the Einstein A-coefficients multiplied by the degeneracy of the upper state (Agu) for a given transition can be calculated from the information provided in the .cat files associated with the JPL CALPGM program. The relative energies of the 3C sugars indicate that dihydroxyacetone is more likely to survive hot-core conditions than glyceraldehyde.
Ab Initio Studies
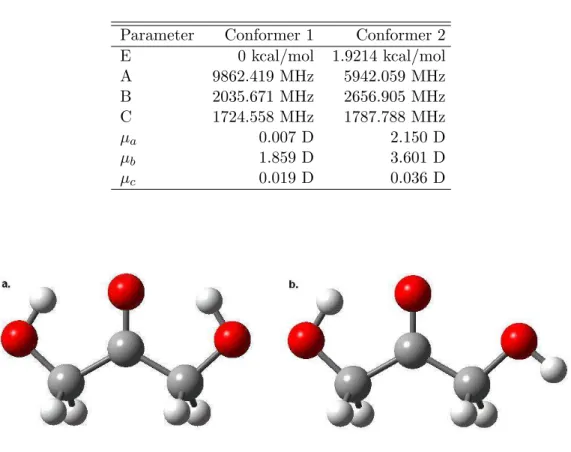
Separate conformers could be distinguished by unique values for the dipole moments, and approximately ten possible geometries were optimized for each of the lowest four conformers. The non-zero µa and µc values obtained in our study for this conformer are therefore unexpected and are likely artifacts of the averaging approach used to determine the parameters of each structure.
Spectroscopic Studies
- Experimental
- FT-Microwave Studies
- Direct Absorption Millimeter and Submillimeter Studies
- Data Analysis
- Discussion
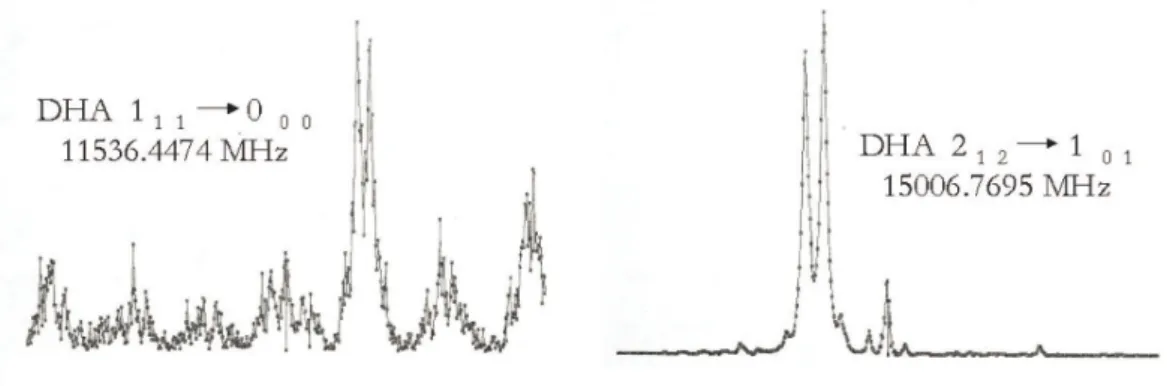
Again, averaging was not required since the errors due to the time constant of the lock-in amplifier were smaller than the spectral resolution. Since no vibrational spectral studies have been performed for the torsional states of dihydroxyacetone, assignments of the vibrational state energies were based on the relative intensities of the observed lines to those from the ground state.
Observational Studies
- CSO Observations
- Observations
- Results
- OVRO Observations
- Observations
- Results
- GBT Observations
- Observations
- Results
- Discussion
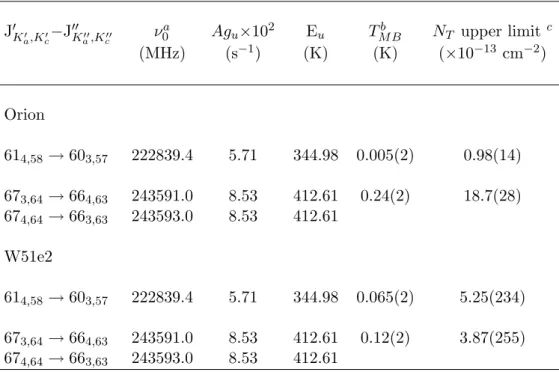
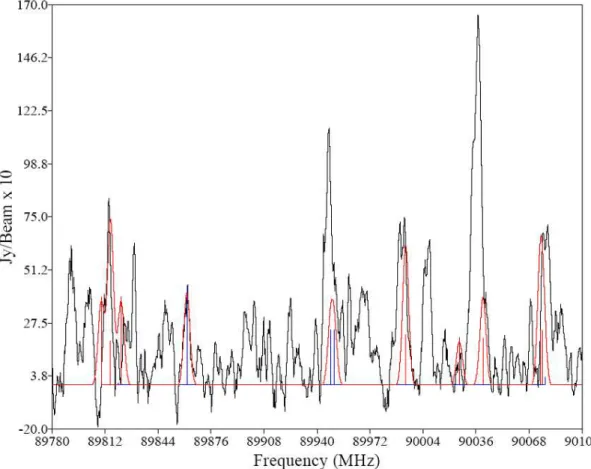
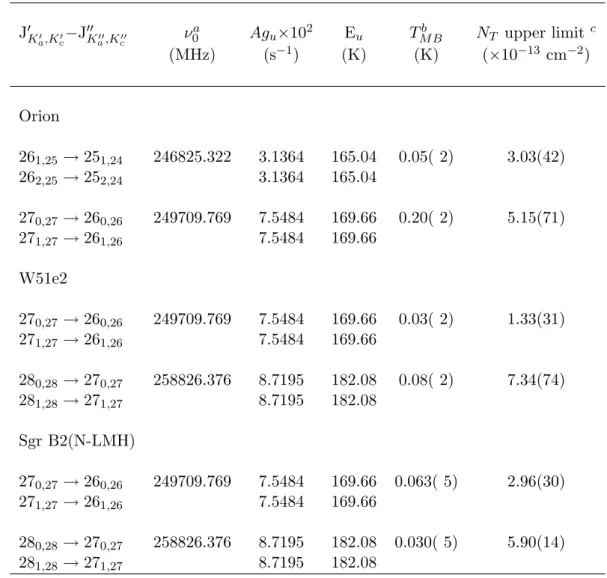
The absence of dihydroxyacetone lines in the OVRO spectra does not further corroborate the CSO observations. The dihydroxyacetone lines observed in the Sgr B2(N-LMH) source are not present in the Orion and W51e2 spectra obtained with the CSO.
Introduction
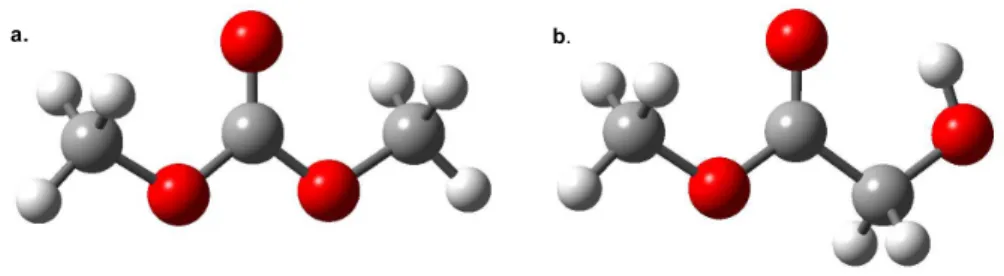
Dimethyl carbonate is a symmetric double internal rotor, while methyl glycolate is an asymmetric single internal rotor (see Figure 5.1). The spectrum of methyl glycolate is much more complex than that of dimethyl carbonate due to its asymmetry.
Spectroscopic Studies
- Experimental
- FT-Microwave Studies
- Direct Absorption Millimeter and Submillimeter Studies
- Data Analysis
- Dimethyl Carbonate
- Methyl Glycolate
- Discussion
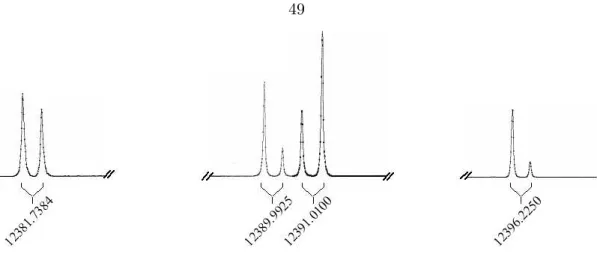
The input to the CALPGM program set is in the internal axis frame, but the input structure can be rotated to the proper axis system (i.e., the rotated axis method), and thus the principal axis system can be used. Weak satellite lines were observed near many of the stronger dimethyl carbonate lines in the FTMW survey.
Observational Studies
A direct comparison of these two molecules therefore requires that the contributions of the vibrational state to the molecular partition function of glycolaldehyde are also determined. If populated, these states could contribute significantly to the molecular partition function in a hot core environment.
Spectroscopic Studies
Experimental
Data Analysis
The relative intensities of the excited vibrational state lines to the ground state lines are dependent on the dipole moment and the vibrational state energy. The ground state dipole moments determined in the microwave study were used for all predictions and vibrational state assignments.
Discussion
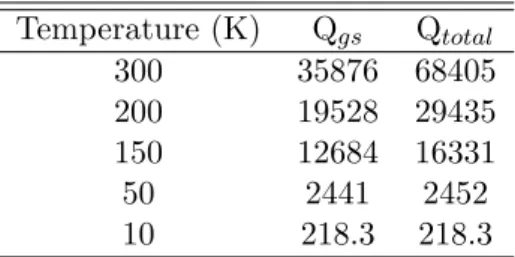
The partition function values in Table 6.2 are calculated assuming that the vibrational and rotational excitation temperatures are the same, which is often the case for hot cores [56, 64]. The results presented here demonstrate that excited vibrational states at this temperature make a significant contribution to the molecular partition function.
Spectroscopic Studies
Experimental
Data Analysis
The ground state assignments were initially performed and in addition to the standard rotation constants, quartic and sextic centrifugal strain constants were also determined. A total of 528 lines are assigned to the ground state with a microwave RMS of 84 kHz.
Discussion
The rotational and quartic centrifugal strain constants were determined independently for each vibrational state, while the sextic strain constants were determined in a global fit to all vibrational levels and the ground state. A separate fit of the ground state, allowing the adjustment of the sextic strain constants, was performed and the results compared with those obtained in the global fit.
Observational Studies
CSO Observations
- Observations
- Results
A linewidth of 10 km/s and a spin temperature of 100 K, values found for methyl cyanide in the W51e2 source, were assumed for the W51e2 calculations [42]. A linewidth of 10 km/s, the approximate linewidth observed for dihydroxyacetone in the Sgr B2(N-LMH) source (see Section 4.4 ), and a spin temperature of 200 K, at most.
OVRO Observations
- Observations
- Results
Boxcar fits to an internal noise source modified by second-order polynomial fits to observations of the quasars were used for bandpass calibration. No transition was observed in any of the sources, and therefore column density upper limits were calculated as described for the CSO observations.
Discussion
A summary of the results of these studies and a discussion of their implications and future applications are presented below. The ground and first four vibrational states of the 3C ketose, dihydroxyacetone, are now characterized up to 450 GHz.
Observational Astronomy
The extremely large abundance of 3C species compared to much simpler species, together with the lack of observational evidence for one of the simplest predicted surface grain species, indicates that current models of interstellar chemistry require extensive revision. These pathways are compared with existing chemical models below, and their implications in light of the conclusions drawn from the work presented here are discussed.
Implications for Interstellar Chemistry
Proposed Grain Surface Chemical Network
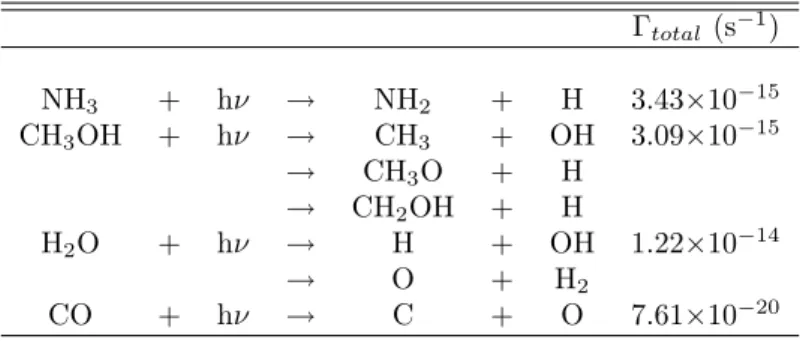
While most of the photolysis products listed in Table 8.1 have been included in previous models, reactions involving CH3O were not considered in any but the original model by Allen and Robinson [12], and in this case only consider the simplest reactions. Dense clouds are typical at 10 K, and the photolysis products listed in Table 8.1 are mobile on grain surfaces at this temperature.
Determination of the Rate Constants
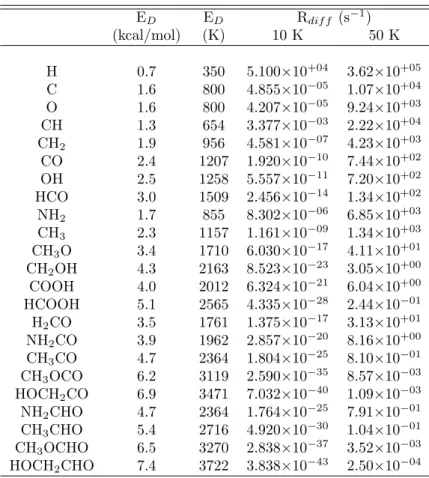
The diffusion barriers from references [12] and [69] were used to determine the diffusion rates at 10 and 50 K for the photolysis radicals as well as aldehyde radicals, and these values are presented in Table 8.6. The reaction rates at 10 and 50 K were calculated from this information and are presented in Tables 8.2–8.5.
Discussion
The photolysis products presented in Table 8.1 are clearly important in the formation of compounds such as methyl formate and glycolaldehyde as well as all the 3C compounds, and therefore their reactions should definitely be included in grain surface models. H addition reactions dominate the grain surface chemistry at low temperature and form simple species such as water, methanol and formaldehyde.
Future Work
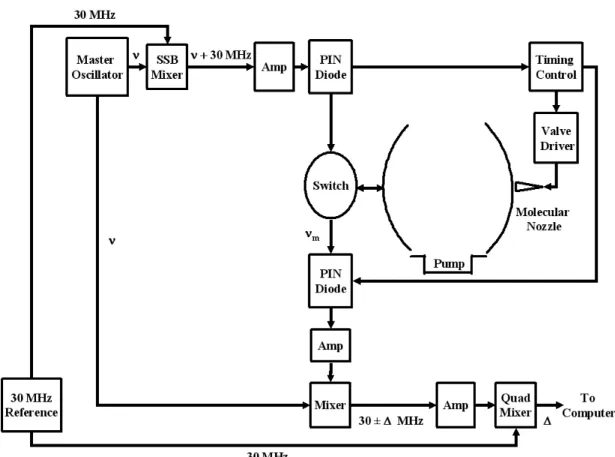
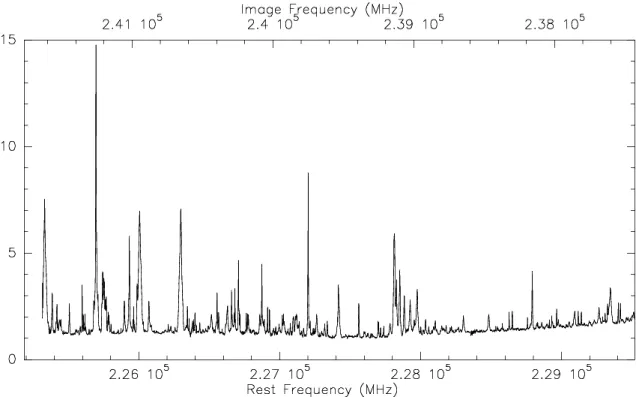
A double sideband spectrum of the Orion Compact Ridge, the first result of this study, is shown in Figure 8.2. The switch in the detector closes when a microwave pulse is fired, and this switch remains closed until most of the radiation in the cavity has subsided.
Instrument Control System
The 'scope' output signal from the interface box is identical to the microwave output signal and is the trigger used by the oscilloscope to monitor the cavity setting. One of the mirrors can be moved so that the cavity is tuned to the MO frequency.
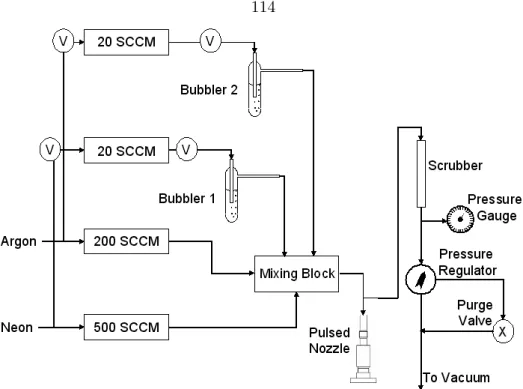
Gas Handling and Sample Delivery
The tube is inserted so that it is as close to the valve as possible without forming a complete seal. The valve consumes gas when it runs; the excess gas flows around the end of the tube and back through the valve assembly.
Valve Assemblies
This regulator is a diaphragm that has a control valve that can be used to adjust the pressure in the line and thus regulate the valve back pressure. The valve assembly is placed against this Plexiglas tube and placed at one of the gate valves.
Heated Sample Holder
This part can slide freely along the length of the pipe until the UltraTorr fitting is tightened. A plexiglass tube forms an O-ring seal with the chamber at one end and with this circular part at the other end.
Spectrometer Startup Procedure
The position of the MO frequency is indicated in the complex FFT display by the yellow line. The program will prompt "Enter filename [path]cccccc.nnn>." The file name must be entered here (ie 'dha.001').
Instrumentation
Spectrometer Startup Procedure
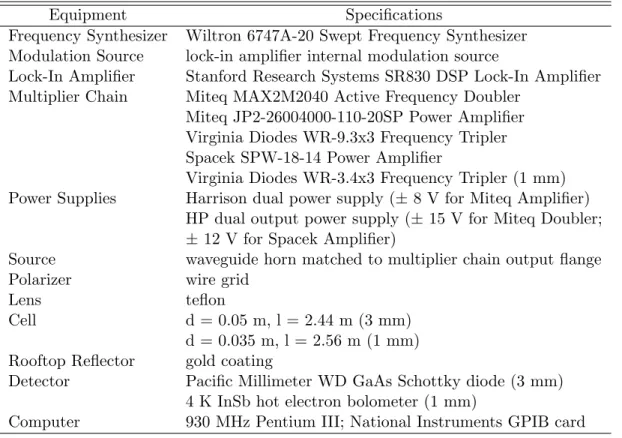
Lock-in amplifier Stanford Research Systems SR830 DSP Lock-in amplifier Multiplier Chain Miteq MAX2M2040 Active frequency doubler. Before beginning an experiment, one of the lock-in amplifier settings must be changed to establish communication between the computer and the lock-in.
Spectrometer Parameters
The lock-in amplifier phase setting must be set manually on the front panel of the instrument. The lock signal is set to either "R" (for power scans) or "X" (for spectral scans).
Spectrometer Alignment Procedure
The file in which the spectral data is recorded is set by clicking the 'filename' button and selecting the desired folder and file name. Channel One' on the include with a voltmeter and carefully align the roof (the tilt stage is the most important adjustment here).
Spectral Acquisition Procedure
When the maximum value is found, pressing the +/- 90 degree buttons should reduce the signal to noise level. Once the optimal parameters for a given experiment have been found, return to the main screen and start a large scan.
Sample Pressure and Temperature Regulation
The carrier gas line must be connected to the diffuser inlet and the diffuser outlet must be connected to the cell. Fixed samples should be placed directly into the cell by removing the end cap near the source (be careful with the polarizer while doing this).
Spectral File Format
This information is then used to generate a set of parameters for the Hamiltonian of the internal axis system using the program IAMCALC. The SPFIT program is then used to calculate a new set of parameters after spectral assignments are made.
The Submillimeter Analysis Program
Course and fine adjustments can be used to scale the intensity of the predictions against the spectral data. The forecast is displayed as a bar spectrum until the toggle button is changed from “None” to “Trimmed” or “Full.” The trimmed option loads only the predicted spectral features in the window shown on the screen, while the full option loads the entire forecast.
Z-Matrices
Dimethyl Carbonate .par File
Dimethyl Carbonate .lin File
Caltech Direct Absorption Flow Cell Spectrometer Instrumentation
Optimized parameters for flow cell experiments
The 2C structural isomer parameters determined by Gaussian 98 MP2 6-
The 3C structural isomer parameters determined by Gaussian 98 MP2 6-
Methyl Formate Z-Matrix
Glycolaldehyde Z-Matrix
Methylene Glycol Monoformate Z-Matrix
Lactic Acid Z-Matrix
Dimethyl Carbonate Z-Matrix
Methyl Glycolate Z-Matrix
Methoxy Acetic Acid Z-Matrix
Glycol Monoformate Z-Matrix
Glyceraldehyde Z-Matrix
Trioxane Z-Matrix