SIMON: A DISTRIBUTED REAL-TIME SYSTEM FOR CRITICAL CARE PATIENT MONITORING AND EVENT DETECTION
By
Karlkim Suwanmongkol
Thesis
Submitted to the Faculty of the Graduate School of Vanderbilt University
in partial fulfillment of the requirements for the degree of
MASTER OF SCIENCE in
Electrical Engineering August, 2001 Nashville, Tennessee
Approved:
Dr. Benoit Dawant Dr. Gabor Karsai
ACKNOWLEDGEMENTS
I would like to express my gratitude to my academic and research advisor, Dr. Benoit Dawant for his determined support, encouragement, and guidance within and beyond the scope of this research project since I came to Vanderbilt University. Special thanks to my good friend and outstanding team member Patrick Norris for his tireless assistance to me and strong
contributions to this project. Without their assistance and the regular discussions we had, the project would not have been at this stage. I appreciate Dr. Gabor Karsai for his excellent classes inspiring countless ideas to me, our fruitful discussions, and his precious time to be a second reader for this work. Further thanks go to Dr. Dan Lindstrom and the Neonatology Division of the Pediatrics Department for their financial support during the first two years. I thank Dr.
Antoine Geissbuhler and Dr. John Morris for contributing their ideas and expertise to the project.
Many thanks to Eric Manders for providing help with the legacy code and the equipment, Russ Waitman for his suggestions about the HPDA component, fellow Thai students, P’Pinij, P’Suchart, P’Siam, P’JJ, Arnon (fat C), and Putthipong (skinny C), who provided initial
technical help and knowledge. I also thank all the other members of the Image Processing lab for providing a friendly atmosphere at work
My beloved mom, dad, and brother deserve tremendous credit, more than any words could express, for their love and care despite the geographic distance for many years. I sincerely appreciate my grandma, Gregoria P. Ignacio, my granduncle, Bernardo T. Pedere, and uncle Jim, James Reese, who always supported me since I came to the USA. Finally, I would like to thank all my friends and well-wishers who, knowingly or unknowingly, provided me with all the help I needed to complete this work.
TABLE OF CONTENTS
Page
ACKNOWLEDGEMENTS... ii
TABLE OF CONTENTS... iii
LIST OF FIGURES ... v
LIST OF TABLES... vi
Chapter I. BACKGROUND AND INTRODUCTION ... 1
SIMON... 2
Prior Architecture... 3
Revised SIMON Architecture... 6
II. DATA LAYER ... 9
Functionality in the Data Layer ... 9
Design Decision ... 10
DataServer... 11
Data Collection Components ... 15
Web-based User Interfaces ... 17
Data Storage and Management components... 21
III. CURRENT TASK LAYER ... 24
Introduction... 24
Workings of the ADC ... 25
Implementation ... 27
Generating alarms ... 28
IV. REVISED TASK LAYER... 31
Design Decision and Architecture ... 32
Single-Source Event Level (SSE Level)... 35
Multi-Source Event Level (MSE Level)... 39
Notification Level ... 43
V. CONCLUSIONS... 45
Data Layer... 46
Task Layer ... 47
Result and Current Status... 48
Future work and Discussion... 50
Appendices A. COMPLETE LIST OF SIMON PARAMETER... 53
B. SIMON SYNTAX... 55
REFERENCES ... 60
LIST OF FIGURES
Figure Page
1. Architecture of SIMON-RTS... 4
2. SIMON-WEB system architecture ... 5
3. The architecture of the SIMON system as fielded in the CCU... 6
4. The Revised SIMON multi-layer reference architecture ... 7
5. The Data Layer and various components... 12
6. The Data Layer data flow diagram ... 13
7. Web-based User Interfaces architecture with DataServer and Web Client ... 18
8. Simon-Trauma web site showing ART graph plotted over 24 hours. ... 19
9. SIMON-Note user interface... 20
10. Data Storage and Management architecture with DataServer ... 21
11. Class diagrams of important classes in the ADC... 27
12. Possible sequence of data... 28
13. Discontinuous sequence of data... 29
14. State diagram that shows how alarms are generated ... 30
15. The Task Layer architecture with three separated levels and client applications... 34
16. The CSSEManager and its interfaces ... 37
17. UML class diagram of the SSEObject, GreaterObject and LessObject... 38
18. UML class diagram of the MSEObj, ExprObj, BoolObj, and SSETypeObj... 41
19. A sample of string and tree for multiple parameter event expression. ... 43
20. Tree of Expression ... 58
LIST OF TABLES
Table Page
1. ArchiveClient file... 22 2. Results of an event information detecetd in the first two-month period... 50
CHAPTER I
BACKGROUND AND INTRODUCTION
In the critical care unit, the real time monitoring of patients is an essential task. Patient Monitoring can be defined as: “Repeated or continuous observations or measurements of the patient, his or her physiological function, and the function of the life support equipment, for the purpose of guiding management decisions, including when to make therapeutic interventions, and assessment of those interventions” [1]. Thus, patient monitoring and management involve determining status of the patient, responding to events that may be life threatening, and taking actions to bring the patient to a desired state.
New bedside medical devices provide health care professionals with unsurpassed amounts of information for decision-making support. In addition to information provided by these bedside devices, health care professionals also rely on information such as laboratory data or demographic information coming from the hospital information system (HIS). Data from patient monitoring devices and sophisticated laboratory tests generates a flood of data that can be difficult for individuals to process and abstract in real time. This, in turn, can lead to sub-optimal decisions and therapeutic actions [2].
Interpreting this information requires the integration, correlation, and comparison of data acquired by a variety of sources. Patient monitoring system needs to capture data from all bedside devices automatically. Therefore, computer programs must be able to acquire data from all of these devices directly. Unfortunately, these bedside monitoring devices are often stand- alone and use proprietary communication protocols, making their interconnection difficult.
Although, an IEEE standards committee, IEEE 1073 [3], has been working since 1984 on a standard for medical device data communication in critical environments called the Medical Information Bus (MIB), major medical device manufacturers still do not adhere to the standard.
Even today, the lack of interconnection remains a major obstacle to the development and implementation of intelligent monitoring systems.
Thus, new solutions are needed to integrate the data from bedside devices and hospital information systems, manage and process the flow of information and provide efficient and reliable decision support tools. Ideally, a real-time patient monitoring system should be able to
acquire physiology data from all bedside monitoring devices as well as relevant information from the HIS and provide real-time and systematic integrated information for medical practitioners. This monitoring system should also provide ways to access the information remotely, and notify users when critical events are detected.
Hence, from the above discussion a patient monitoring system should be able to:
1. Acquire physiological data (from bedside devices)
1.2.Acquire information from the HIS such as demographics or lab data.
1.3.Store a large amount of data, organize it, and provide information to the medical practitioners that can be used for decision support.
1.4.Integrate and correlate data from multiple sources.
1.5.Automatically detect adverse events and notify care providers.
Over the years, a number of systems have been developed to address problems faced by clinicians in critical care environments. These include, among others (see [4] for a more
complete review), model-based event detection [5], planning and critiquing [6], or closed-loop control of bedside medical devices, such as ventilators [7] and infusion pumps [8]. But these systems were developed with specific applications in mind and are difficult to scale up. They are difficult to use in a wide range of patient monitoring applications. The main objective of this work is to develop a flexible and scalable architecture for real-time patient monitoring in intensive care units.
SIMON
SIMON, an acronym for Signal Interpretation and MONitoring, is a system being developed at Vanderbilt University, in the School of Engineering in collaboration with the Vanderbilt University Medical Center. SIMON is designed to acquire, integrate and process information acquired from bedside-devices, medical staff, and the hospital information system.
The main goal of this project is to design, develop, implement, and test software and hardware architecture for intelligent patient monitoring. A requirement is that this architecture be easily fielded in a variety of critical care units and configured for a wide range of monitoring
applications.
Prior Architecture
An initial architecture of SIMON was designed and implemented in 1994 [9, 10, 11, 12].
The system had been running in the Coronary Care Unit and the data from the unit were
published on the web near real-time [10,13] from February, 1996 to August, 1997. Development of the SIMON-ICU prototype comprises three parts: SIMON-RTS, SIMON-ART, and SIMON- WEB. Each part is discussed below.
SIMON-RTS
The main component of this version of SIMON is the real-time monitoring system (SIMON-RTS). The functionality of the monitoring system is separated into modules. Modules communicate with each other through Unix Inter Process Communication (IPC) [14]. A Client- Server architecture is used to organize the modules. The main modules are the Data Acquisition module [15], Feature Extraction module and the Monitoring Supervisor. The Data Acquisition module acquires the raw data from bedside devices through their serial port interface (RS-232).
The second module is the Feature Extraction Module. The Feature Extraction Module
implements all data validation, sensor fusion and feature extraction operations under the control of the Monitoring Supervisor. The Monitoring Supervisor controls the feature extraction module and is responsible for high level monitoring directives in a data abstraction strategy.
SIMON-ART
The functionality of the SIMON-ART system is to publish monitored data collected by SIMON-RTS on the web. The ART system acquires data from SIMON-RTS via FTP transfers from the bedside computer and then graphs the monitored data as GIF images at various time resolutions, and publishes them on the Web along with HTML pages containing laboratory data and physician orders.
SIMON-WEB
SIMON-WEB is a Java application that integrates data collected by SIMON –RTS and the hospital information system (CIS). SIMON-WEB is a first attempt at providing integrated information to the medical practitioners. SIMON-WEB displays graphical data transferred from
the SIMON-ART by way of FTP transfers as well as information from the clinical laboratory and physician order-entry systems. The system allows users to annotate the data using a point-and- click or free-text interface. The nurse’s annotations help in the electronic capture of significant clinical events that cannot be sensed automatically; consequently, it can be used to assist in developing better event detection and artifact rejection algorithms.
Figure 1: Architecture of SIMON-RTS [10]
Evaluation
This version of the SIMON architecture was fielded in the Coronary Care Unit (CCU) of Vanderbilt University Medical Center (VUMC). SIMON-RTS and SIMON-WEB ran on a bedside workstation that exported data to SIMON-ART, which, in turn, published the data securely on the VUMC intranet. Figure 3 shows the architecture of the SIMON system in the CCU.
Ventilator
Monitor Monitor IV Pump
Data Acquisition
Server
Data Abstraction
Bedside GUI
DB
Patient Model
Network RS-232
Remote GUI
Figure 2: SIMON-WEB system architecture and relationship to the clinical information system (CIS) [10]
In this version of the system, the modules did provide rigorous abstraction of device communication and data collection functions. However, this abstraction adds considerable complexity to the system. Tight coupling between the Server module and the data
collection/analysis modules makes the system difficult to expand for new devices and new beds.
In addition, the skills and resources available to the project and the local computing
infrastructure at the time were not well-suited to Solaris x86. Windows NT seemed a more appropriate choice for these and other reasons, and a large portion of the code needed to be rewritten in order to run the system on this platform. These considerations lead to a complete overhaul of the system [16].
SIMON-WEB Serve SIMON
SIMON-WEB Client
ART
GIE
DB2 MARS
monitor data, alarms
labs, orders,
GIF & HTML files
ADT
Lab
Order-entry
nursing notes census
CIS
Figure 3: The architecture of the SIMON system as fielded in the CCU [10]
Revised SIMON Architecture
Design Constraints
The following design constraints were specified for the revised architecture:
Reliability – The system should be reliable enough to run 24 hours a day, 7 days a week with minimum human interference for non-life-critical decision support.
Expandability – Addition of new types of devices as well as extension of the system functionality (new alarming schemes, various types of data displays, etc.) should be simple.
Scalability – The system must be easily expanded to support additional beds and other intensive care units.
Simon Data Acquisition
Simon Monitoring Supervisor
HP + Ventil ator + IV Pump s Simon-Web Bedside User Interface
(WWW client)
Simon Data Acquisition
Simon Monitoring Supervisor
HP + Ventil ator + IV Pump s Simon-Web Bedside User Interface
(WWW client)
Server
Off line analysis
Web Server ART
Simon/PCIS gateway
Real-time processing Real-time processing
Generic Interface
Engine
Notification
Orders
Laboratory
Flexibility – Installation of the system should not require more than a network connection at the bedside. Individual components should be able to be deployed on one or more physical
machines, and reorganized as needed according to computational resource requirements.
Compatibility – While the core system components are designed to run on a particular platform (Windows NT), data interfaces should be available to external components running on a variety of platforms.
To meet these requirements, the new version of SIMON has been organized in three layers: the Data Layer, the Task Layer, and the Knowledge Layer.
Figure 4: The Revised SIMON multi-layer reference architecture [17]
Data Layer
The main purpose for the Data Layer is to provide the information collecting system.
Basically, the Data Layer acquires data from bedside devices and hospital databases and store data to storage. The Data Layer also distributes data to other components in other layers by providing a central point of access to all system data for message translation and message routing. The central component is the DataServer, which is the only component communicating directly with components in the Task Layer. There are also three main groups of components in
DATA LAYER TASK LAYER KNOWLEDGE LAYER Configuration,
Requests
Information, Abstraction
this layer: data collection, data storage and management, and web-based user interface. More details on these components are provided in chapter two.
Task Layer
The Task Layer acquires and monitors raw data streams from the Data Layer and detects user’s configured events. When an event is detected, physicians, nurses etc. are notified.
Knowledge Layer
Components in the Knowledge Layer provide high-level reasoning capabilities for decision support, and configure the task layer to deliver notifications about events required for such processing. The Knowledge Layer is not discussed in this thesis (see [17, 18] for more details about the Knowledge Layer).
Componentization can significantly enhance the system in many aspects. Each
component can be developed and tested separately, so new functionality can be tested and added with minimal effect on the whole system. The system can be scaled up by adding additional modules. Also, multiple and redundant components can be used to reduce the impact of failure of individual component. The system can be distributed on multiple processors and/or platforms which allows work to be shared. It also facilitates the management of the overall system.
This chapter has presented the requirements for an intelligent patient monitoring system in general; the motivation for this work has been presented as well as some lessons learned from our past experience. Finally, the revised architecture has been introduced. The following chapters provide more information about the various components of this system. The second chapter is a complete description of the Data Layer. It discusses the design, basic architecture, purpose and implementation of all modules in the layer. The third chapter presents the initial Task Layer and its modules. It explains the requirement for the Task Layer, its current architecture, and its implementation. Chapter four presents the improved Task Layer. This chapter describes a new architecture, the technology used, and its implementation. Chapter five concludes the thesis and discusses our experience with the current version of the system fielded in the trauma unit at VUMC, its results and evaluation, and future recommendations.
CHAPTER II
DATA LAYER
The Data Layer, as introduced in chapter one, is responsible for acquiring, organizing, archiving and distributing data for the entire system. Mainly, the Data Layer must be able to get raw data from both bedside devices and the hospital information system, store it persistently for future analysis, and organize it in order to distribute them to other layers. To achieve this, the Data Layer of the SIMON architecture has been divided into several interrelated components.
This chapter describes the various tasks performed by the Data Layer. Next, design options that have been taken are discussed and detailed. Finally, each of Data Layer’s component is presented and discussed.
Functionality in the Data Layer
Data Acquisition
The Data Layer provides methods to acquire raw data from any required source. The raw data for the SIMON system can be generally classified into bedside devices data, and hospital information system data.
Data organization
Data organization is essential because of the vast amount of data acquired continuously for monitoring purposes. The Data Layer has to be able to efficiently manage the flow of data and pass the relevant data items to the other system components in the same layer and the Task Layer.
Data Archiving
Even though patient monitoring and alarming systems operate mainly on real-time data, historical data can be useful for other purposes such as medical research or the development of advice giving systems. Because the Data Layer is responsible for the acquisition and distribution of the data, its functionality also includes the ability to store these data to persistent storage.
Distributing Data
In the revised SIMON architecture mentioned before, the Data Layer is not responsible for processing the data. Hence, the Data Layer has to be able to distribute data to the Task Layer for data processing. In other words, the entire Data Layer acts as a server distributing data to the Task Layer.
Design Decision
Distribution
The Data Layer’s architecture is based on distributing tasks to individual components.
The Data Layer includes the following components: the DataServer, the Data Collection modules, the Web-based User Interfaces and the Data Storage and Management modules. The functionality of each of these components is detailed later in this chapter.
Communication
Most of the data handled by the Data Layer is acquired in real-time from bedside monitoring systems (some additional data can be originated in various databases of the hospital information system). To do this, the data is acquired in real-time by the Data Collection modules directly from the bedside devices and passed to the DataServer which stores and distributes these data appropriately. Because of reliability, performance, and wide acceptance, TCP/IP Socket [19] has been chosen to handle communication between the Data Collection modules and the DataServer. More details about the DataServer protocol can be found in [48].
Implementation
To facilitate code reusability, an Object-Oriented Programming approach has been chosen to implement the various components of the system. C++ existing libraries such as Microsoft Foundation Classes (MFC) [20, 21], Standard Template Library (STL) [22], and win32 API [23] have been used to code those components that need to operate in real-time. Java [24] has been used to implement the Web-Based User Interfaces components. Moreover, PERL [25] and JavaScript [26] have been used to implement other components.
Components
1. DataServer
The DataServer has been developed to act as a message translating and routing module for the data layer. The DataServer receives data from all data collection components and distributes the data to the Data Storage and Management components, as well as to components in other layers.
2. Data Collection components
The Data Collection components are responsible for retrieving data from the bedside monitoring devices or from a hospital database and for sending these data to the DataServer. In general, there is one Data Collection component per bedside device.
3. Web-based User Interfaces
Components in this group are those that deal with Web-based User Interfaces. Some components are used to create image files to be displayed on web pages while others are Java Applets that are embedded into various web pages.
4. Data Storage and Management component
The task of archiving data is performed by these components. These components are clients of the DataServer. Some of these components get the data and write them in normal text- file format to persistent storage while others populate databases, which can be easily retrieved later via SQL [27] commands.
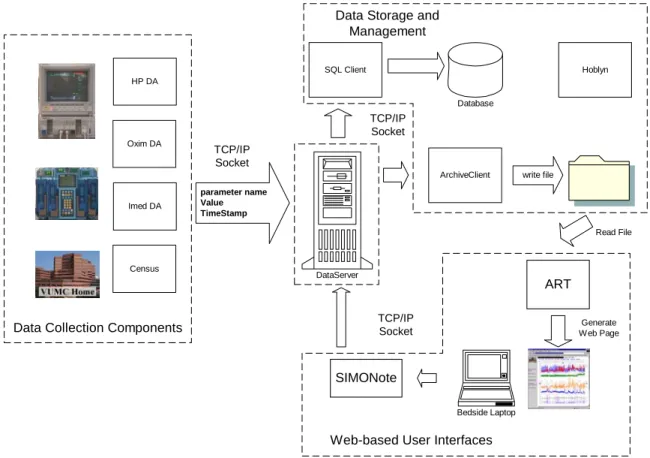
DataServer
The DataServer is the key to data distribution since it is the central component in the Data Layer and it is responsible for routing data and message to and from every component in both the Data Layer and the Task Layer. Every data item acquired by the system is sent to the DataServer which then distributes it to the other system components.
Figure 5: The Data Layer and various components (each of there components are describes in this chapter)
Implementation
C++ has been used to implement the DataServer. This decision was made because the DataServer has to deal with real-time data and performance is an important issue. Second, implementing a server application is a challenging task and the Visual C++ IDE by Microsoft provides many libraries needed to develop such applications. These include data structures (STL vector, STL maps, CPtrList, etc.) or well-built string classes (CString or STL strings) that facilitate and expedite the task of the developer.
Multi-Threading
Because the DataServer needs to be able to interact with several components
simultaneously, it is multi-threaded. A main thread creates a new child thread and new socket to handle a communication every time a new connection from another data source or client is
TCP/IP Socket
Bedside Laptop
ART
Generate Web Page
SIMONote
Web-based User Interfaces
ArchiveClient write file SQL Client
Database
Data Storage and Management
Hoblyn
parameter name Value TimeStamp
TCP/IP Socket
DataServer
TCP/IP Socket
Read File HP DA
Imed DA Oxim DA
Census
Data Collection Components
established. All the threads communicate with each other via windows messages and synchronized global variables. A number of new messages have also been defined for this application in addition to the built-in windows messages. Multi-threading also improves reliability of the DataServer because failure of one component affects only an associated child thread in the DataServer while other child threads remain able to continue communicating with their component normally.
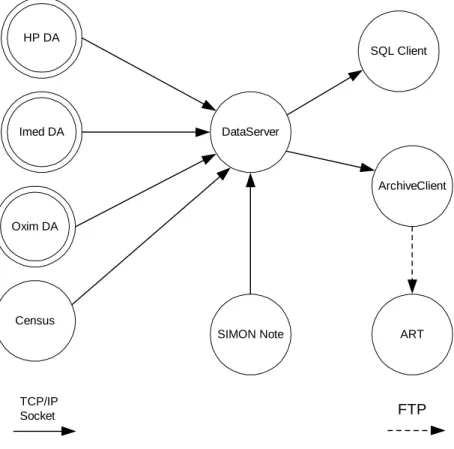
Figure 6: The Data Layer data flow diagram
DataServer Communication
The components communicating with the DataServer can be grouped into two categories.
The first one is a group of Data Collection components. The Data Collection components acquire raw data from bedside medical devices and the hospital information systems. The bedside data are acquired and sent to the DataServer all the time whenever a patient is in a bed, and the data from the hospital databases are acquired periodically when needed. All the Data Collection
ArchiveClient
ART HP DA
Imed DA
Oxim DA
DataServer
SQL Client
Census
SIMON Note
TCP/IP
Socket FTP
components send data to the DataServer via TCP/IP Socket. Currently, this is only a one-way communication because the Data Collection components only send messages to the DataServer.
The second group of components is a group of client components. The components in this group include some components in the Data Storage and Management group and some components in the Task Layer. The client components also communicate with the DataServer via TCP/IP
socket. However, both the DataServer and the clients can send and receive messages. The type of data that the DataServer sends to and receives from each client depends on each individual client.
Publisher-Subscriber Approach
When a connection between a new client and the DataServer has been established, the DataServer sends the list of data it can supply. To get the data from the DataServer, a client has to subscribe to the desired data streams. After that, the data to which the client subscribes are sent automatically every time the DataServer gets new data from the data collection components.
Also, clients can unsubscribe if they do not require certain data any longer. When the DataServer receives an unsubscribe message from one of its clients, it stops sending these data items to that client. This approach is called Publisher-Subscriber or Observer pattern [42].
The publisher is the DataServer, which publishes data to the clients subscribers. This approach is better than a traditional request-reply approach, which is used in many client-server applications, because clients are not required to send message to the DataServer every time they need the data. However, to make this possible, the DataServer has to keep the information it needs to send the correct information to each individual client.
Dynamic Parameter List Updating
Because parameters from the Data Collection components may change over time (for instance, monitored variables can be added or removed), the DataServer must be able to keep the list of available data up to date. By checking the last receiving time of each data item, the
DataServer can determine which data is valid. If the DataServer gets a new parameter from the Data Collection components or detects invalid data, the DataServer has to update its parameter list and notify every client.
Data Queue
Because of system load or network delays, it is possible that some clients may not be able to handle all data from the DataServer. To prevent loss of data, the DataServer should be able to queue the data for each individual client. As mentioned above, all the threads in the DataServer communicate with each other using windows message queues. Because each thread has its own message queue, when the main thread in the DataServer passes messages to client threads, the data and other messages are automatically queued.
Data Collection Components
The Data Collection components acquire data both from various bedside medical devices and from hospital information systems such as the census. Then this information is transmitted to the DataServer via TCP/IP Socket. A (non-exhaustive) list of parameters the data collection components can acquire is shown below.
HP_CPP – HP Monitor (HP) Cerebral Perfusion Pressure HP_HR – Heart Rate
VL_PEEP – Ventilator Post End Expiratory Pressure, via HP VueLink (VL) module VL_CI – Baxter Cardiac Index
Imed1_A_RATE – IV Pump 1, channel A Rate
CEN_MRN – Medical Record Number from hospital census system
Oxim_SaO2 – Ohmeda Biox 3740 Pulse Oximeter (Oxim) Oxygen Saturation USR_NOTE – Notes from SIMON-Note
For example, HP_CPP is the Cerebral Perfusion Pressure acquired from an HP Monitor.
The complete SIMON parameter list is in appendix A.
There is one Data Collection component associated with each bedside device. Other Data Collection components are used for querying periodically various databases of the hospital information systems.
Implementation
The data from bedside devices is acquired in real-time. For this reason, the Data Collection components that connect to bedside monitoring devices have been implemented in C++ for maximum performance. Another reason to use C++ is the availability of vendor-
provided libraries written in C which permit device interfacing (e.g., Hewlett-Packard’s MECIF libraries [28]). Data from the hospital information system are only acquired periodically and other programming languages can be used for this purpose. In the current implementation of he system, PERL is used to implement the modules that gather census data.
Data Source Distribution
As mentioned earlier, there is one Data Collection component associated with each bedside device. Other Data Collection components include the Census component that gathers information about bed occupancy from the hospital databases. This information is used to associate a bed and the data acquired from the patient monitoring devices connected to this bed to a patient. Every data item acquired from bedside devices is labeled with a bed ID that allows the DataServer to identify its source.
Data Source Communication
All bedside Data Collection components connect to bedside devices via RS-232 serial interfaces using an RS-232 terminal server [29], a device that can be mounted near the bedside device. A terminal server acts as an Ethernet bridge and allows a remote computer to
transparently access up to eight RS-232 serial ports via an Ethernet network.
For other components, different approaches are used. The Lab Data component acquires hospital laboratory information via an encrypted TCP/IP Socket. The Census component obtains bed information via periodic FTP file transfers.
HP Monitor Data Acquisition
This Data Collection component, called HPDA, acquires data from the HP monitors via RS-232 serial port. When one HPDA is started, it sends the list of parameters it wants to the monitor (currently, this list of parameters is hard coded in the HPDA modules). Once the communication is established, the HP monitor keeps sending data to the HPDA continuously [28]. In the current implementation of the system, HPDAs receive data from the monitors once a second. Moreover, by using Hewlett-Packard “VueLink” interfaces [30, 31, 32], HPDAs can get data from additional devices such as Servo ventilators [33] via the HP monitor. In the trauma
unit in which the system has been fielded, each bed is equipped with one HP monitor and there is one HPDA per bedside monitor.
IV Pump Data Acquisition
Like the HPDA, this Data Collection component, called ImedDA, acquires data from IV (intravenous) Infusing Pump via RS –232 serial ports. IV pumps can have one, two, and four infusing channels depending on the type of the pump. ImedDA detects the number of infusing channels and starts acquiring data. Unlike HPDA, ImedDA needs to send a request command to the IV pumps every time it needs data. ImedDA can get data from the pumps every two seconds (See protocol details in [34]).
Oximeter Data Acquisition
This Data Collection component, OximDA, is similar to the HPDA in that both are acquiring data via RS-232 serial ports and in both cases the bedside device sends the data
periodically once the communication is established. The bedside pulse oximeter device currently used in the trauma unit (Ohmeda Biox 3740) can send data through its RS-232 port every two seconds [35].
Census
The Census component acquires information about bed occupancy. Monitored data can be associated with individual patient by using this information. Owing to patient safety and confidentiality concerns, this method is used to protect patient identity; therefore only authorized personnel can identify patients in historical data.
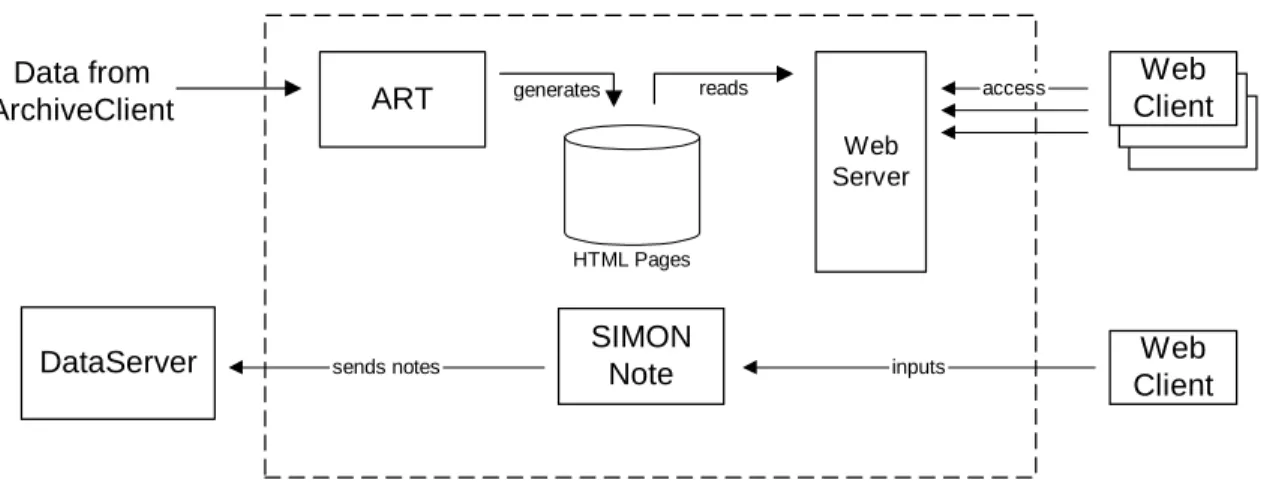
Web-based User Interfaces
Since current web technology provides a means of rapidly developing distributed clients, the World Wide Web is used to provide user interfaces to graphs of selected parameters.
However, direct access to SIMON DataServer is resource intensive in term of hypertext markup language (html) formatting and implementing http protocols.
ART was created to handle the above tasks by graphing data and provide these graphs to a web server. Another web-based component of the system is the SIMON-Note applet that can be used at the bedside to annotate data and enter nursing notes.
Figure 7: Web-based User Interfaces architecture with DataServer and Web Client
Implementation
Originally, ART had been implemented in C under OS/2. This program was then ported to Microsoft Windows NT to run with the new SIMON implementation. The SIMON-Note applet has been written in Java
ART
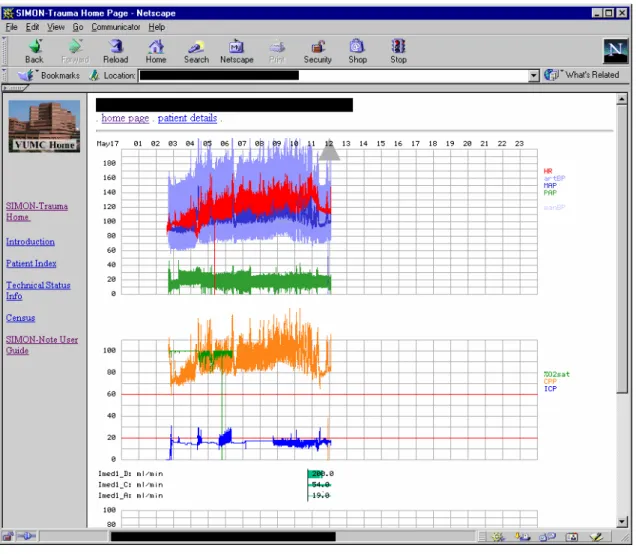
ART is a legacy component from our previous SIMON implementation that graph data and provide image files to a web server via a Networked File System (NFS) link. ART accesses data by reading text files generated by the ArchiveClient component of SIMON (see below) instead of interfacing directly to the DataServer. ART provides current views of patient monitor data, at various levels of resolution: 24 hours or one hour per screen. The ART graph showing in Simon-Trauma web site is shown below. The upper plots show cardiovascular data, including heart rate (HR), Diastolic arterial pressure (artBP), Mean arterial pressure (MAP), Mean
pulmonary (PAP), and Non-invasive pressure (manBP). The middle plots show respiratory data, including pulse oximetry (02%Sat), cerebral perfusion pressure (CPP), and intracranial pressure (ICP). The lower bar plots show IV drug infusion rates, with the bar thickness corresponding to normalized dosage.
ART
HTML Pages
Web Server
SIMON Note
Web Client
access
Web Client DataServer
generates reads
sends notes inputs
Data from ArchiveClient
Figure 8: Simon-Trauma web site showing ART graph plotted over 24 hours.
SIMON-Note
SIMON-Note is an applet designed to facilitate the annotation of the data graphs at the bedside. SIMON-Note is a modification of a Java application developed by the Division of Biomedical Informatics in the Vanderbilt University Medical Center. It has been used by care providers to enter clinical notes. A right-click on the graph starts a new window that is initialized with the patient name, ID, and a time stamp. The users can then enter notes in free text format.
SIMON-Note can also be used to create note templates that can be completed and filled in by the end user.
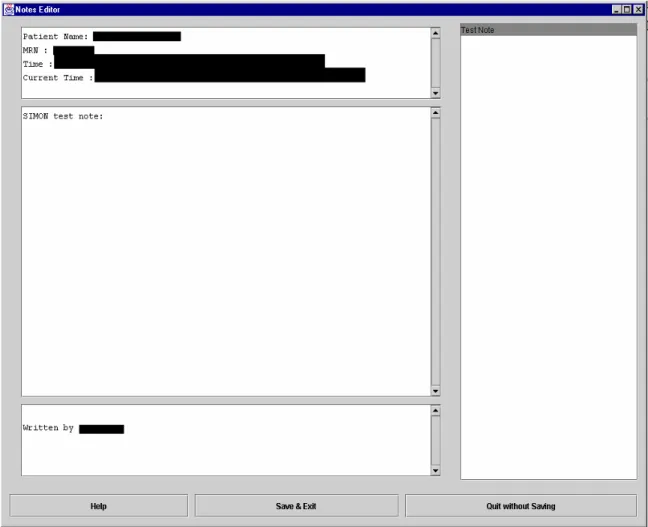
Figure 9: SIMON-Note user interface (Screen explanations are described in the next page)
Figure 9 shows the SIMON-Note user interface. The upper left text area of the applet is initially filled with the patient name, medical record number (MRN), and time information, while the user name is filled in the lower area. Care providers can enter notes in the middle area. The right area is a list of note templates. Care providers double-click an item in the list, which is defined in a configuration file on the server. The SIMON-Note applet uses JFC/SWING [36], a set of Java2 graphical user interface (GUI) components. Because Java2 is not fully supported by the web browser currently in use in the trauma unit (Netscape 4.7 and IE5), the Java2 Runtime Environment (Java Plug-in) from Sun Microsystems has been used instead of the original browser's JAVA virtual machine. Moreover, LiveConnect [37] is used to enable JavaScript and Java Applet to exchange data.
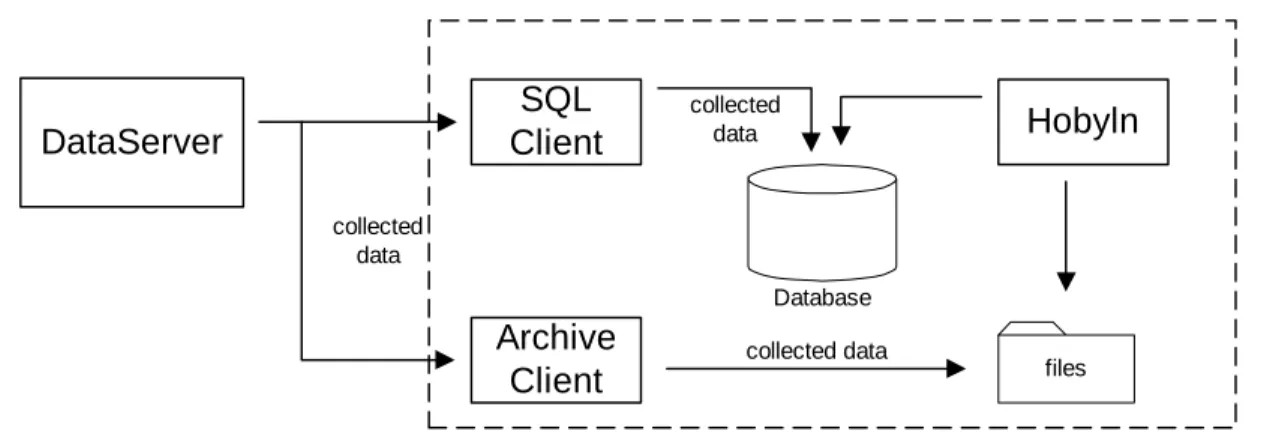
Data Storage and Management components
The components in this group are responsible for archiving and accessing data; they also implement the logic required to reliably associate data with patients.
The ArchiveClient and the SQLClient are components that provide data storage for access by other components. Another component is Hoblyn, which performs system and data management tasks.
Figure 10: Data Storage and Management architecture with DataServer
Implementation
The ArchiveClient is implemented in C++ for performance reasons because it has to retrieve every data item passing through the DataServer and store these data in real-time.
SQLClient is implemented with Microsoft Server 7.0. Finally, PERL is used to implement Hoblyn.
ArchiveClient
The ArchiveClient was designed to support legacy systems, such as ART and Hoblyn.
The ArchiveClient initiates a connection with the DataServer by first requesting the list of available parameters and then subscribing to all the data. When it receives data from the DataServer, the ArchiveClient writes these data to text files. Data from each bed are put in different directory and each parameter in a separate text file. The DataServer dynamically manages the list of available parameters and automatically informs its clients when new data are
Database
SQL Client
Archive Client
Hobyln
files
DataServer
collected data
collected data
collected data
available or when data becomes unavailable. When the ArchiveClient is informed that a new variable becomes available, the ArchiveClient immediately subscribes to it. The rate at which data is written to file depends on the data source and every data item is stored with a time stamp.
Table 1 shows a fragment of the file. The first column is the time stamp. The second is the value of heart rate associated with the time in the left column.
Table 1: ArchiveClient file
SQLClient
This component is akin to the ArchiveClient as it also subscribes to all parameters, but instead of writing data to text files as the ArchiveClient does, it populates a relational database implemented with Microsoft SQL Server 7.0. However, because the storage of every data point would increase the size of the database too rapidly, data points are only stored every 10 seconds.
Also, a ten second median filter is applied to the raw data before they are down sampled. The SQLClient that reused some code from the ArchiveClient was implemented by Patrick Norris, a graduate student in the department of Biomedical Engineering, Vanderbilt University. More details about the SQLClient can be found in [17].
Hoblyn
Hoblyn was implemented in PERL by Patrick Norris. Hoblyn's task is data and files management. It maintains demographic information, archive, and move data files to and from directories as patient move in and out of monitored beds. This is an essential task that needs to be performed to guarantee that the association between data and patient is accurate at all time.
Information about patient movement is obtained from the hospital admission-discharge-transfer (ADT) system. Hoblyn's task is complex because ADT information may lead or lag the actual time at which a patient is put into a bed and begins to be monitored by up to an hour or more.
957979616 79.00 957979620 79.00 957979621 80.00 957979622 79.00 957979623 80.00
Hoblyn has been fitted with a fair amount of logic that allows it to handle these situations
robustly. Hoblyn also alerts project staff via e-mail and alphanumeric pager in the case of patient information ambiguity. Moreover, Hoblyn performs other tasks, such as verifying integrity of the bedside device data network and the NFS link to the web server. More details about Hoblyn can be found in [17].
CHAPTER III
CURRENT TASK LAYER
In the SIMON architecture, the Task Layer is responsible for detecting events in the raw data streams feeding the Data Layer. In particular, one or more components in the Task Layer connect to the DataServer and subscribe to required parameters. Once this is done, components in the Task Layer continuously monitor the data and notify care providers when predefined events, i.e. alarms, occur. Outputs from the Task Layer are also used by the Knowledge Layer for higher-level decision support tasks.
As in the Data Layer, a central point of interface for configuration of tasks and
subscription to task outputs at the Task Layer level is a component called TaskServer. Generally, users supply information to the TaskServer about events that need to be detected and notification methods.
This chapter describes the design and implementation of the task layer and details its operation.
Introduction
Currently, the Task Layer has one component called the Alarm Detecting Client (ADC).
In the current architecture, the ADC acts as the TaskServer. Users can supply information to the ADC via a configuration text file to specify events to be detected, and notification information (currently the email address of the care providers and the time of day).
As did the ArchiveClient in the Data Layer, the ADC communicates with the DataServer via TCP/IP Socket, but, unlike the ArchiveClient, it subscribes only to required parameters—i.e., parameters it needs to monitor.
From the DataServer point of view, the ADC is just a normal client. Several ADCs can thus run on several machines. This permits the configuration of many different events adapted to the needs of various end users. Each end user can define his/her own events and notification policy and implement these on any machine that is allowed to connect to the DataServer.
Workings of the ADC
The ADC is designed to be a small and simple program that monitors a number of parameters and detects predefined events. In the current implementation of the system, it reads a configuration text file when it is started. Hence, if the definition of events needs to be modified or adapted, the ADC must be restarted. A fragment of a configuration text file is shown below.
DS_IP 129.59.99.240 Alarm HR < 90 10 Alarm SvO2 < 60 15 Alarm CI < 2.5 0 Alarm ICP > 25 15 Label SpO2 02%Sat
E-mail_all [email protected] E-mail [email protected] E-mail [email protected]
MaxGap 300 NormalGap 120 CheckNoise 30 SendTime 6:00
In the file, there are several important configuration items for the ADC. DS_IP is followed by the ip address of the DataServer to which this ADC will connect. Required events, threshold condition, and temporal intervals are put after the Alarm fields. For example, Alarm HR < 90 10 configures the ADC to subscribe to the heart rate (HR) parameter of every patient and monitor the value of the heart rate to check if it falls below 90 for 10 minutes for any of the patients. The E-mail field contains the e-mail address of the care provider who wants to be notified if this event happens. Here, notification is not done in real-time, but a report is sent once a day with a list of detected events. The SendTime field contains the time at which the e-mail message should be sent (6:00 means 6 am). The MaxGap and CheckNoise are fields used to contain parameters needed by the event detection algorithms. For instance, MaxGap is the time after which the ADC will stop monitoring a parameter if the DataServer stops sending values for it. CheckNoise is used by the event detection algorithm to reject spurious data points. The event detection algorithm considers an event to be meaningful if the heart rate remains below 90 for duration at least equal to CheckNoise.
When the ADC starts, it reads all the required information from the configuration text file. Then it tries to subscribe to all the required parameters. If the DataServer cannot supply some parameters at the time the ADC starts, it puts them on its list of desired parameters. As soon as the DataServer receives these parameters, it sends them to the ADC that begins monitoring their values.
Alarms in the ADC are categorized as current alarms and past alarms. Current alarms are events that are occurring and are being monitored by the ADC, while past alarms are events that have occurred, and those are not currently detected. Current and past alarm information are kept in xxx_CurrentAlarmFile.d and xxx_PastAlarmFile.d respectively (where xxx represents a bed ID). In addition, the ADC also keeps a log on how long each bed has been monitored in a duration text file. The ADC keeps monitoring and updating current alarms, past alarms, and duration text files. When the current time matches the notification time specified by a user, the ADC puts all current alarms, past alarms and the duration information separated by the bed ID in emails. These are then sent to the required email addresses. When this is done, the ADC starts monitoring the same events until the notification time is reached again.
Both files contain event information, including parameter name, a threshold condition, and the beginning and end time of events. While events in a current alarm file might be updated every minutes, events in a past alarm file are static, but new event can be added to the past alarm file. A fragment of the current alarm file is shown next.
HR < 90.00 from 04/03 6:21 to 7:25 ICP > 25.00 from 04/03 7:01 to 7:25 .
.
For example, if the ADC is still detecting an HR event at 8:00, the end time in the current alarm file above must be changed from 7:25 to 8:00. However, when the HR event ends, the event information will be moved from the current alarm file into the past alarm file. At the sending time, all events in current alarm files are copied into the past alarm files. After that, the ADC sends an email with all the events in the past alarm files. Finally, the past alarm files are deleted and the ADC continues monitoring data for the next day.
Implementation
ADC is a single executable written in C++. Several MFC classes and STL are also used here. The important classes are a CADCManager, a CADCFileManager, and an AlarmObject.
Figure 11 shows a class diagram of these classes. The CADCManager class is a main instance that reads configuration text files, establishes the communication with the data layer, and monitors data streams. The CADCFileManager class is responsible for reading and updating alarm files. The ADC keeps information about individual parameters in an AlarmObject instance, and every time the ADC receives data from the data layer, it updates the state
(m_ObjectState) of the instance. The way alarms are generated is discussed in detail in the next section.
Figure 11: Class diagrams of important classes in the ADC
Alarm O b ject
-m _P aram : S im onN am eS pace -m _S tartT im e : C Tim e -m _S topTim e : C T im e -m _LastV alid : C T im e -M axG ap : static unsigned int -N orm alG ap : static unsigned int -C heckN oise : static unsigned int -m _bThresholdV alue : bool -m _A larm S tate : A larm S tate -m _O bjectS tate : A larm O bjectS tate
C AD C M anag er
+U pdateA larm O bject(P aram : C S tring, C urrentV alue : float, C urrentT im eS tam p : long) +S ignalA larm O bject()
+N ew P aram (P aram : C S tring) : int +S endA larm E m ail() : void +R eadInfoF ile() : void +m _P aram List : S T L M ap +m _P aram N am e2Label : S T L M ap -A larm Info : S T L m ap
-E ventInfo : S T L m ap -m _S M T P S ocket : C S ocket -m _iH ours : int -m _iM ins : int
-m _A llE m ailList : S T L V ector -m _A larm E m ailList : S T L V ector -m _S tartT im e : C Tim e
-m _F ileM anager : C A D C F ileM anager
C AD C F ileM an ager
+U pdateT im e(B edID : C S tring) : int
+C urrentToP astA larm F ile(P aram : C S tring, C urrentTim eS tam p : unsigned int) : void +C urrentToP astA larm F ile() : void
+U pdateC urrentA larm F ile(P aram : C S tring, S ign : C S tring, V alue : float, S tartT im eS tam p : long, C urrentT im eS tam p : long) : int +D eleteP astA larm F ile(B edID : C S tring) : int
+A llC urrentToP astA larm F ile() : void
Generating alarms
As discussed previously, the ADC continuously monitors parameter values and generates alarms and stores those into text files whenever the pattern of data matches the event description.
For example, the line HR < 90 10 in the configuration text file instructs the ADC to compare every heart rate data point from every patient with a threshold value of 90. If the data is below 90 for a continuous interval of 10 min, an alarm is raised. But the data from the data layer may not arrive at constant intervals because of data dropouts due to system load, delays due to network traffic, or other minor glitches in the system. These gaps and data glitches must be considered because they can confuse the ADC, resulting in false alarms or missed events. Figures 12 and 13 show possible scenarios, including data gaps, and the logic that has been used to handle these situations.
Figure 14 shows the state diagram of the AlarmObject that explains how alarms are detected and written to the current and past alarm files. ThresholdValue is a threshold condition for each AlarmObject instance. The LastValid variable represents the last time at which the ADC received a data value for this parameter from the DataLayer. The Current system time is stored in the Now variable. The StartTime and StopTime variables are used to keep time information for the AlarmObject instance.
Figure 12: Possible sequence of data
t1 t2
t0
t2
t1
Normal:
if t2 - t1 > Duration then write CurrentAlarm else No Alarm
parameter value
time
Threshold value
Figure 13: Discontinuous sequence of data
There are ten possible states for each AlarmObject. An initial state is a Monitor state. An AlarmObject instance will be in a Detected_Threshold state whenever the ThresholdValue is true longer than the CheckNoise time. Whenever there is a gap (now – LastValid > NormalGap) in a stream of data, an AlarmObject instance will change to either one of the three Gap states. To which state it will change depends on its current state. If the length of the gap is longer than MaxGap, from any Gap state, an AlarmObject instance will change to the DeleteAlarmObject state. In this state the instance will eventually be removed from the ADC. Those above six states excluding DeletedAlarmObject state can be grouped into one large Monitor state. The other three states which can be grouped into one large Alarm state are Detected_Alarm state, Gap_alarm, and Detected_Alarm_Wait state. The CADCManager checks all AlarmObject instances in the Detected_Alarm state and updates the corresponding current alarm files every minute. The current alarm files are also updated every time there are transitions among these three states. Past alarm files are updated whenever an AlarmObject instances’ state changes to the Monitor and Delete states.
t1
g1 g2
t2 t1
g2 g1
Gap1:
if g1 - t1 > Duration then write CurrentAlarm else No Alarm
if g2 - g1 > MaxGap then write PastAlarmFile
Gap2:
if g1-t1 > Duration then write CurrentAlarm else No Alarm
if t2-g2 > Duration write CurrentAlarm if g2-g1 >= MaxGap then write PastAlarmFile else write PastAlarmFile at t2 time
Threshold value parameter value
Figure 14: State diagram that shows how alarms are generated
Note: CheckNoise < NormalGap < MaxGap Monitor
Threshold_Wait ThresholdValue := true
/StartTime = now H
ThresholdValue := false
Detected_Threshold ThresholdValue := true AND
now - StartTime > CheckNoise
Detected_Threshold_Wait ThresholdValue := false
/ StopTime = now
ThresholdValue := true / StopTime = now
ThresholdValue := false AND now - StopTime > CheckNoise / StartTime = -1
Detected_Alarm
ThresholdValue := true AND now - StartTime > Duration / update CurrentAlarmFile
Detected_Alarm_Wait ThresholdValue := false
/ StopTime = now update CurrentAlarmFile
ThresholdValue := false AND now - StopTime > CheckNoise / StartTime = -1
update PastAlarmFile
ThresholdValue := true / StopTime = now update CurrentAlarmFile Gap_Threshold
Gap_Alarm now - LastValid
> NormalGap
DeletedAlarmObject
now - LastValid > MaxGap
now - LastValid > MaxGap / update PastAlarmFile
now - LastValid > NormalGap / StopTime = now now - LastValid < NormalGap
now - LastValid < NormalGap / StopTime = now update CurrentAlarmFile Gap_Monitor
now - LastValid < NormalGap
now - LastValid
> NormalGap
now - LastValid > MaxGap
Monitor
Alarm Delete
CHAPTER IV
REVISED TASK LAYER
The Task Layer described in the previous chapter, with one ADC component, was deployed in the Trauma Unit at Vanderbilt University Medical Center. The ADC has been reliable and has detected many alarms since it has been fielded (see chapter five for more details). However, there are several issues that were not fully addressed in the initial development of the ADC. These issues are discussed below by evaluating the current Task Layer.
Capability
The ADC described earlier is able to detect only threshold condition alarms from a single parameter. However, in many situations, important alarms involve events detected from more than one parameter and also involve more than simple threshold conditions. The complexity of this type of events depends on the number of parameters to be monitored, the event definition for each parameter, and the way in which these single-channel events need to be combined to define a clinically significant alarm. In addition to event detection, the other equally important matter is the way by which users have to be notified once an event has been detected. User notification methods can be real-time notifications— i.e., an alarm is sent whenever alarms are detected, and archive notifications—for future research purposes. As mentioned above, the ADC does not support real-time notification methods since it keeps all the alarms in text files and does not send them to users via email until setup time. To handle real-time alarms, the Task Layer should be able to use other notification methods such as paging beepers or updating screens via Graphical User Interfaces (GUIs).
Expandability
The ADC has been originally designed as single component software. In every software development cycle, applications have to be modified to add to or improve their functionality.
After that, they must be redistributed to give users access to the new functionality. However, the redistribution process itself is not easy to perform in a real-time system because the running
ADC must be stopped before the modifications can be deployed. Suspending the current ADC potentially results in losing information and missed alarms.
In addition, modifying the applications is often error-prone since the process invariably introduces new bugs to the application. As such, a better design strategy is to separate monolithic applications into a group of distributed components with restricted interfaces, so only the
modified components need to be redistributed and tested.
Flexibility
To monitor parameters 24 hours a day, the ADC has to run all the time. This is
inconvenient if the ADC has to run on the user’s machine because (s)he needs to keep it running all the time as well. Also, the only way to configure the ADC in the previously described
implementation is to modify text files that are read when it starts. This has two disadvantages.
First, the ADC cannot be reconfigured dynamically. Second, text files may not be the best configuration method for all users. Clearly, the task layer should provide a more flexible solution for its configuration and dynamic reconfiguration.
Performance
The ADC acts as a normal client to the DataServer. Multiple ADC instances running simultaneously force the DataServer to create more threads to handle each ADC (see chapter two). This may downgrade performance of the whole system substantially because monitored parameters may be redundant (i.e., more than one ADC may request the monitoring of the same parameter). Reducing this redundancy helps to retain the real-time performance of the entire system. Solving this problem can be done by creating a separate task that connects to the
DataServer from other tasks, so if users configure redundant parameters, the DataServer needs to send the parameters only once. The whole task layer can thus have only one instance of the part connecting to the DataServer.
Design Decision and Architecture
Based on the observations and requirements discussed above, the revised Task Layer is divided into several components. The main functionality of these components is
1. Acquisition of data from the DataServer 1.2.User Interface
1.3.Events Monitoring and Alarm Detection
In addition, to cope with the complexity of notification methods and multiple-parameter events, the event monitoring part can be divided further into four levels.
1. Single-Source Event Level (SSE Level) 1.2.Multi-Source Event Level (MSE Level) 1.3.Notification Level
1.4.User Interface Client
The Single-Source Event Level works as a normal client of the DataServer (i.e., an instance of the Single-Source Event Level connects to the DataServer and retrieves data from the DataServer through a TCP/IP socket), so the single-parameter event detection algorithms
presented in the last chapter and the code required to communicate with the DataSever can be integrated. The Multi-Source Event Level handles multiple-parameter events by monitoring all related notifications of single-parameter events from the Single-Source Event Level. The Notification Level works with multiple clients acting directly with the users. The users specify required events, recipients, and notification information to the notification level via the User Interface Client. All three levels run concurrently as long as there are events to be monitored.
Users can define their own events with customized clients and close the client program or turn off their computer if they do not want to be notified via their application. Other alarm
notification methods, such as email or paging beepers, are kept in the Notification Level, thus the users do not need to stay in front of their computer to be notified. Figure 15 shows the
architecture of the new Task Layer called the AlarmServer
The first two levels are currently implemented in C++ as Component Object Model (COM) out-of-process servers. COM specifications which embody several successful programming concepts such as Object-Oriented Model, Client/Server Model, and Dynamic Linking Library, help to simplify the process of distributed application development. COM objects can be implemented in many programming language. Also, C++ with the Active
Template Library (ATL) has been selected to speed the development and eliminate unnecessary coding. More details about COM/DCOM and ATL can be found in [38, 39, 40, 41].
Figure 15: The Task Layer architecture with three separated levels and client applications
Notification Level
DataServer
Single-Source Level Multi-Source Level
Client1 Client2
BP >
100
ICP > 15, 20 min;
>35 (AND(GT(ICP 15
20) (GT(BP 100 0)))
CPP <
80 AND(GT(ICP 15
20) (LT(CPP 80 0))) email user@
If ICP > 15 for 20 min. and BP > 100
page 555 If ICP > 35 and CPP
< 80
TCP/IP Multiple-parameter event notification
Single-parameter event notification
Multiple-parameter event configuration
Single-parameter event configuration
Single-Source Event Level (SSE Level)
The main functionality of the Single-Source Event Level is similar to the ADC discussed in the last chapter. The Single-Source Event Level communicates directly with the DataServer via TCP/IP Socket. In other words, the Single-Source Event Level subscribes to required parameters, receives data, and monitors the raw data.
Requirements
The set of classes in the Single-Source Event Level provides the following functionality.
- Connect to the DataServer via TCP/IP Socket
- Subscribe and unsubscribe to required parameters. If more than one client needs the same parameter, the Single-Source Event Level subscribes to the parameter only once.
- Acquire data from the DataServer in real-time.
- Provide an interface to the Multi-Source Event Level to enable the Multi-Source Event Level to setup required single-parameter events.
- Notify components when events occur through a call-back interface.
The design of the first ADC was rather inflexible. As a consequence, modifying or adding monitoring or processing algorithms was a demanding task. The design and
implementation of the SSE Level were influenced strongly by the need to support modification of low-level detection algorithms without impacting other levels in the AlarmServer.
Implementation Communication
Since the DataServer is able to communicate with other components through TCP/IP sockets, the Single-Source Event Level to DataServer communication is coded in C++ using Winsock2 API. Also, distributed objects method calls based on DCOM from Microsoft is the technique used to communicate with the Multi-Source Event Level. The Single-Source Event Level has public programming interfaces which DCOM clients can use to communicate.
DCOM
Components in the SSE Level reside in an out-of-process COM module so that the components can exist independently even when there is no client running. Another important issue is the development method. Graphical user interface is not a critical necessity at this level, and Microsoft provides speedy and simple ways to create COM objects with ATL. Therefore, ATL has been used to develop SSE Level COM objects instead of MFC COM and generic C++.
The Standard Template Library (STL) is also used as a substitute for MFC collection classes.
Clients can communicate with the SSE Level only through a set of DCOM interfaces.
The SSE Level has to be able to handle multiple clients at the same time, so the Multithreaded Apartment Model has been used. In addition, when events have been detected, the SSE Level notifies the client via COM interfaces as well. Connecting Objects techniques are used to provide this functionality.
Inside the Single-Source Event Level The CSSEManager Class
Several classes are created to handle the aforementioned functionality at this level. The most important one is a CSSEManager. Components in the Multi-Source Event Level can communicate with the SSE Level through ISSEManager interfaces implemented by the CSSEManager. The set of interfaces used in the SSELevel is shown below.
interface ISSEManager : IUnknown {
[helpstring("method SetupThresholdEvent")] HRESULT
SetupThresholdEvent([in] ThresholdInfo SSEInfo, [in] EventObjID SSE_ID);
[helpstring("method DeleteEvent")] HRESULT DeleteEvent([in]
EventObjID SSE_ID);
};
interface ISSEProcess : IUnknown {
[helpstring("method ProcessParam")] HRESULT ProcessParam();
};
interface INotifySSE : IUnknown {
[helpstring("method NotifySSEState")] HRESULT NotifySSEState([in]
EventObjID SSE_ID, [in] EventState State);
[helpstring("method CheckSSEObj")] HRESULT CheckSSEObj([in]
EventObjID SSE_ID, [out] int* Check);
};
![Figure 1: Architecture of SIMON-RTS [10]](https://thumb-ap.123doks.com/thumbv2/123dok/10730978.0/10.918.122.788.296.768/figure-1-architecture-of-simon-rts-10.webp)
![Figure 2: SIMON-WEB system architecture and relationship to the clinical information system (CIS) [10]](https://thumb-ap.123doks.com/thumbv2/123dok/10730978.0/11.918.180.724.144.586/figure-simon-web-architecture-relationship-clinical-information-cis.webp)
![Figure 3: The architecture of the SIMON system as fielded in the CCU [10]](https://thumb-ap.123doks.com/thumbv2/123dok/10730978.0/12.918.136.799.105.634/figure-3-architecture-simon-fielded-ccu-10.webp)
![Figure 4: The Revised SIMON multi-layer reference architecture [17]](https://thumb-ap.123doks.com/thumbv2/123dok/10730978.0/13.918.161.754.453.683/figure-revised-simon-multi-layer-reference-architecture-17.webp)