Distribution or sale of any portion of this work (including on the World Wide Web) will destroy the integrity of the work and is not permitted. The official site for the distribution of the modules is http://www.engin.umich.edu/-cre/icm. Note: Achievement number is only given if the student completes the interaction portion of the module.
It helps the student to understand critical thinking and creative thinking, which are the two main goals of the course. The homogeneous reaction rate rA is defined as moles of A formed per unit volume of the reactor per second. It is used in some stages of the manufacture of neruly all industrial products It is used in the manufacture of any other strong acid.
Changing a -+ Increasing 'a' reduces the amplitude of ripples in the graph. It reduces the effect of the sine function by adding to the baseline. Changing Vo -+ As the value of Vo increases, the graph changes to a "shifted sin curve" and as Vo decreases, the graph changes to a smooth rising curve. We also know that FA = CAVO and FAo = CAOVo, CAO = FAoI Vo = 0.5 mol/dm3 By substituting the values in the above equation, we get,.
Volume of PFR is the same as the volume for a CSTR since the rate is constant and independent of concentration. No preheating of the benzene feed with the reaction rate and therefore fewer conversions WILL be achieved.
CDPI-A (a)
CDPI-A(b)
CDPI-A (c)
CDPI-B
Solutions for Chapter 2 - Conversion and Reactor Sizing
In problems that have a dot in conjunction with AA, this means that one of the problems, either the problem with a dot or any of the alternates, is always assigned.
FAD 3
Two PFRs in parallel with the feed divided equally between the two reactors, FANEW/-rAXI = o.5FAOI-rAXI. Since the flow is split equally between the two reactors, the total conversion is the average of the CSTR conversion (part C) and the PFR conversion (part D). The metabolic rate, -rA, is the same for mother and baby, so if the baby hippo eats half of what the mother eats, then Fao(baby) = Y2 Fao(mother).
Since stomach volume is proportional to the age of a baby hippopotamus, and the volume of an infant's stomach is half that of an adult, a baby hippopotamus is half the age of an adult hippopotamus. Assuming that, like the stomach, the volume of the intestine is proportional to age, the volume of the intestine would be 0.75 m3 and the final conversion would be 040. 60. The volumes of the PFR and CSTR will be the same because the rate is constant across this conversion range.
FAOX
CSTR 0.60
CSTR
X 2 -OAO
P2-8 (a) FsoX
To achieve 80% conversion with a CSTR followed by a CSTR, the optimal setup is a CSTR with a volume to achieve about 45% conversion, or the conversion corresponding to the minimum value of 1I-rs. Next is a PFR with the necessary volume to reach 80% conversion after the CSTR. For two CSTRs in series, the optimal setup would still include a CSTR with the volume to first achieve a conversion of about 45%, or the conversion corresponding to the minimum value of 1I-rs. And since Cc gets very small and approaches 0 at X = 0, 1/-1s should increase with Cs (or X decrease). This is what is observed at small values of X. At intermediate levels of Cs and X, these driving forces are competing and why the curve of 1/-rs has a minimum.
The minimum amount of catalyst required to achieve 80% conversion in a CSTR and PBR connected in series and containing equal amounts of catalyst can be calculated from the figure below. This figure shows that the least amount of catalyst is used when the CSTR precedes the PBR. Calculate the amount of catalyst required to achieve 80% conversion using a single CSTR by determining the area of the shaded region in the figure below.
The weight of CSTR catalyst required to achieve a 40% conversion can be obtained by calculating the area of the shaded rectangle shown in the figure below. The weight of catalyst required to achieve 80% conversion in a PBR is found by calculating the area of the shaded area in the figure below. The amount of catalyst needed to achieve 40% conversion in a single PBR can be found by calculating the area of the shaded region in the graph below.
CDP2-A(a)
A useful heuristic is that for curves with a negative slope it is generally better to use a CSTR. Similarly, when a curve has a positive slope, it is generally better to use a PBR.
CDP2-A(b)
CDP2-A (c)
CDP2-A (d)
CDP2-A (e)
CDP2·A (f)
The speed of action on this problem is extremely low and the flow rate is quite high. To achieve the desired conversion would require a reaction of geological proportions (a CSTR or PFR about the size of a Los Angeles basin) or, as we saw in the case of a batch reactor, a very long time. The minimum volume is also achieved by tracking the PFR with the CSTR. In this case, the area under consideration would be the rectangle bounded by X =0.3 and X = 0.
CDP2-C (C)
CDP2-C (d)
CDP2-C (e)
CDP2-D
CDP2-D (a)
CDP2-D (C)
CDP2-D (1)
CDP2-D (h)
Constant Temperature and Pressure No heat effects
CDP2-E
CDP2-F (a)
CSTR followed by the PFR 2. PFR followed by the CSTR
PFR --+ CSTR
CDP2-F (b)
CDP2-F (C)
FAo(Area)
CDP2-F (d)
CDP2-F (e)
CDP2-F (1)
Solutions for Chapter 3 - Rate Law and Stoichiometry
- V - vo(1+eX) - (1-0.33X) Fe FAoX 0.092(X)
To calculate biomass yields, you must first balance the reaction equation by finding the coefficients a, b, c, d, and e. Once all the coefficients are found, you can then calculate the yield coefficients by simply assuming the reaction goes to completion and calculating the final cell mass. To find the equilibrium conversion, set -rA = 0, combine stoichiometry and the rate law, and solve for Xe.
C =NA =NAO (1-X)=C (I-X)
CDP3-A
CDP3·B
CDP3-C (a)
CDP3-C (b)
CDP3-C (C)
CDP3-D
CDP3-E
CDP3-F
CDP3-G
CDP3-H
FAOU-IJ
CDP3-I
FCA}
CDP3-J
CDP3-K
Solutions for Chapter 4 - Isothermal Reactor Design
- lO3 atm . 60ft 2
- dX = (0.07dm 3 /mallmin)(lmall dm 3 )2(800dm 3 )
Now plot the natural log of the cooking time against liT b and get a linear relationship.
O.90)Xeq::: 0.47
2 Reac:or 2
The CSTR is created on the bend due to back mixing, so the effective PFR arrangement is in series with the aCSTR.
CAOX
The graphs should look the same as part (f) because reactor volume is not in the constant volume batch reactor design equations. Gaseous reactant in tube reactor: A ~ B. for inter.egratitJll, see Appendix A) of Idea.l (assumption only. Take advantage of the fact that two PFRs in series are equal to one PFR by the volume of both combined.
Efficiency = V PFR I V CSTR = 1 from the problem statement, which is not possible because the conversion will not be the same for CSTR batches as for PFR batches. The lower conversion is achieved due to balance. Also, the reverse reaction begins to outpace the forward reaction near the reactor exit. Since no side reactions occur at the temperature at which the reactor operates, the fastest reaction path will take place at the highest flow rate A (2 mol/min or 120 mol/hour).
More A can be added to the reactor to keep the reaction rate high as the concentration of B drops, but adding twice the volume needed would be a waste of time and material (in addition to being physically impossible. If two batches are used, then there will be 9 hours of rest, which means that the time for the reaction will be 15 hours - divided between the two groups, with a maximum reaction.
A maximum of 1257 mol C can be formed if time is evenly distributed over each batch (3.5 hows). Refer to the Polymath code in part (a) and vary the time and flow rate. Because the concentration of A must be kept low, it makes sense to slowly add A to a large amount of R. Therefore, we start with pure B in the reactor. We need to check whether the reactor can handle this volume if only one batch is used per day.
Since we add 1800 dm3 or 18 m3 and the reactor has a volume of 4.42 m3, we can safely run a single batch per day and achieve the required ethanol production. Now vary the initial amount of B in the reactor, the flow rate of A, and the temperature to find a solution that satisfies all the constraints. To represent the flow rate down the reactor, we need the differential mole balance for the three species, noting that BOTH A and B diffuse across the membrane.
The setup is the same as in part (a), except that there is no transport out the sides of the reactor.
From Chapter 12 we see that k will increase as Dp decreases_ We also know that for turbulent flow. We also know that alpha depends on the cross-sectional area of the tube: a - ._--I. If the inlet mass flow rate is held constant, then increasing the pipe diameter (or cross-sectional area) will result in lower surface mass velocity.
This means increasing pipe diameter will have the same trends for pressure drop and conversion, but will result in smaller changes. It is better to have a larger diameter pipe and a shorter reactor, assuming the flow remains the same as through the smaller pipe. The flow rates have changed and so the mole balance on species A will change slightly.
Since species B is added to two different reactors, we will also need a mole balance for species B. The stoichiometry has not changed, so -rAi = --lBi and the reaction is a liquid phase with constants V and v. We add more B feed to this reactor so that V2 = Vo + VBO = 20.
CDP4-A
CDP4-B
CDP4-C
CDP4-D
CDP4-E
CDP4-F
CDP4-G o o
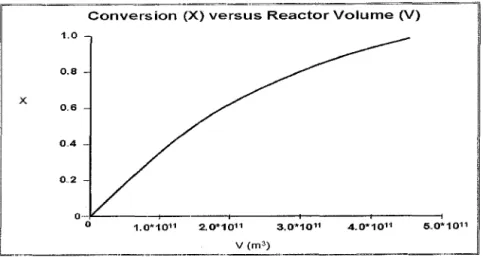
Using polymath, the following graph is obtained: c) Increasing the value of k increases conversion, while decreasing it decreases conversion. Increasing the height will only slightly increase conversion and decreasing the height causes a very small decrease in conversion.
CDP4-H
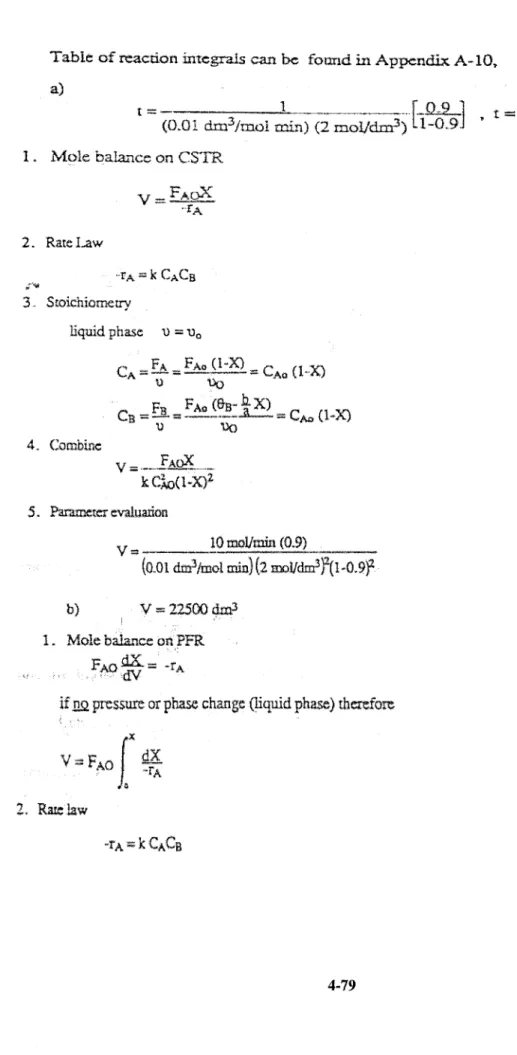
Parameter evaluation
Ratelaw
CDP4-I (a)
4K, Combine
Taking into account the time required to clean the reactor and other down times, the total time per run is assumed to be 4 hours. Assuming the reactor can be used twenty-four hours a day, six runs can take place in a day.
CDP4-J
CDP4-K
Where E is a function of mass flow rate, the feed characteristics and catalyst PIO% are constant for part (a). B and leo must first be chosen at random. Depending on whether POLTh1ATH gives high or Im v values of '/ and X, one Cffi1 converges to the true values of }~ and B.
CDP4-L