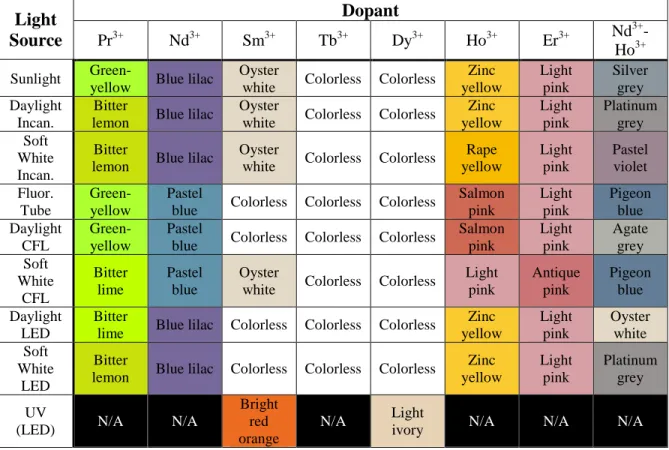
The determination of the standard color of each sample under each light source was done by a RAL color standard wheel. It should be mentioned that, although standardized, the color assignments are still only approximations of the true color of the samples. Using a special type of film over the camera lens, spectra of the various light sources were photographed.
Most samples showed no photochromism and remained relatively the same color under all lighting conditions. Because one of the samples was doped with both Nd3+ and Ho3+, it was expected that that sample would also exhibit photochromic properties; however, the sample remained a neutral blue-gray for the most part without any drastic color changes. When we looked at the photos of the light spectra, most showed the standard, continuous rainbow gradient from red to violet.
When under fluorescent lights, the light does not emit the wavelengths needed for the red-violet color of Nd3+. Since the sample containing Nd3+ and Ho3+ contained the same amount of 2 g of dopant as the other samples, it contained only 1 g of each of the individual oxides. Professor Angus Powers and the Alfred University hot glass studio for making the System 96® glass used in the fabrication of the samples.
This, in conjunction with very narrow discrete absorption spectra of some rare earth elements, accounts for the glasses' photochromic qualities.
Introduction
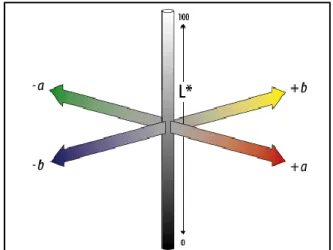
In other systems, such as RGB, brightness is determined based on the relative proportions of the three defining colors.
Experimental Procedure
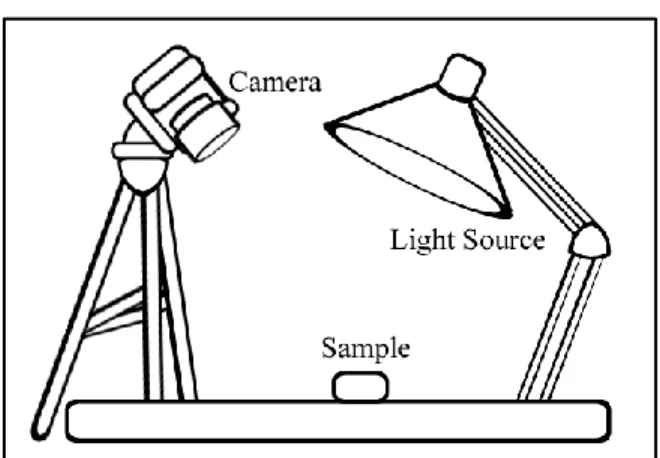
We installed the aforementioned camera on a stand above the sample; the architect's lamp was placed just outside the camera's field of view. This was done so that the sample would be directly exposed to the light while preventing the camera from casting a shadow. With the exception of sunlight, fluorescent tube, and UV "black light," samples were photographed in this manner under all types of lighting.
The fluorescent tube was the source of the room's ambient light and therefore did not require the use of the architect's lamp. Similarly, the UV “black light” condition was accomplished using a UV flashlight consisting of nine “black light” LEDs. In each of the three cases, the tripod and the sheet of paper background were still used.
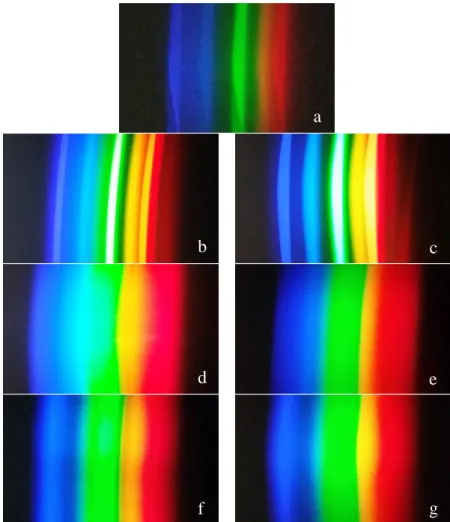
The UV "black light" did not provide bright enough spectral lines for them to appear in a photograph. To photograph the other sources, a black piece of cardboard with a narrow slit in it was placed between the camera and the light source. The emission spectra were then photographed by placing an Edmund Scientific Co., 1000 lines/mm linear diffraction grating over the lens of the camera.
Due to a lack of similar colors within the RAL scale, Pr3+ samples were categorized using Hex scaling3. Initially, it was intended to achieve this by white balancing on the camera itself, using the white sheet of paper as a reference. However, due to unknown malfunctions within the camera, this was not possible and alternative measures were taken.
The corrected images can be seen in Figures 12-19 in the Appendix; while the raw images can be seen in Figures 20-27 in the Appendix. Correcting the images also generates a relatively standard white background, and allows one to compare the colors side by side with little interference from the color of the cast light. Raw images are included to show the color emitted by the light source, which can be clearly seen when looking at the color of the "white" background.
Results
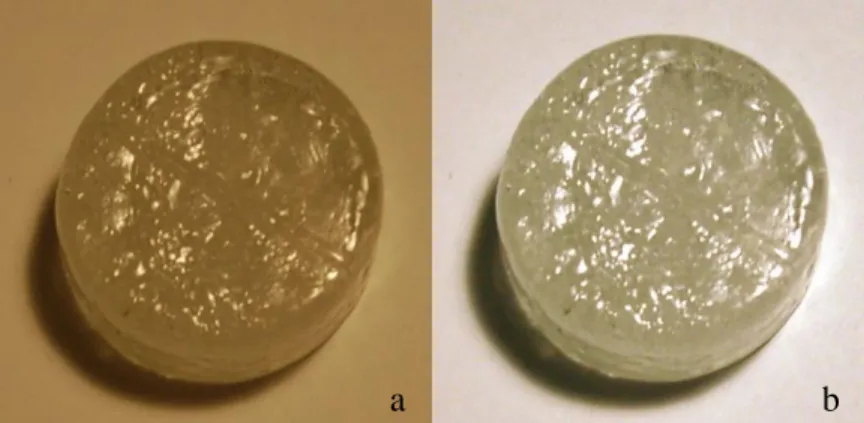
In the raw Tb3+ images shown in Figure 23, it is clear that the coloration of the sample appears to be different under each lighting condition. Therefore, any perceived color in the raw images is due to the camera's detection of the color cast by the light itself. In comparison, the corrected images in Figure 15 are more accurate for the observed staining of the sample.
While there is still a definite difference in color, especially with soft white lamps with warmer tones, it is reduced with correction. The staining is so light that, by itself, it is difficult to tell whether the sample itself is a yellow color or is colorless with a yellow cast from the above-mentioned sources. However, if compared to the Tb3+ sample, it becomes clear that there is indeed a difference in the staining of the two samples.
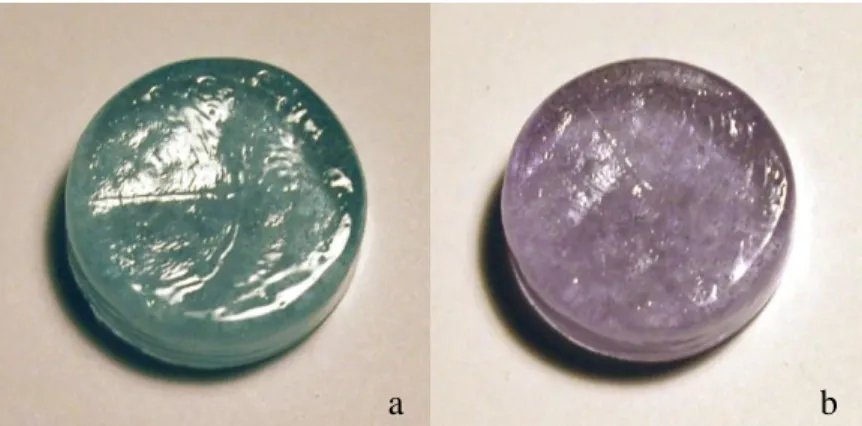
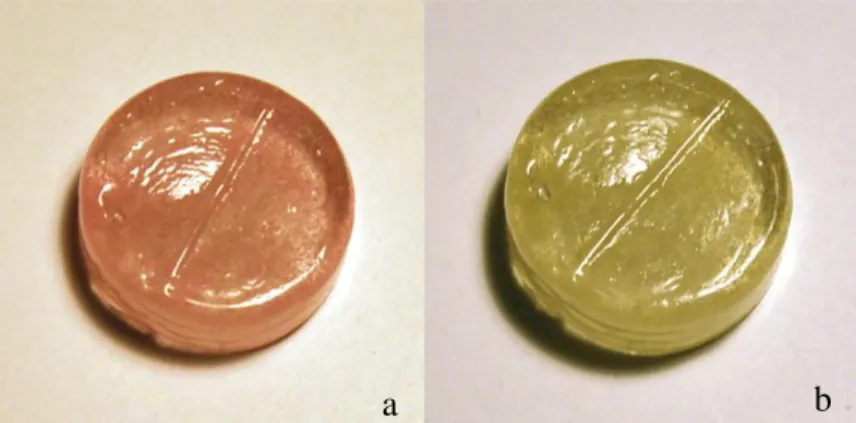
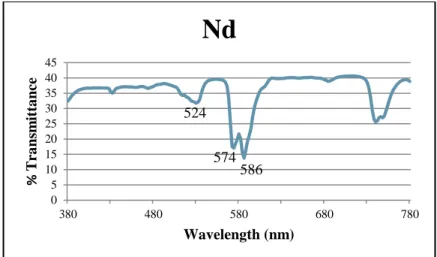
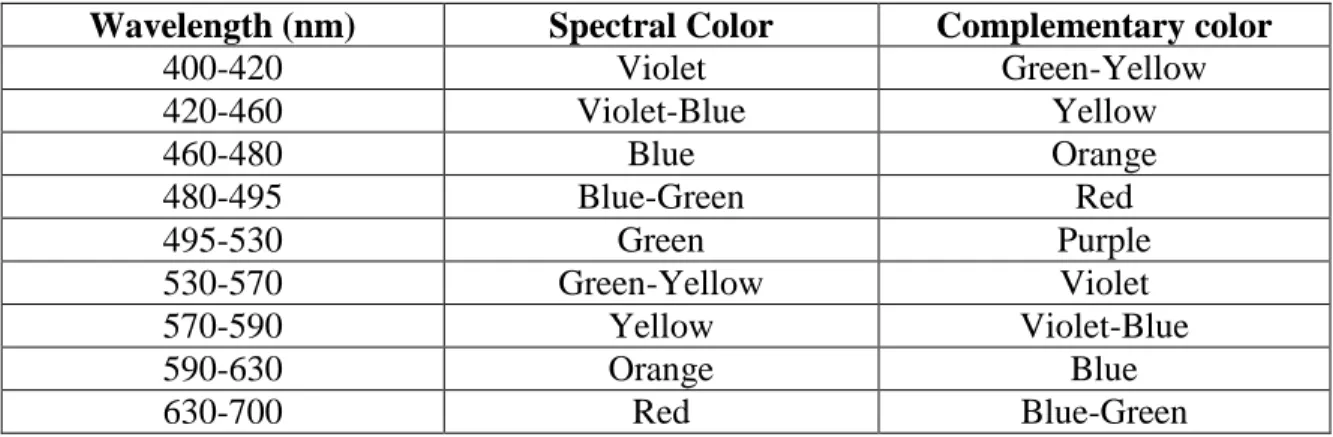
Spectral analysis of the sample revealed three main absorption peaks within the visible spectrum (Figure 5). The peaks at 574 nm and 586 nm show the absorption of yellow light, resulting in the observation of a violet-blue color. Also, the pattern only changed under fluorescent light; it appears as a rose gold color in all other lightings, then changes to a salmon pink.
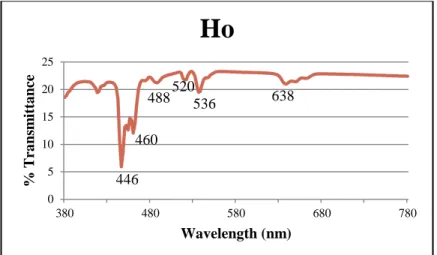
There are two absorption peaks in the violet-blue range, 446nm and 460nm, which add yellow to the observed color. absorbs in the blue-green, provides red. Surprisingly, there are also two green-yellow peaks, 520nm and 536, resulting in purple and violet contributions; as well as a red peak at 638nm, which adds blue-green to the mix. Instead, it produced different shades of blue-grey; with Neodymium's cool colors slightly overpowering the warm colors of the Holmium.
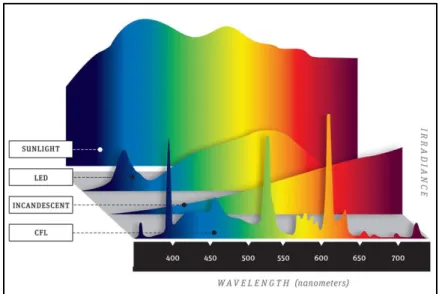
Furthermore, there was no discernible pattern in the changing tones as there was with the two component dopants. Photographs of emission spectra for fluorescent, incandescent, and LED sources are collected below in Figure 8. The spectra are more discrete than for the other two types of light; .. which has significant gaps in the range of visible light.
Discussion
The fluorescence graph also agrees with the photographed spectra; showing narrow spikes of light at wavelengths that match the discrete emission spectra. Because of their location in the periodic table, rare earth elements are dominated by valence electrons in the 4f shell. Because the filled 5s and 5p shells shield the 4f orbital, the environment in which a rare earth ion is placed has very little effect on the spectrum the ion generates.
This makes rare earth oxide glasses more susceptible to gaps in emission spectra than glasses doped with transition metal oxides. While rare earth ions have d orbitals as well as f orbitals, 4f-4f transitions are the only ones needed to study the cause of color. Therefore, a glass must be doped with more rare earth oxide to achieve the same saturation as if it were doped with a transition metal oxide.
Another possible explanation is wavelength cancellation; seen in other rare earth ions such as Er3+. The combination of the Nd3+ spectrum and the Ho3+ spectrum may have caused a similar cancellation in the resulting Nd3+-Ho3+ spectrum. Research in the professional literature confirmed that two main peaks are responsible for the coloration of the Nd3+ sample.
The first is a peak at 521nm in the green region of the spectrum which is in good agreement with the experimental peak at 524nm; resulting in the reddish-purple portion of the sample's color. Therefore, none of the purple color is present while the sample is under fluorescent lighting. The Ho3+ spectrum consists of two main peaks at 535nm and 447nm, which correspond to the experimental peaks at 536nm and 446nm.
The blue-green color of the 641 nm peak is normally neutralized by the red, orange and yellow hues of the complex band around 465-481 nm1. The yellow contribution from the 447 nm and 465 nm peaks overlaps a gap in the spectrum, as does the blue-green contribution at 641 nm. The remaining peaks at 481 nm (red) and 471 nm (orange) and part of the 535 nm peak (violet) together form a salmon pink sample under fluorescent lighting.
Conclusion
Bubbles and suboptimal polishing due to human error may have caused some absorption peaks to appear broader and shallower. In addition, the RAL color wheel contains the final palette of colors; standards found best approximations rather than the exact observed color for each sample. An additional level of difficulty was the fact that the colors matched the transparent color patterns of the glass, making it difficult to determine the exact color if there was total opacity.
Since the RAL scale is not a sufficient approximation of the color of the Pr3+ sample, a hexadecimal scale was required. However, since the hex color standard was observed online and not in a tangible form like the RAL color chart, it may differ from the physical hex color.
Future Work
Appendix