Dr. Ummi Naiemah Saraih (University Malaysia Perlis, Malaysia) Dr. Mohd Suberi Ab.Halim (University Malaysia Perlis, Malaysia) Engr.Dr.Mohammad Harith Amlus (University Malaysia Perlis, Malaysia) Dr. Tuanku salha Tuanku Ahmad (University Malaysia Perlis, Malaysia) . Prof. Dr. Yoshifumi Harada (University Malaysia Perlis, Maleisië) Dr. Suhairimi Abdullah (University Malaysia Perlis, Maleisië).
3 IDEA Algorithm
Key Generator
Encryption-Decryption Process
Diffusion spreads plaintext structure into ciphertext so there is no statistical correlation between them. It prevents cryptanalysis.
4 Digital Signature
Prosiding 1st International Joint Indonesia-Malaysia-Bangladesh-Ireland Conference 2015 University of Ubudiyah Indonesia, 27-28 April 2015, Banda Aceh, Indonesia. Prosiding 1st International Joint Indonesia-Malaysia-Bangladesh-Ireland Conference 2015 University of Ubudiyah Indonesia, 27-28 April 2015, Banda Aceh, Indonesia.
5 Digital Signature
Functionality of System
Data Flow Diagram
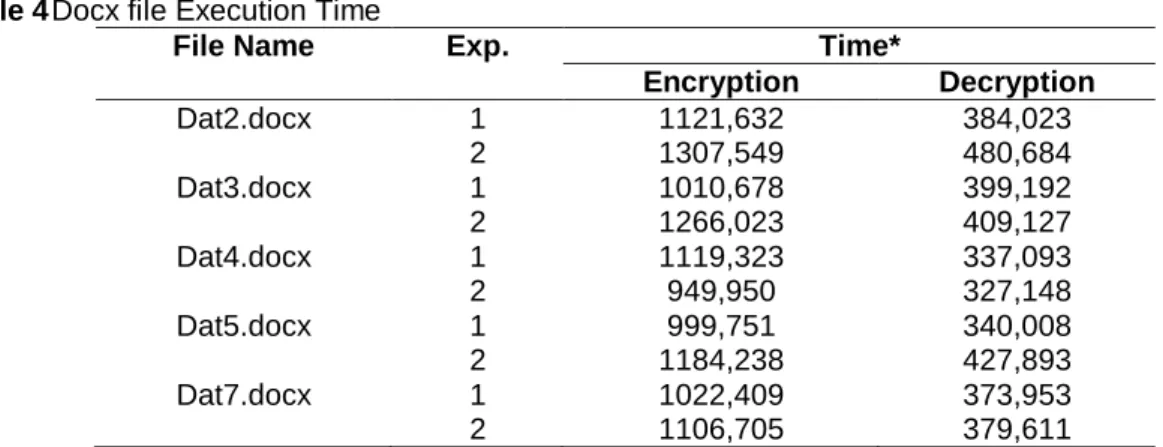
6 Experimental Result and Analysis
- Execution Time Experiment
- Avalanche Effect Experiment
- Accuracy Experiment
- Beta Testing
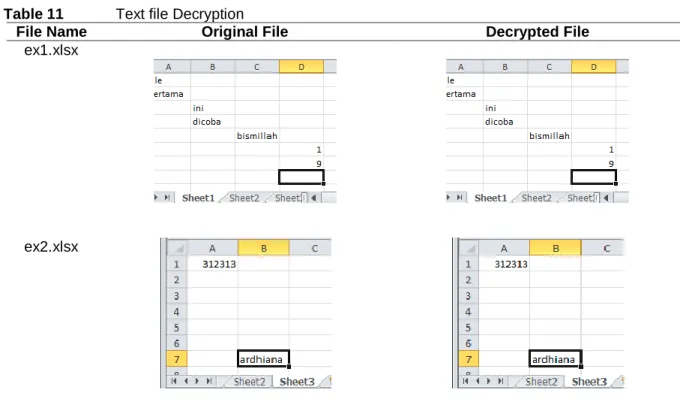
This is because the binary file of .docx file is including the default format of Microsoft Word. All the text formatting in the original file is also done in decrypted file.
7 Conclusion
8 References
Prosiding 1st International Joint Indonesia-Malaysia-Bangladesh-Ireland (IJCIMBI) Conference 2015 Universitas Ubudiyah Indonesia, 2015, Banda Aceh, Indonesia.
Analysis and Design of Document Delivery Security System
Encryption and Decryption Digital Signature using Digital Signature Algorithm (DSA)
1 Introduction
2 Basic Theory
- Cryptography
- Digital Signature [5, p.241]
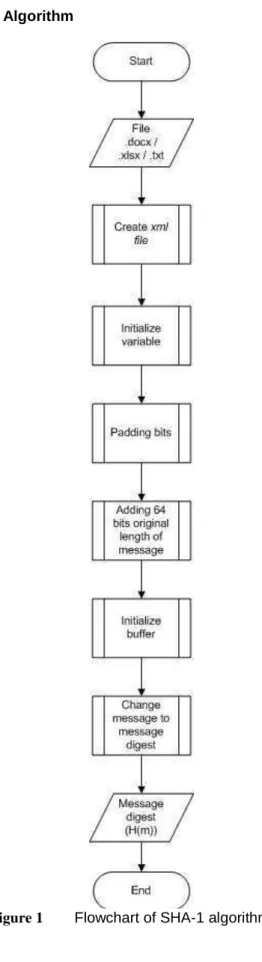
- Secure Hash Algorithm-1 (SHA-1) [7]
- Digital Signature Algorithm (DSA)
- OpenSSL [2]
- Discrete Logarithm Problem (DLP) [4]
A digital signature is a cryptographic value that is a set of bits associated with a message and a sender. DSA requires the use of private or public key pairs to generate a digital signature and generate verification against a specified set of domain parameters.
System Design
- General Groove of System
- Flowchart of SHA-1 Algorithm
- Flowchart of Generating Digital Signature
OpenSSL does not enforce the 1024-bit upper limit, but it is not a good idea to use a prime larger than 1024-bit—many programs may not be able to use the keys resulting from such a large prime . The g member is the result of a mathematical expression involving a randomly chosen integer, as well as p and q [2, p.196].
4 Implementation and Testing
System Implementation
Security Testing
Result of SHA-1 Timing Process
Result of Generate Parameters Timing Process
Result of Generate Digital Signature Timing Process
Result of SHA-1 Accuracy
Result of Document Validity
5 Conclusion
Design of Operational Amplifier with Common-Mode Feedback Circuit for Pipeline ADC Application
1 Introduction
2 Design constraints
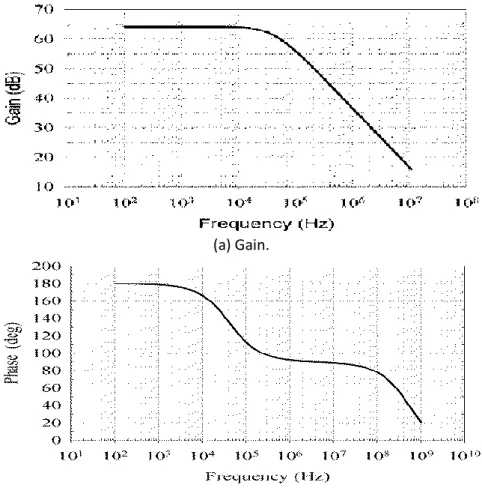
Gain
Unity gain bandwidth
Phase Margin
Slew rate
3 Design Implementation
As referred in Figure 2, M12 is assigned to be a feedback to the folded cache code op-amplifier while M13 and M14 are input of CMFB which attaches to the output of folded cache code op-amplifier and represent M15 as a reference voltage. The modification is based on M12 because it needs a stable voltage to feed the folded cascode op amp.
4 Result
A CMFB circuit (M12-M16) is designed to fix the voltages at the high-impedance node to the desired voltage value for CMRR performance, while ensuring the stability of the common-mode voltage for the fully differential op-amp. The comparison for folded cascode op-amp performances between previous works is summarized as in Table 3.
6 References
Proceeding of The 1st International Joint Conference Indonesia-Malaysia-Bangladesh-Ireland (IJCIMBI) 2015 Universitas Ubudiyah Indonesia, 2015, Banda Aceh, Indonesia. 2014), Low Power Folded Cascode CMOS Operational Amplifier with Common Mode Feedback for Pipeline ADC, International Integrated Engineering Summit Conference. A wide gain bandwidth CMOS fully differentiated folded cascode amplifier, International Conference on Electronic Devices, Systems and Applications, 165-168.
EEG Signal Identification Based on Regression Coefficients Analysis Using BackPropagation for Brain Computer Interface
- Introduction
- Materials And Methods
- Data Set Description
- Regression Simple Regression
- Features Extraction Using Regression Methods
- Identification using Neural Network BackPropagation
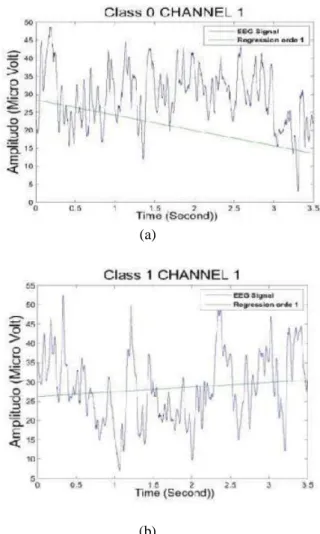
- RESULT
- CONCLUSIONS
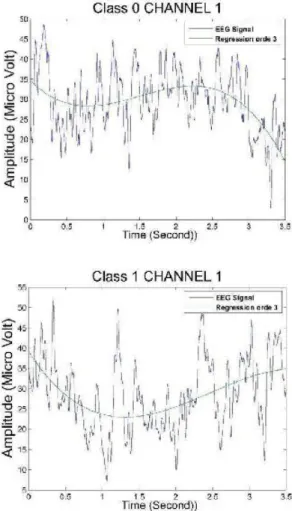
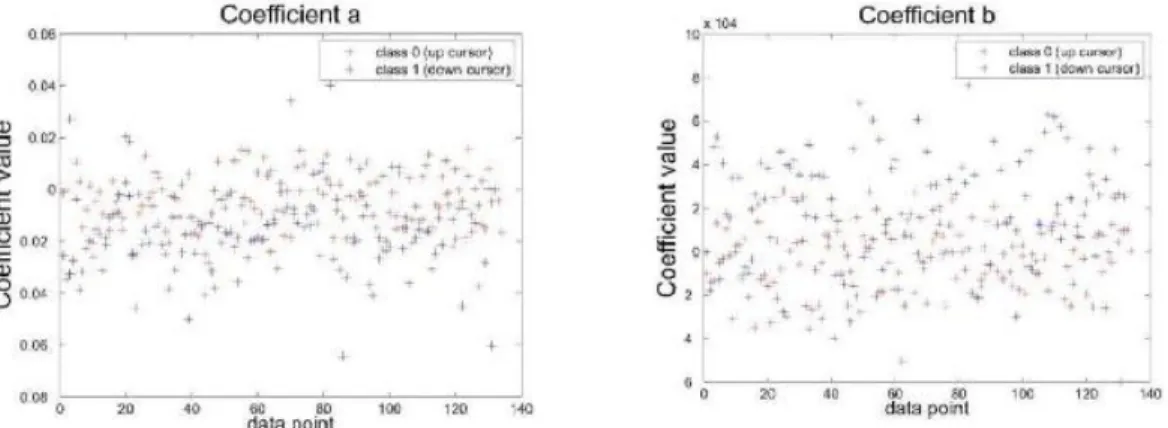
In Figure 3 shows that the results of regression order 3 have the shape according to the pattern of EEG signal for class 0 and class 1. The results of regression order 1 are coefficients a and b value taken from the training data.
CONFORMITY TOOL FOR LAND EVALUATION IN ANDROID MOBILE APPLICATION
ABSTRACT
- I NTRODUCTION
- THE THEORY OF LAND EVALUATION BY FAO
- P REPARE Y OUR P APER B EFORE S TYLING 1. Ruled Based System
- The Rules in Conformity Tool for Land Evaluation
- S CREENSHOT OF A PPLICATION
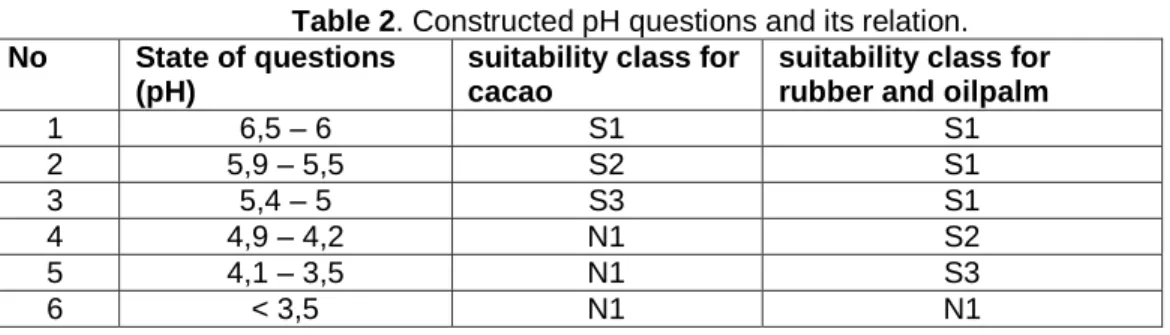
Therefore, this article focuses on the development of the mobile application as a compliance tool for land suitability evaluation. Units are land suitability unit level is further division of the sub-class based on the size of the limiting factors.
C ONCLUSION
Proceedings of the National Seminar on Agricultural Culture, Emergency and Strategy for the Control of Land Function Change. Analysis of the cutting process of environmentally friendly composites from oil palm empty fruit bunch fibers using the rotary saw machine.
Cutting Process Analysis of Environmental Friendly Composites from Oil Palm Empty Fruit Bunch Fibers Using Rotary Saw Machine
Abstract
The area of oil palm plantations in Indonesia for the past 7 years shows a growing trend with approximately per year. In 2012, the total area of oil palm plantations in the province of Riau is estimated at 1.94 million hectares.
2 Material and Method 2.1 Material
Fibers of Oil Palm Empty Fruiy Bunch (1) Procurement of raw materials
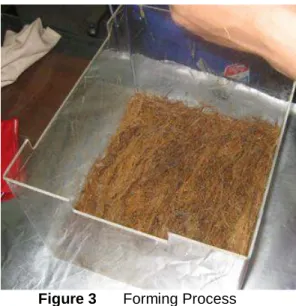
Prepregs will be hot pressed using a hydraulic press machine and the parameters as follows - Duration: 30 minutes. His cutting process is a subject of this research where the cutting results using GUILLOTINE cutting machine would be compared with using a rotary saw cutting machine.
3 Conclusion
The electrical energy consumption of each rotary chainsaw is recorded and will be compared between Z. According to the determination coefficient (R2), it appears that the equation in the polynomial approach fits as the closest equation that can reflect the current cutting process using a rotary saw.
![Table 1 Cutting results by Using Guillotine Cutting Machine, Rotary Cutting Machine with Z=60, 80, 100 [5]](https://thumb-ap.123doks.com/thumbv2/123dok/10205820.0/66.893.114.764.154.459/cutting-results-guillotine-cutting-machine-rotary-cutting-machine.webp)
4 References
However, there is no single standard form of construction contract produced by an economic entity, which will greatly increase the dynamism of this industry. Therefore, this applied research has objectives: (1) to identify the advantages and disadvantages of standard forms of construction contract, (2) to identify challenges in the adoption of standard forms of construction contract in Indonesia, and (3) to propose a model of the standard form of construction contract which is in accordance with the requirements of the Indonesian construction industry.
2 Literature Review
Today, there are many standard forms of construction contracts introduced by professional construction industries from many countries. Another challenge is that there are so many types of construction procurement that require different approaches and different standard forms of construction contracts.
3 Research Methodology
4 Research Findings
The Advantages and Disadvantages of Standard Forms of Construction Contract
Because it is a standard form of construction contract, it is not necessarily suitable for all construction projects. At some level, the use of a standard form of construction contract will reduce the competitiveness of bidders.

The Challenges in Adopting Standard Forms of Construction Contract in Indonesia
- The Compliance with the Indonesian Laws and Regulations
- The Compliance with the Indonesian Construction Industry Practices
- Results
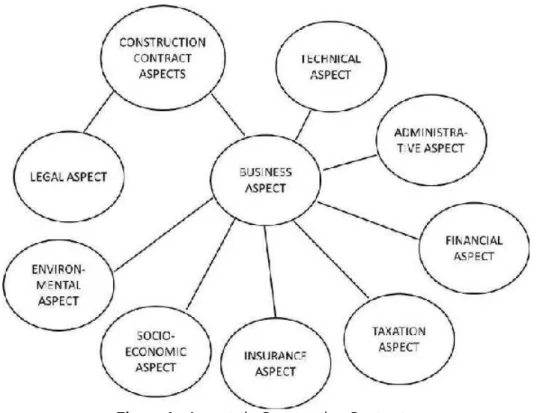
When proposing a model of standard form of construction contract, 2 (two) main aspects must be analyzed. After the analysis is done as mentioned above, a proposed model of standard form of construction contract can be made.
6 References
Since the standard form of construction contract is a new thing to implement in Indonesia, further research can be done and developed. Two of them are the different types of standard form of construction contract in Indonesia and the impacts of the implementation of standard forms of construction contract in Indonesia.
Geospatial Information in Indonesia: Status, Challenges and Opportunities for Establishment, Innovation and Commercialization
In Indonesia, the acquisition, processing, maintenance, dissemination and use of geospatial data and information is coordinated by regulation by the Geospatial Agency of Indonesia (Badan Informasi Geospasial, BIG). The status and challenges in establishing good and reliable geospatial information of Indonesia are presented and discussed below.
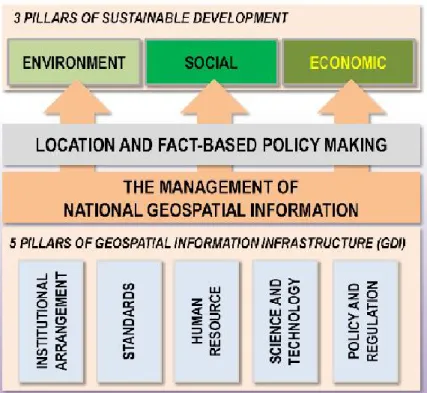
2 Roles of Geospatial Information for Development in Indonesia
DATA INFORMATION
KNOWLEDGE WISDOM
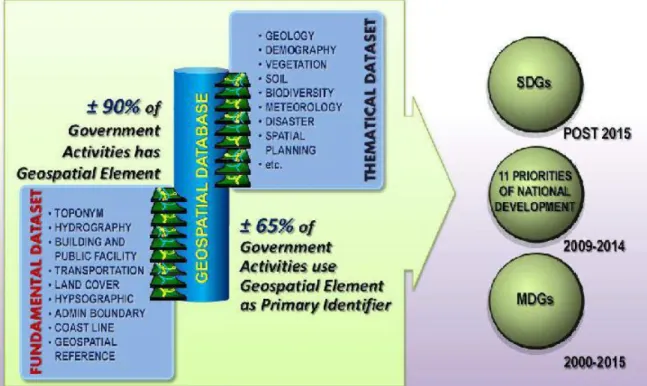
In Indonesia, by regulating the acquisition, processing, maintenance, distribution and utilization of geospatial data and. In general, the sectors/activities in Indonesia where the geospatial data and information will be necessary and required can be summarized in Table 2.
3 Status of Geospatial Information Establishment in Indonesia
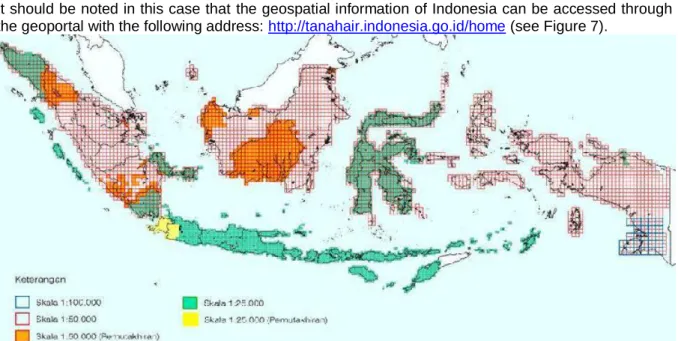
It should be noted in this case that the geospatial information of Indonesia can be accessed through the geoportal with the following address: http://tanahair.indonesia.go.id/home (see Figure 7). Status of national geodetic control network (630 first order geodetic control stations established using GPS surveys); courtesy of BIG.
Link-and-match between the providers and users of geospatial data and information in Indonesia should indeed be improved. Proceedings of the 1st International Joint Conference Indonesia-Malaysia-Bangladesh-Ireland 2015 Universitas Ubudiyah Indonesia, 27-28 April 2015, Banda Aceh, Indonesia. regarding this matter should also be updated to enable more flexible and more effective execution of the geospatial related programs.
This is a good opportunity for geospatial entrepreneurs in Indonesia to develop geospatial industry with various innovation and commercialization initiatives and programs. This is a good opportunity for geospatial entrepreneurs in Indonesia to develop geospatial industry with various innovation and commercialization initiatives and programs.
6 Closing Remarks
Website Asosiasi Survei, Pemetaan dan Informasi Geospasial Indonesia (APSPIG). Berita di situs web Futuregov, http://www.futuregov.asia/articles/5970-indonesia-to-spend-us24-million-on-smart-city-project-in-2015.
PROTOTIPE OF ORDINAL RANK LIST APPLICATION AT PANGKALPINANG HIGH ATTORNEY BABEL
Sujono 1) , Burham Isnanto 2) , Ellya Helmud 3)
I INTRODUCTION
II METHODOLOGY
Data Collecting Methode
System Analysis
- Object Oriented Analysis
- Designing Database
- Process Analysis
- Proposed System
- User Interface
- System Testing
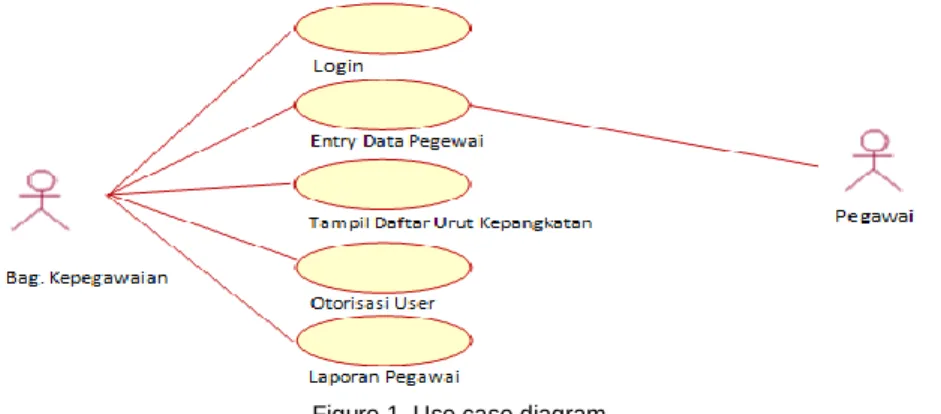
Use Case Diagram, Use case diagrams describe the system requirements from the user's perspective and focus on the automation process. Use case diagrams are used to describe the need and system functionality from the user's point of view based on the analysis performed.
IV CONCLUSION
The FGDs or discussions focused on in this study were conducted by participants who were selected based on the aforementioned criteria. For the purposes of analyzing the test results, further research is inferred based on the results of the FGD.
V REFERENCES
- INTRODUCTION
- EXPERIMENTAL
- RESULTS AND DISCUSSIONS 1 Determination of structure
- Surface morphology
- Optical Properties
- Electrical properties
- Conclusions
The Hall effect measurements show that Ni-doped cobalt oxide is a p-type semiconductor and the carrier concentration is in the order of 1019 cm-8. Carrier concentration obtained for Ni-doped cobalt oxide is of the order of 1019 cm-3, the value increases with the increase in Ni concentration.
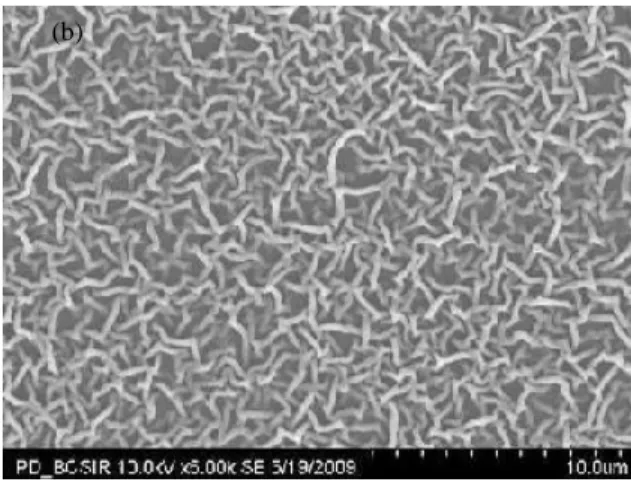
It was found that RH and H decrease but carrier concentration increases with increasing Ni concentration. The results of the optical, electrical and structural measurements were found to be in good agreement with the results obtained on this material prepared by other methods.
Investigation of long term evapotranspiration factor by using Hamon equation and NDVI data in forest area
Investigation of long-term evapotranspiration factor using Hamon equation and NDVI data in forest area. It is simple enough to provide the correction factor and is called an evapotranspiration factor.
2 Study Site
Using the same logic, the similarities between the forest evapotranspiration factor and NDVI showed potential for modeling a factor evapotranspiration as a function of the vegetation index. The objectives of the study were: (1) to develop ways to estimate the forest evapotranspiration factor according to the current ET ratio derived from catchment water balances over the Hamon PET in a range of long-term availability data, (2) to analyze the seasonal amplitude of evapotranspiration factor fluctuations over a long term and (3) to establish the relationship between evapotranspiration factor and NDVI that can be reasonably modeled to provide an effective predictive tool for determining evapotranspiration rates of evaporation in the forest area where weather data is missing.
3 Methods
Hamon PET
Estimation
Validation
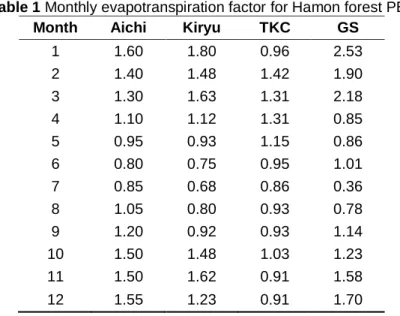
- Monthly evapotranspiration factor
- Fluctuations of GS Monthly evapotranspiration factor
The monthly average and range of the evapotranspiration factor for Hamon forest PET at the GS site are shown in Figure 3. The range of fluctuation in the monthly evapotranspiration factor was large in the winter season (December to March), averaged over 23 years indicates that the standard error of the mean (SEM) was 2.6, respectively.
NDVI Trend
Correlation of Potential Evapotranspiration Factor and Normalized Difference Vegetation Index (NDVI)
The relationship between long-term NDVI data and observed evapotranspiration factor for forest study area on fig-7 was found to be linear, with the correlation coefficient (r) being 0.55 and the proportion of variability (r2) being 0.30 between them. Long-term annual PET estimated from the Hamon methods is correlated with the AET values derived from the water balances.
6 Acknowledgement
This study provides a comparable monthly evapotranspiration factor for Hamon PET during the growing season. The simple linear regression model was developed to establish a general relationship between an NDVI and the evapotranspiration factor of Hamon PET.
7 References
From a macro perspective, less direct runoff during rainfall and no long-term change in baseline flow rate in the rainforest is a good function of the forest watershed. Evaluation of green dam in a forested small watershed with long-term hydrological data and tank model.
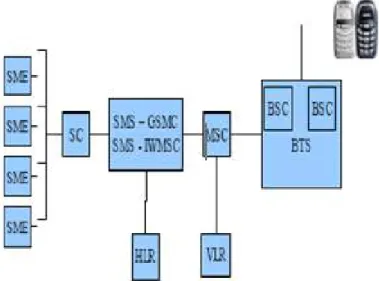
REAL COUNT APPLICATIONS SMS GATEWAY BASED FOR FAST, PRECISE, HONEST, FAIR AND TRANSPARENT ELECTION
In this research we discussed was limited only to receive and send text messages, we developed functions sms delivery via operator according to the user's conditions by number, and we develop automatic response to registration and data delivery real number. Based on problem identification and constraints, these research problems can be formulated as: how to design the application information real count to achieve fast and accurate calculation results, how to use the application real count to create better choices, minimize its time and funds, and what is test FGD- the result with stack holder about this real counting application.
II METHODOLOGY
Not to mention if the communication link in this case the internet is turned off or interrupted in the area or even a power outage. Therefore, in this paper, we upload the concept of SMS-based transaction services that can be used to transfer information about counting results from polling stations to a single database system.
III DISCUSSION
- Proposed Framework
- Analysis And System Design
- User Interface
- Login module
- List form representatives election display
- Server broadcast for all user
- Blackbox Testing
Based on the experiments carried out by the respondents, it will obtain the results of the functional testing of the system according to the needs of the individual user. Based on the results of the focus group discussions, we can conclude that the use of real counting is in accordance with the specification of the functional requirements requested by the user.
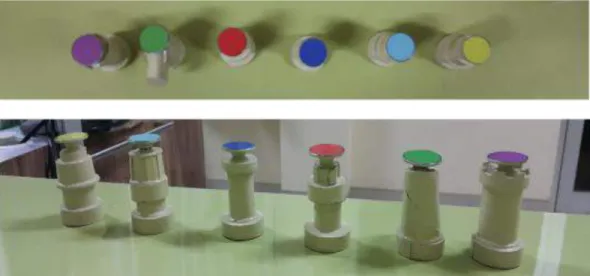
DESIGN AND IMPLEMENTATION OF COLOR TRACKING METHOD ON CHESS ROBOT USING CAMERA
There are two methods used to detect chess pieces, namely sensor board [1] and computer vision [2]. Compared with frame change detection, color tracking can directly detect chess positions, while frame change detection needs another frame to determine the position of the chess pieces.
2 System Design 2.1 General System
- Input design for chess robot
- Form of Chess Pieces
- Form of Chess Board
- Light and Camera
- Logitech c525 spesification Video resolution : 1280 x 720 pixels
- Color tracking and bestmove calculation
- Convert RGB image format to HSV image fromat
- Color Filtering
- Best move calculation
- Robot Manipulator
After changing the image with Figure 9b, there is some noise in the HSV result, which you can see in Figure 10b. Find contour is used to find the white area in the filtered image, which you can see in Figure 12.
3 Result
- Testing the effect of different lumen on color tracking
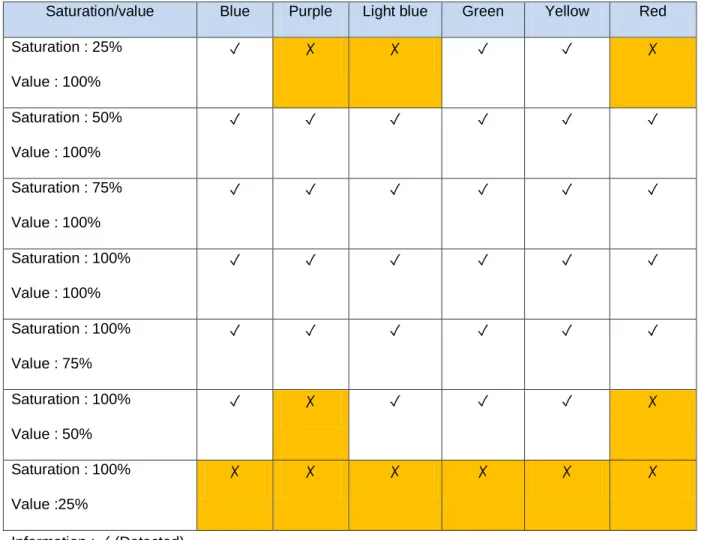
- Testing the effect of color saturation and value on color tracking
- Testing the effect of different type of camera on color tracking
- Testing movement detection with color tracking
Testing is done using the logitech c525 camera color tracking adjustment and then checking if the program can still do color tracking after replacing the logitech c525 with a logitech C210. So it is the same method to test with logitech c210 as reference and logitech c525 to see if the program can still do color tracking after changing the camera.
4 Conclusion
5 References
Model for integrating peer-interaction into eBook technology
The movies (Harry Potter) on the other hand represented imagination of a very limited kind - maybe because of the producer or maybe the movies were made in a hurry to make money while the popularity was at its peak. Therefore, much depends on the ability of the author or the film to capture the imagination of the reader.
2 Academic Texts
Active Learning Activities
This need of students points to a student-centered approach that was previously overlooked by manufacturers of the technology. The publishing industry needs to think innovatively and use a human-centered approach to development that will allow them to design for more engaging experiences.” (p.10).
3 Incorporating Active Learning Activities in eBook Technology
This can be done when students work in pairs or groups and have the opportunity to. It is a design approach that in this case serves the needs, tastes and habits of the readers.
4 Pedagogical Features
5 Proposed eBook Development Model
Those involved with technology will need to cater to the needs of all stakeholders. Preliminary ideas for each of the three areas, content, technology and pedagogy are given in Fig.1.
6 Roles and Interactions
The type of people who will be involved in the publication and use of e-books will be possible. 1 is intended as a starting point for thinking about the issues involved in publishing an e-book.
7 eBook Features
Identifying the Conflicts in the Software Requirement Engineering: A Literature Review
Related Work
For example: Yen presents a formal framework that facilitates the identification and the trade-off analysis of conflicting requirements [6]. They find out the reason and the solution they use Win Win system. On the other hand, this paper uses some tools and techniques to identify and resolve conflicts [8].
Methodology
- Conflict with different stakeholders
- Relationship between conflicts and solutions
- Analysis and Negotiation
- Documentation
- Validation
- Management
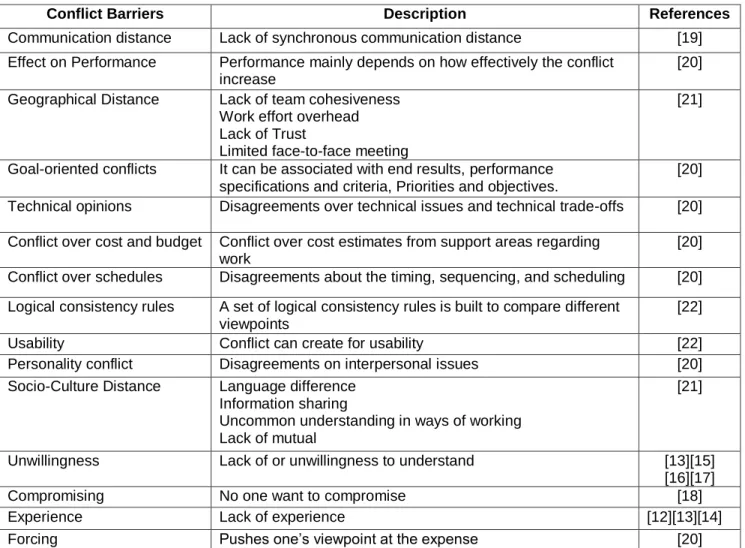
Types of low categories and requirements, face to face limited meeting and lack of judgment and the compromise can create a problem. Conflict occurs lack of Withdrawal/avoidance, compromise Withdrawals from an actual or potential conflict situation and searches for and bargaining for.
6 Conclusion and Future Work
Contributions: Through a literature review we have identified 21 conflicts and 20 solutions
Suomi National Polar-orbiting Partnership Satellite Data Processing System to Produce Vegetation Indices
Most of the other countries only monitor forest areas that have commercial purposes (De Fries et al., 2006). Furthermore, VI has been used to monitor land cover on a global scale (Fritz et al., 2012).
2 System Description, Data, and Evaluation Method 2.1 System Description
Data
First, sample the data in rawdata, RDR, SDR levels that accompany RT-STPS, CSPP SDR and CSPP EDR software. This data was used to validate the compliance of the developed system not only for sample data but also for actual data.
Evaluation Method
Second, the "real" data of the remote sensing satellite Suomi NPP at the level of raw data acquired in the live broadcast mode by the remote sensing ground station LAPAN.
3 Results and Discussion
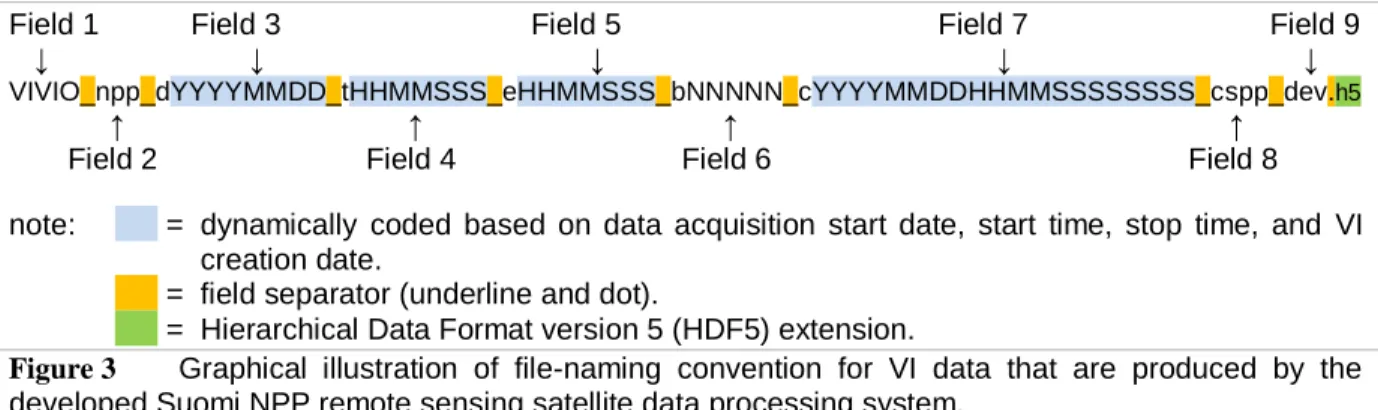
This means that the smallest VI data contains 1 (one) grain and the largest VI data contains 11 (eleven) grains in one acquisition of Suomi NPP remote sensing satellite data. The fastest processing time was 4 minutes and 22 seconds for Suomi NPP remote sensing satellite data with 1 (one) grain.
4 Conclusion
The longest processing time was 1 hour, 51 minutes, and 10 seconds for Suomi NPP remote sensing satellite data with 11 (eleven) grains. The fastest interval time between 2 (two) consecutive Suomi NPP remote sensing satellite data acquisition is 1 hour and 35 minutes.
5 References
Although the discussion focused on only one type of data - vegetation indices -, it has opened up the potential to produce other types of data from the NPP Suomi remote sensing satellite data through the adoption of the developed system. Proceeding of the 1st International Joint Indonesia-Malaysia-Bangladesh-Ireland Conference 2015 Universitas Ubudiyah Indonesia, 27-28 April 2015, Banda Aceh, Indonesia. ftp://ftp.ssec.wisc.edu/pub/CSPP/hidden/NPP/SDR/v2.0/CSPP_SDR_Installation_Guide_v2.0 .pdf.
Performance of fastICA Algorithm as Noise Reduction in Cellular Network
The acoustic parameters to be observed are the value of Jitter, Shimmer and HNR of the resulting signal. This study became one of the foundations to be developed in future studies as a means of sharing information for the vocal cord interference detection tool over the telephone network [1].
2 ICA Technique for Noise Reduction
Global matrix G is the matrix of the changes from the signal source to the source signal estimate y. FastICA algorithm ICA model with non-Gaussianity approximation based on n-gentropy with fixed point iteration or the Newton iteration yielding the same equation.
3 Experimental Setup 3.1 Participants
Speech Parameter
The parameters used to determine the quality of the sound are the value of jitter, shimmer and HNR. Shimmer (local) illustrates the mean absolute amplitude differences with successive periods divided by the mean amplitude.
Data Analysis
- Preprocessing
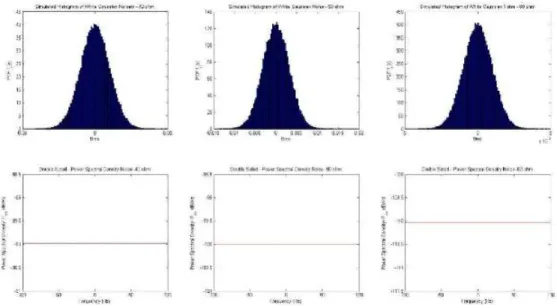
Noise that occurs can corrupt the information signal, as shown in Figure 5 are the spectrograms of the signal without noise (above) with a signal to noise (below). The jitter error value of the third different impedance value has a value approximately equal to the maximum value of the jitter error of 0.015957.
Simulation of Single Microring Resonator (MRR) using FDTD Technique for Sensing Applications
For homogeneous observation, the analytes are suspended in an aqueous medium over the ring and change the refractive index of coating layer which in turn leads to the change in the effective index, neff. The change in the neff then produces the shift in resonance wavelength at the drop port.
RESEARCH METHOD
The derivative of equation (6.a) can be approximated using the central difference formula, where the position of and the time of are considered to be the midpoint of the central difference formula in space and time, respectively. 6a can be approximated using central difference formula for location of at central point of central difference formula in space and specific time and as central time.
10) And then
However, to derive the time component of the magnetic field, the central difference formula must be used, for which the central point in time must be taken. For example, Equation 6.d can be approximated using the central difference formula based on the position of the magnetic field in Figure 4.
RESULTS AND DISCUSSION
![Figure 7 Installed Equipments at Cutting Machine with Chain Rotary Saw [5]](https://thumb-ap.123doks.com/thumbv2/123dok/10205820.0/65.893.174.658.497.792/figure-installed-equipments-cutting-machine-chain-rotary-saw.webp)
