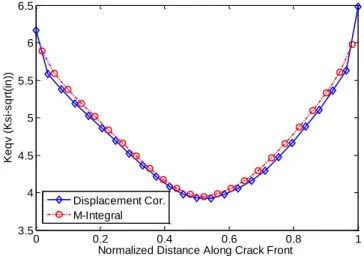
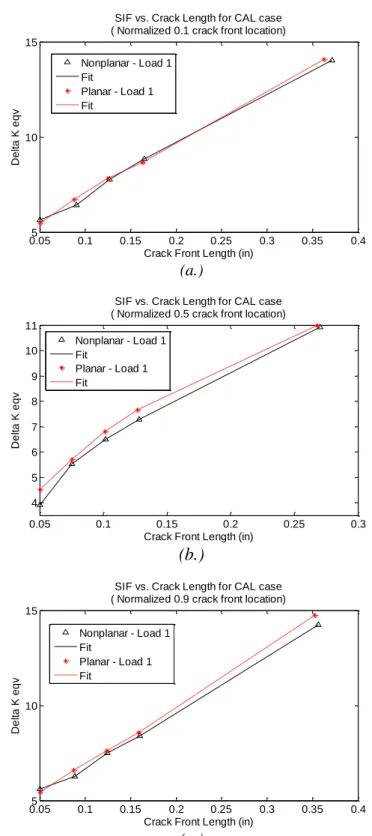
165 Figure 58: Upper and lower bounds on crack front paths determined by performing .. simulating crack growth under extreme load histories ... 167 Figure 59: Comparison of stress intensity factor solution plots found using non- . Planar crack growth methodology and equivalent planar crack growth methodology for the CAL load case. The plots show the SIFs along the crack front at a.) 0.1 normalized distance (near surface); b.) 0.5 normalized distance (depth); c.) 0.9 normalized distance (near surface) ... 173 Figure 61: Comparison of plots of stress intensity factor solutions found using non- . Planar crack growth methodology and equivalent planar crack growth methodology for the 2-block VAL load case.
Introduction
To overcome some of these limitations, the damage tolerance approach was later applied. A brief summary of the main contributions in the following chapters of this work in the areas of uncertainty quantification and fatigue crack growth analysis is also provided.
Fatigue Crack Modeling Background
As mentioned before, for the problem of high cycle fatigue growth crack, in which a large number of small growth cycles. Under constant amplitude loading conditions, the fatigue life of the structure can be found by simple integration of the fatigue crack growth rate model given in Eqn.
Problem Statement and Research Objectives
Develop a methodology to perform fatigue crack growth analysis for components subjected to variable amplitude multi-axial loading within a probabilistic framework. These improvements to the current analysis methodology are designed to be compatible with a probabilistic treatment of the fatigue crack growth process.
Organization of the Dissertation
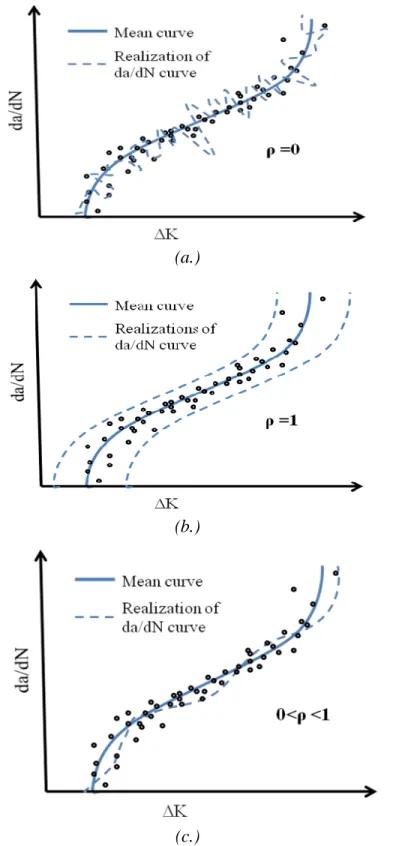
More realistic representation of the crack growth rate correlation structure at different ranges of stress intensity factors. As the stress intensity factor varies along the periphery of the crack front, so will the predicted crack growth rate.
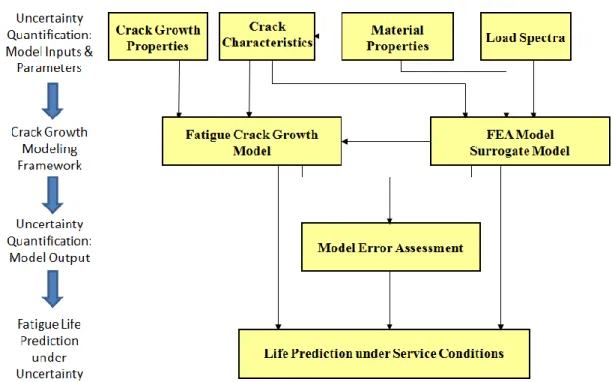
UNCERTAINTY QUANTIFICATION OF MODEL INPUTS AND PARAMETERS
Introduction
For structural systems, reliability is most simply thought of as the capacity of the structure to exceed a given demand. Additional knowledge about this type of uncertainty is not aimed at reducing uncertainty, but at better quantifying the actual physical state of the system or process.
Uncertainty in Material Properties
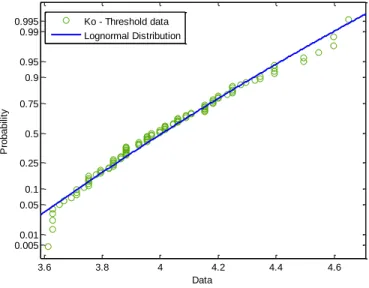
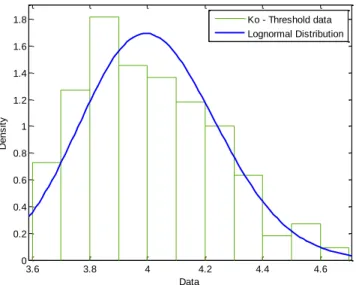
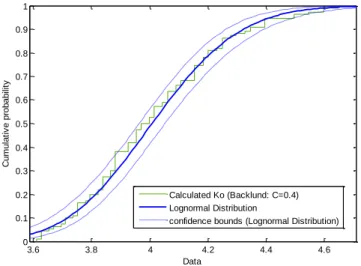
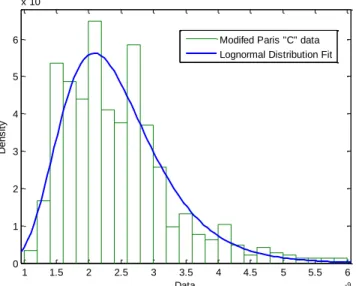
The histogram of the threshold voltage intensity factor together with the probability density function (PDF) of the fitted lognormal distribution is shown in Figure 9, and the corresponding cumulative distribution function (CDF) is shown in Figure 10. For this reason, sparse data can be shown. exist again for the statistical quantification of the fatigue limit of the material in question.
![Figure 7: Fatigue crack growth rate threshold data for 4340 steel a.) raw data b.) adjusted K o data using Backlund equation [37]](https://thumb-ap.123doks.com/thumbv2/123dok/10732200.0/45.918.167.801.272.517/figure-fatigue-crack-growth-threshold-adjusted-backlund-equation.webp)
Uncertainty in Fatigue Crack Growth Rate Parameters
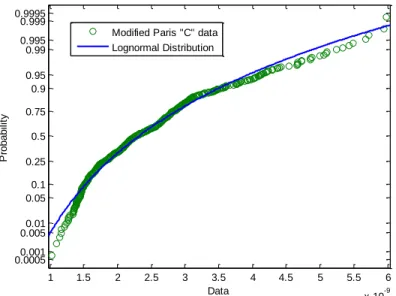
The analysis is limited to only the fatigue crack growth data corresponding to the linear region of the crack growth rate curve (see Figure 3). The experimental data are analyzed to determine the statistical distributions of fatigue crack growth rate model parameters corresponding to the linear region of the curve.
Uncertainty in Variable Amplitude, Multi-axial Loading
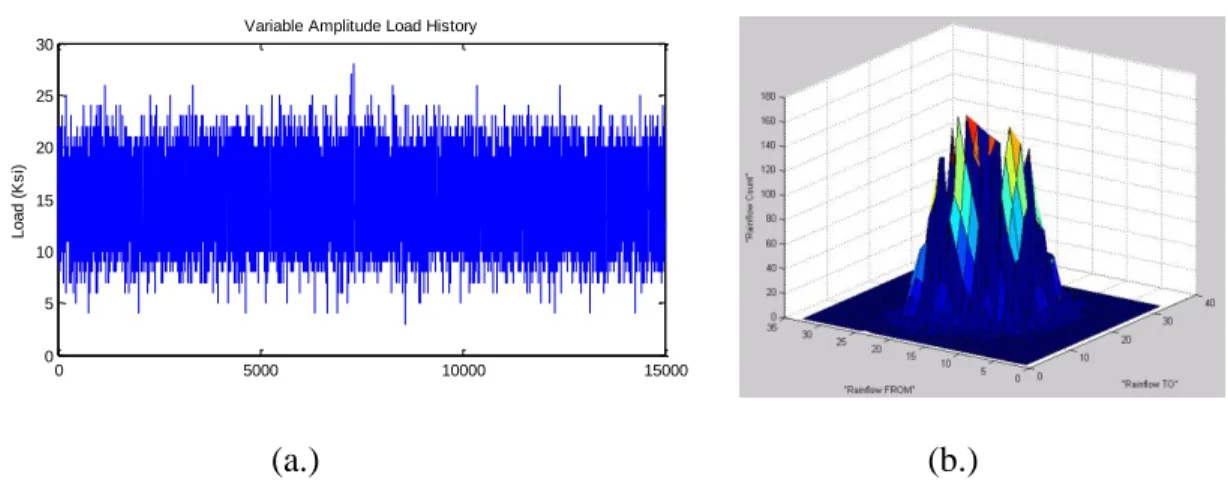
The second method fits the elements in the rainfall-runoff matrix to a joint distribution for a complete statistical representation of the load characteristics. A schematic of the procedure for quantifying the uncertainty of the variable-amplitude load spectrum is shown in Figure 21.
Summary
Incorporating nonlinearities into the crack growth model is not a trivial task. Three different loading histories (composed of the same loading values, but with different ranges) were used to perform non-planar crack growth simulations.
PLANAR FATIGUE CRACK GROWTH MODELING
Introduction
This chapter explains the general methodology developed to model fatigue crack propagation under multiaxial loading conditions using a planar fatigue crack growth approach. Crack growth rate calculations can be performed along the crack front using a stochastic fatigue crack growth rate model and the crack front can be propagated accordingly.
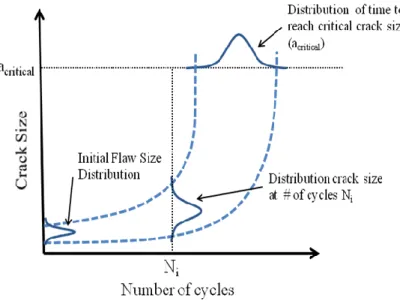
Initial Flaw Size & Location
The distribution of EIFS for 7075-T6 aluminum alloy is included in Figure 28 and can be sampled in the subsequent probabilistic crack growth analysis. However, this is not a necessary condition and the distribution of EIFS can be easily determined (despite the distribution functions of ΔKth and σf) through simple sampling techniques.
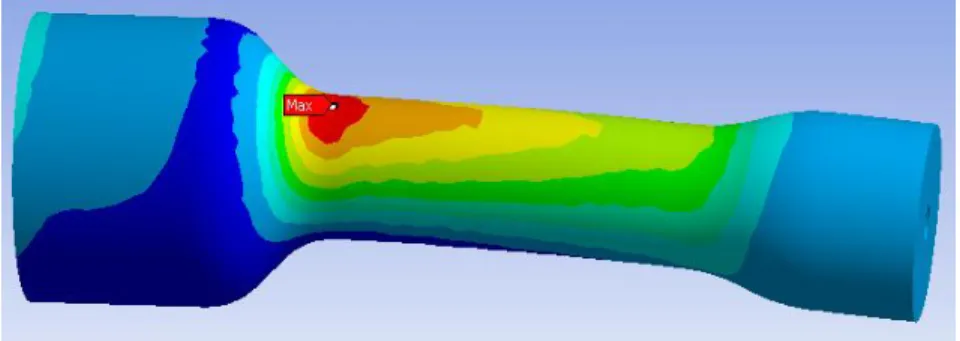
Component Stress Analysis
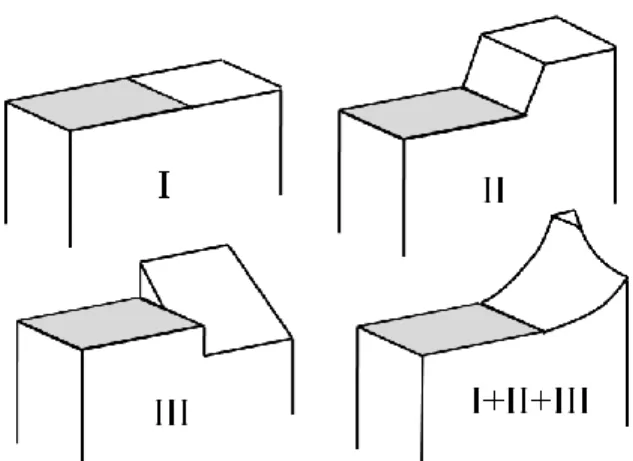
The immediate volumes on either side of the crack face are identified and subdivided to enable SIF evaluation at different locations along the crack front. The crack planes (coincident top and bottom surfaces of the previously mentioned volumes) are then.
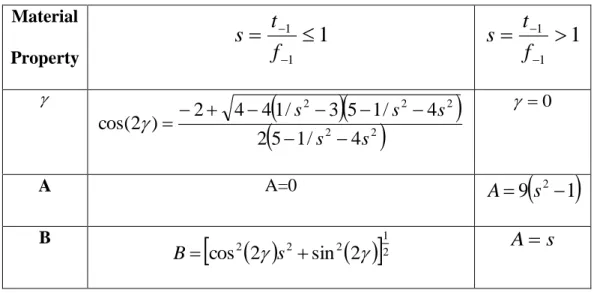
Equivalent Mixed-Mode Stress Intensity Factor
The plane-based characteristic model enables the calculation of an equivalent mixed-mode stress intensity factor which can be used for mixed-mode fatigue crack propagation and life prediction calculations. Following the derivation described by Liu [101], the equivalent mixed mode stress intensity factor using the characteristic plane approach can be expressed as.
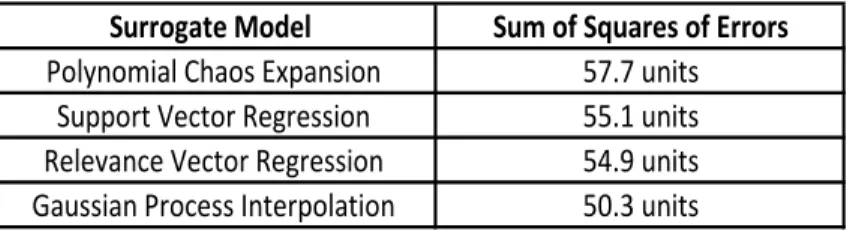
Surrogate Model Development
As previously mentioned, the variance associated with the model predictions is available as a result of the Gaussian Process formulation. A second important attribute of the GP modeling approach is that the method has the ability to provide a direct representation of the uncertainty associated with its interpolative approximation [106].
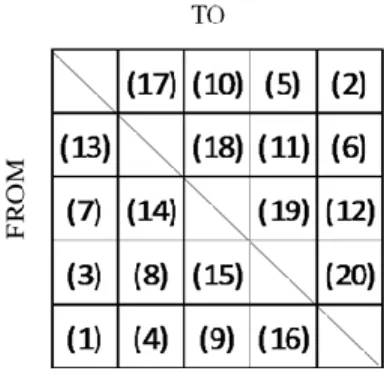
Variable Amplitude Load Generation
First, the transition probabilities in each row within the upper diagonal of the transition probability matrix given in Eq. 21) are converted into cumulative density functions. Both reconstructions using the Markov method fail to capture this main trend and appear to have a more stationary random behavior than the original data set.
Fatigue Crack Growth Modeling
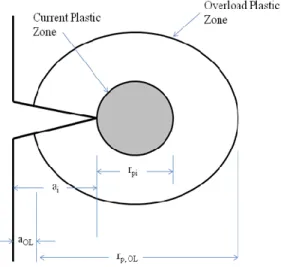
Therefore, the size of the plastic zone can be calculated in terms of the applied stress intensity factor (K) and yield strength (σ) as: For the planar crack growth analysis procedure, the crack growth direction remains in the plane of the initial crack orientation.
Summary
This chapter explores the possibilities for modeling fatigue crack growth for non-planar fatigue cracks. Overall, the equivalent modeling of planar crack growth appears to provide a reasonable approach to the analysis of non-planar crack growth.
UNCERTAINTY QUANTIFICATION IN PLANAR CRACK GROWTH
Introduction
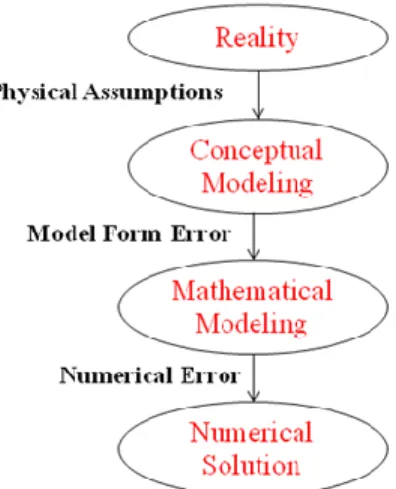
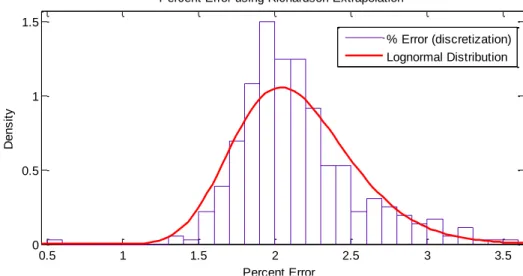
Model errors can generally be categorized into numerical solution errors and model shape errors [120], and each type can be significant. In addition, the statistic of numerical errors, εnum, within the finite element model can be estimated using the distribution of model output at both course and fine element meshes [121].
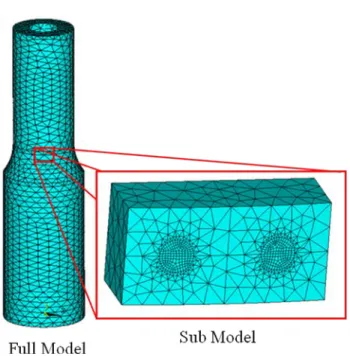
Finite Element Discretization Error
After performing this analysis, the full model mesh density was held constant while the submodel mesh was refined. The overall size of the sub-model is very small compared to that of the full model.
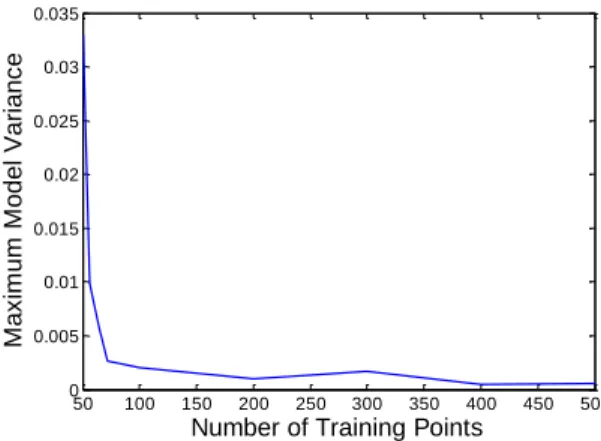
Surrogate Model Error
Since the surrogate model is built using an iterative process, it is easy to track the maximum model deviation for different number of training points used. The maximum model deviation (model prediction uncertainty) is observed to decrease as additional training points are used to train the surrogate.
Methodology to Incorporate Uncertainty in Final Prediction
When considering the modeling of non-planar crack growth, it is important to be able to predict and model both the size of the crack extension and. Each presents a unique formulation and therefore a unique solution to the non-planar fatigue crack growth modeling analysis.

NON-PLANAR FATIGUE CRACK GROWTH MODELING
Introduction
As a result, there is a growing interest in investigating the mechanics and crack growth modeling capabilities associated with the nonlinearities in the crack path. There are two dominant modes of fatigue crack propagation: tensile and shear dominated crack growth [132].
Existing Non-Planar Crack Growth Criterion
Crack growth directions predicted by the LS criterion and the maximum strain energy release criterion are generally very close to the direction predicted by the MTS criterion [156]. Schollmann [162] proposed the crack growth criterion σ1', which can also be used in the three-dimensional case.
Component Stress Analysis and Non-Planar Crack Modeling
Stress intensity factors are estimated from local stress scores and the relative advance at any point along the crack front can be estimated using a crack growth law. An alternative to the cycle-by-cycle approach is to adopt a block-type crack growth propagation method.
Surrogate Model Development
However, the construction of a meaningful and useful surrogate model for the case of non-planar crack growth is a significant challenge for several reasons. Currently, these limitations pose a significant challenge to easily extend the surrogate modeling approach developed in Chapter 3 to the nonplanar crack growth framework explored in this chapter.
Equivalent Planar Method
Once the crack has reached a critical size, relevant crack characteristics can be extracted from the resulting final non-planar crack configuration. It is necessary to evaluate the performance and accuracy of the corresponding planar crack growth modeling approach to results obtained using the non-planar buckling crack.
Summary
As a result, the development of the crack shape is expected to deviate after several crack growth stages. b.). Quantified uncertainty in crack shape and stress intensity factor solutions resulting from using different crack extension criteria for non-planar crack growth modeling.
UNCERTAINTY QUANTIFICATION IN NON-PLANAR CRACK GROWTH
Introduction
Non-planar crack growth is a stepwise process where current crack configurations are dependent on previous crack growth applications. Finally, the uncertainties and modeling errors resulting from replacing a non-planar analysis with an equivalent planar crack growth method are examined.
Uncertainty Resulting from Extension Criteria
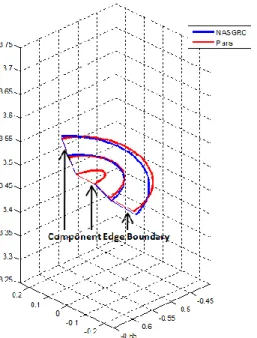
The results of the analysis are shown in Figure 51 and Figure 52. The crack front profiles obtained using the Paris crack growth model and NASGRO are given. It is clear that the crack front profiles obtained from using the Paris and NASGRO crack growth models are slightly different.
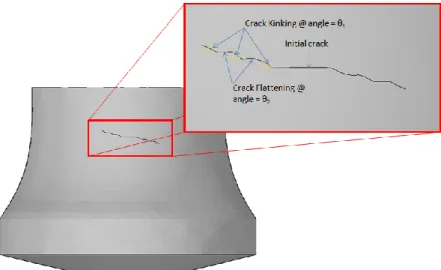
Uncertainty Resulting from Direction Criteria
As a result, it is clear that crack shape development under non-planar crack growth modeling is dependent on both the crack extension and crack direction criteria used. The crack buckling angle predicted by the maximum shear stress (MSS) criteria was determined to be smaller than the buckling angle predicted by the maximum tangential stress (MTS) criteria.

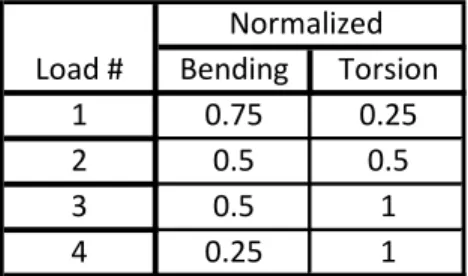
Uncertainty Resulting from Load Sequence
It is found that the development of the crack shape is dependent on the applied loading conditions and that each loading sequence results in a unique crack shape and crack tip orientation at each stage of the crack growth analysis. B.). Through various numerical crack growth studies it has been shown that the sequence of applied loads can have a significant effect on the development of the crack shape over time.
Non-Planar vs. Equivalent Planar Comparison
The second comparison of the accuracy of the equivalent planar method in representing the non-planar crack growth modeling considered a two-block variable amplitude loading case, where both bending and torsional loading is applied. The percentage error between the equivalent planar and the non-planar analysis is found.
Summary
Evaluated model errors for an 'equivalent planar' fatigue crack growth modeling compared to traditional non-planar results. This study implemented fatigue crack growth analysis using both planar and non-planar fatigue crack growth modeling techniques.
SUMMARY & FUTURE WORK
Summary
In the second half of this thesis, the focus shifts to identifying additional sources of uncertainty introduced when non-planar fatigue crack growth modeling is performed. Quantified uncertainty in solutions for crack shape and stress intensity factors due to the use of different crack direction criteria for non-planar crack growth modeling.
Future Research Needs
Proposed an “equivalent plane” approach to fatigue crack modeling to reduce the computational cost of numerical simulations while preserving valuable features in a full-scale non-plane crack growth analysis. Once developed, these methods will still rely on accurate non-planar crack growth analysis for training data under multiaxial loading histories.