Management of Working Capital is also an important part of financial manager. The main objective of the Working Capital Management is managing the Current Asset and Current Liabilities effectively and maintaining adequate amount of both Current Asset and Current Liabilities. Simply it is called Administration of Current Asset and Current Liabilities of the business concern.
Management of key components of working capital like cash, inventories and receivables assumes paramount importance due to the fact the major potion of working capital gets blocked in these assets.
Meaning
Working capital management is an act of planning, organizing and controlling the components of working capital like cash, bank balance inventory, receivables, payables, overdraft and short-term loans.
Definition
According to Smith K.V, “Working capital management is concerned with the problems that arise in attempting to manage the current asset, current liabilities and the inter- relationship that exist between them”.
According to Weston and Brigham, “Working capital generally stands for excess of current assets over current liabilities. Working capital management therefore refers to all aspects of the administration of both current assets and current liabilities”.
INVENTORY MANAGEMENT
IntroductionInventories constitute the most significant part of current assets of the business concern.
It is also essential for smooth running of the business activities.
166 Financial Management
A proper planning of purchasing of raw material, handling, storing and recording is to be considered as a part of inventory management. Inventory management means, management of raw materials and related items. Inventory management considers what to purchase, how to purchase, how much to purchase, from where to purchase, where to store and when to use for production etc.
Meaning
The dictionary meaning of the inventory is stock of goods or a list of goods. In accounting language, inventory means stock of finished goods. In a manufacturing point of view, inventory includes, raw material, work in process, stores, etc.
Kinds of Inventories
Inventories can be classified into five major categories.
A. Raw Material
It is basic and important part of inventories. These are goods which have not yet been committed to production in a manufacturing business concern.
B. Work in Progress
These include those materials which have been committed to production process but have not yet been completed.
C. Consumables
These are the materials which are needed to smooth running of the manufacturing process.
D. Finished Goods
These are the final output of the production process of the business concern. It is ready for consumers.
E. Spares
It is also a part of inventories, which includes small spares and parts.
Objectives of Inventory Management
Inventory occupy 30–80% of the total current assets of the business concern. It is also very essential part not only in the field of Financial Management but also it is closely associated with production management. Hence, in any working capital decision regarding the inventories, it will affect both financial and production function of the concern. Hence, efficient management of inventories is an essential part of any kind of manufacturing process concern.
The major objectives of the inventory management are as follows:
• To efficient and smooth production process.
• To maintain optimum inventory to maximize the profitability.
• To meet the seasonal demand of the products.
Working Capital Management 167
• To avoid price increase in future.
• To ensure the level and site of inventories required.
• To plan when to purchase and where to purchase
• To avoid both over stock and under stock of inventory.
Techniques of Inventory Management
Inventory management consists of effective control and administration of inventories.
Inventory control refers to a system which ensures supply of required quantity and quality of inventories at the required time and at the same time prevent unnecessary investment in inventories. It needs the following important techniques.
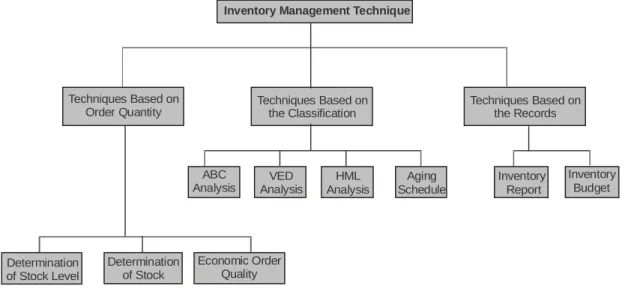
Inventory management techniques may be classified into various types:
Inventory Management Technique
Techniques Based on Order Quantity
Techniques Based on the Records
Inventory Budget Inventory
Report Aging
Schedule HML
Analysis VED
Analysis ABC
Analysis
Techniques Based on the Classification
Determination of Stock Level
Determination of Stock
Economic Order Quality
Fig. 11.1 Inventory Management Techniques
A. Techniques based on the order quantity of Inventories
Order quantity of inventories can be determined with the help of the following techniques:
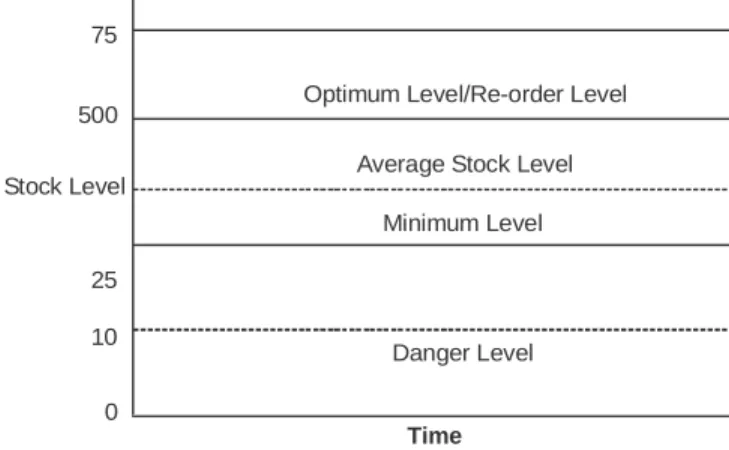
Stock Level
Stock level is the level of stock which is maintained by the business concern at all times.
Therefore, the business concern must maintain optimum level of stock to smooth running of the business process. Different level of stock can be determined based on the volume of the stock.
168 Financial Management
Minimum Level
The business concern must maintain minimum level of stock at all times. If the stocks are less than the minimum level, then the work will stop due to shortage of material.
Re-order Level
Re-ordering level is fixed between minimum level and maximum level. Re-order level is the level when the business concern makes fresh order at this level.
Re-order level=maximum consumption × maximum Re-order period.
Maximum Level
It is the maximum limit of the quantity of inventories, the business concern must maintain.
If the quantity exceeds maximum level limit then it will be overstocking.
Maximum level = Re-order level + Re-order quantity
– (Minimum consumption × Minimum delivery period) Danger Level
It is the level below the minimum level. It leads to stoppage of the production process.
Danger level=Average consumption × Maximum re-order period for emergency purchase
Average Stock Level It is calculated such as,
Average stock level= Minimum stock level + ½ of re-order quantity maximum level
75
500
Stock Level
25 10
0
Optimum Level/Re-order Level
Average Stock Level Minimum Level
Danger Level
Time
Fig. 11.2 Determining the Stock Level
Lead Time
Lead time is the time normally taken in receiving delivery after placing orders with suppliers.
The time taken in processing the order and then executing it is known as lead time.
Working Capital Management 169
Safety Stock
Safety stock implies extra inventories that can be drawn down when actual lead time and/
or usage rates are greater than expected. Safety stocks are determined by opportunity cost and carrying cost of inventories. If the business concerns maintain low level of safety stock, it will lead to larger opportunity cost and the larger quantity of safety stock involves higher carrying costs.
Economic Order Quantity (EOQ)
EOQ refers to the level of inventory at which the total cost of inventory comprising ordering cost and carrying cost. Determining an optimum level involves two types of cost such as ordering cost and carrying cost. The EOQ is that inventory level that minimizes the total of ordering of carrying cost.
EOQ can be calculated with the help of the mathematical formula:
EOQ =
2ab/c
Where,a = Annual usage of inventories (units) b = Buying cost per order
c = Carrying cost per unit
Minimum Total Cost
Carrying Cost
Ordering Cost
Order Size Cost
Q
Fig. 11.3 Economic Order Quantity
Exercise 1
(a) Find out the economic order quantity and the number of orders per year from the following information:
Annual consumption: 36,000 units Purchase price per units: Rs. 54
170 Financial Management
Ordering cost per order: Rs. 150
Inventory carrying cost is 20% of the average inventory.
Solution
Inventory = 2AO C
A = 36,000 units O = Rs. 150
C = 20% of 54×10×8 2×36,000×150 = 1,000 units
EOQ = 1,000 units Exercise 2
From the following information calculate, (1) Re-order level (2) Maximum level (3) Minimum level (4) Average level
Normal usage: 100 units per week Maximum usage: 150 units per week Minimum usage: 50 units per week Re-order quantity (EOQ) 500: units Log in time: 5 to 7 weeks
Solution
(1) Re-order Level
= Maximum consumption × Maximum Re-order period = 150×7=1050 units
(2) Maximum Level
= Re-order level+Re-order quantity
–( Minimum consumption×Minimum delivery period)
= 1050 + 500 – (50 × 5) = 1300 units (3) Minimum Level
= Re-order level – (Normal consumption×Normal delivery period) = 1050 – (100 × 6 ) = 450 units
(4) Average Level
= Maximum level + Minimum level 2
=
1300 + 4502
= 875 units.
Working Capital Management 171
TECHNIQUES BASED ON THE CLASSIFICATION OF INVENTORIES
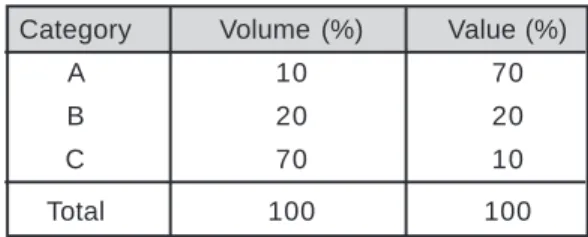
A-B-C analysisIt is the inventory management techniques that divide inventory into three categories based on the value and volume of the inventories; 10% of the inventory’s item contributs to 70% of value of consumption and this category is known as A category. About 20% of the inventory item contributes about 20% of value of consumption and this category is called category B and 70% of inventory item contributes only 10% of value of consumption and this category is called C category.
Inventory Breakdown Between Value and Volume Category Volume (%) Value (%)
A 10 70
B 20 20
C 70 10
Total 100 100
ABC analysis can be explained with the help of the following Graphical presentation.
Value of Inventory (%)
Volume of Inventory (%)
A B C
Fig. 11.4 ABC Analysis
Aging Schedule of Inventories
Inventories are classified according to the period of their holding and also this method helps to identify the movement of the inventories. Hence, it is also called as, FNSD analysis—
where,
F = Fast moving inventories N = Normal moving inventories S = Slow moving inventories D = Dead moving inventories
172 Financial Management
This analysis is mainly calculated for the purpose of taking disposal decision of the inventories.
VED Analysis
This technique is ideally suited for spare parts in the inventory management like ABC analysis. Inventories are classified into three categories on the basis of usage of the inventories.
V = Vital item of inventories E = Essential item of inventories D = Desirable item of inventories HML Analysis
Under this analysis, inventories are classified into three categories on the basis of the value of the inventories.
H = High value of inventories M = Medium value of inventories L = Low value of inventories
TECHNIQUES ON THE BASIS OF RECORDS
A. Inventory budgetIt is a kind of functional budget which facilitates the estimated inventory required for the business concern during a particular period. This budget is prepared based on the past experience.
B. Inventory reports
Preparation of periodical inventory reports provides information regarding the order level, quantity to be procured and all other information related to inventories. On the basis of these reports, Management takes necessary decision regarding inventory control and Management in the business concern.
Valuation of Inventories
Inventories are valued at different methods depending upon the situation and nature of manufacturing process. Some of the major methods of inventory valuation are mentioned as follows:
1. First in First Out Method (FIFO) 2. Last in First Out Method (LIFO) 3. Highest in First Out Method (HIFO) 4. Nearest in First Out Method (NIFO) 5. Average Price Method
Working Capital Management 173
6. Base Stock Method 7. Standard Price Method 8. Market Price Method Exercise 3
From the particulars given below write up the stores ledger card : 1988 January 1, Opening stock 1,000 units at Rs. 26 each.
5 Purchased 500 units at Rs. 24.50 each.
7 Issued 750 units.
10 Purchased 1,500 units at Rs. 24 each.
12 Issued 1,100 units.
15 Purchased 1,000 units at Rs. 25 each.
17 Issued 500 units.
18 Issued 300 units.
25 Purchased 1,500 units at Rs. 26 each.
29 Issued 1,500 units.
Adopt the FIFO and LIFO method of issue and ascertain the value of the closing stock.
CASH MANAGEMENT
Business concern needs cash to make payments for acquisition of resources and services for the normal conduct of business. Cash is one of the important and key parts of the current assets.
Cash is the money which a business concern can disburse immediately without any restriction. The term cash includes coins, currency, cheques held by the business concern and balance in its bank accounts. Management of cash consists of cash inflow and outflows, cash flow within the concern and cash balance held by the concern etc.
Motives for Holding Cash 1. Transaction motive
It is a motive for holding cash or near cash to meet routine cash requirements to finance transaction in the normal course of business. Cash is needed to make purchases of raw materials, pay expenses, taxes, dividends etc.
2. Precautionary motive
It is the motive for holding cash or near cash as a cushion to meet unexpected contingencies. Cash is needed to meet the unexpected situation like, floods strikes etc.
174Financial Management (A) First in First out Method FIFO Method
Receipts I s s u e s Balance
Date Particulars Qty. Rate Amount Qty. Rate Amount Qty. Rate Amount
Or Units Rs. P. Rs. Units Rs. P. Rs. Units Rs. P. Rs.
Reference 1998
Jan. 1 Balance
B/d 1,000 26.00 26,000
5 G.R.N. No. 500 24.50 12,250 1,000 26.00 26,000
500 24.50 12,250
7 M.R. No. 750 26.00 19,500 250 26.00 6,500
500 24.50 12,250
10 G.R.N. No. 1,500 24.00 36,000 250 26.00 6,500
500 24.50 12,250
1,500 24.00 36,000 250 26.00 6,500
500 24.50 12,250
350 24.00 8,400 1,150 24.00 27,600
12 M.R. No. 1,100
15 G.R.N No. 1,000 25.00 25,000 1,150 24.00 27,600
1,000 25.00 25,000
17 M.R No. 500 24.00 12,000 650 24.00 15,600
1,000 25.00 25,000
18 M.R. No. 300 24.00 7,200 350 24.00 8,400
1,000 25.00 25,000
25 G.R.N. No. 1,500 26.00 39,000 350 24.00 8,400
1,000 25.00 25,000
1,500 26 39,000
350 24.00 8,400 1,000 25.00 25,000
150 26.00 3,900 1,350 26.00 35,100
29 M.R. No 1,500
Closing stock 1,350 units at Rs. 26 each = Rs. 35,100 Note : G.R.N. No. = Goods Received Note Number.
M.R. No. = Material Requisition Number.
Working Capital Management175
Receipts I s s u e s Balance
Date Particulars Qty. Rate Amount Qty. Rate Amount Qty. Rate Amount
Or Units Rs. P. Rs. Units Rs. P. Rs. Units Rs. P. Rs.
Reference 1998
Jan. 1 Balance
B/d 1,000 26.00 26,000
5 G.R.N. No. 500 24.50 12,250 1,000 26.00 26,000
500 24.50 12,250
7 M.R. No. 750 26.00 19,500 250 26.00 6,500
500 24.50 12,250
10 G.R.N. No 1,500 24.00 36,000 250 26.00 6,500
500 24.50 12,250
1,500 24.00 36,000 250 26.00 6,500
500 24.50 12,250
350 24.00 8,400 1,150 24.00 27,600
12 M.R. No 1,100
15 G.R.N. No 1,000 25.00 25,000 1,150 24.00 27,600
1,000 25.00 25,000
17 M.R. No. 500 24.00 12,000 650 24.00 15,600
1,000 25.00 25,000
18 M.R. No. 300 24.00 7,200 350 24.00 8,400
1,000 25.00 25,000
25 G.R.N. No. 1,500 26.00 39,000 350 24.00 8,400
1,000 25.00 25,000 1,500 26.00 39,000
29 M.R. No. 1,500 26.00 39,000 750 26.00 19,500
400 24.00 9,600
200 25.00 5,000
(B) Last in first out method (LIFO)
Closing Stock = 1,350 units, valued at Rs. 34,100 (750×26+400×24+200×25)
Note : G.R.N. No. = Goods Received Note Number; M.R. No. = Material Requisition Number.
176 Financial Management
3. Speculative motive
It is the motive for holding cash to quickly take advantage of opportunities typically outside the normal course of business. Certain amount of cash is needed to meet an opportunity to purchase raw materials at a reduced price or make purchase at favorable prices.
4. Compensating motive
It is a motive for holding cash to compensate banks for providing certain services or loans. Banks provide variety of services to the business concern, such as clearance of cheque, transfer of funds etc.
Cash Management Techniques
Managing cash flow constitutes two important parts:
A. Speedy Cash Collections.
B. Slowing Disbursements.
Speedy Cash Collections
Business concern must concentrate in the field of Speedy Cash Collections from customers.
For that, the concern prepares systematic plan and refined techniques. These techniques aim at, the customer who should be encouraged to pay as quickly as possible and the payment from customer without delay. Speedy Cash Collection business concern applies some of the important techniques as follows:
Prompt Payment by Customers
Business concern should encourage the customer to pay promptly with the help of offering discounts, special offer etc. It helps to reduce the delaying payment of customers and the firm can avoid delays from the customers. The firms may use some of the techniques for prompt payments like billing devices, self address cover with stamp etc.
Early Conversion of Payments into Cash
Business concern should take careful action regarding the quick conversion of the payment into cash. For this purpose, the firms may use some of the techniques like postal float, processing float, bank float and deposit float.
Concentration Banking
It is a collection procedure in which payments are made to regionally dispersed collection centers, and deposited in local banks for quick clearing. It is a system of decentralized billing and multiple collection points.
Lock Box System
It is a collection procedure in which payers send their payment or cheques to a nearby post box that is cleared by the firm’s bank. Several times that the bank deposit the cheque
Working Capital Management 177
in the firms account. Under the lock box system, business concerns hire a post office lock box at important collection centers where the customers remit payments. The local banks are authorized to open the box and pick up the remittances received from the customers.
As a result, there is some extra savings in mailing time compared to concentration bank.
Slowing Disbursement
An effective cash management is not only in the part of speedy collection of its cash and receivables but also it should concentrate to slowing their disbursement of cash to the customers or suppliers. Slowing disbursement of cash is not the meaning of delaying the payment or avoiding the payment. Slowing disbursement of cash is possible with the help of the following methods:
1. Avoiding the early payment of cash
The firm should pay its payable only on the last day of the payment. If the firm avoids early payment of cash, the firm can retain the cash with it and that can be used for other purpose.
2. Centralised disbursement system
Decentralized collection system will provide the speedy cash collections. Hence centralized disbursement of cash system takes time for collection from our accounts as well as we can pay on the date.
Cash Management Models
Cash management models analyse methods which provide certain framework as to how the cash management is conducted in the firm. Cash management models are the development of the theoretical concepts into analytical approaches with the mathematical applications. There are three cash management models which are very popular in the field of finance.
1. Baumol model
The basic objective of the Baumol model is to determine the minimum cost amount of cash conversion and the lost opportunity cost.
It is a model that provides for cost efficient transactional balances and assumes that the demand for cash can be predicated with certainty and determines the optimal conversion size.
Total conversion cost per period can be calculated with the help of the following formula:
t= Tb C where,
T = Total transaction cash needs for the period b = Cost per conversion
C = Value of marketable securities
178 Financial Management
Opportunity cost can be calculated with the help of the following formula;
i = C 2 where,
i = interest rate earned C/2 = Average cash balance
Optimal cash conversion can be calculated with the help of the following formula;
C = 2bT
i where,
C = Optimal conversion amount
b = Cost of conversion into cash per lot or transaction T = Projected cash requirement
i = interest rate earned 2. Miller-Orr model
This model was suggested by Miller Orr. This model is to determine the optimum cash balance level which minimises the cost of management of cash. Miller-Orr Model can be calculated with the help of the following formula;
C = bE (N)
t + iE (M) where,
C = Total cost of cash management b = fixed cost per conversion
E(M) = expected average daily cash balance E (N) = expected number of conversion
t = Number of days in the period i = lost opportunity cost
3. Orgler’s model
Orgler model provides for integration of cash management with production and other aspects of the business concern. Multiple linear programming is used to determine the optimal cash management.
Orgler’s model is formulated, based on the set of objectives of the firm and specifing the set of constrains of the firm.
Working Capital Management 179
RECEIVABLE MANAGEMENT
The term receivable is defined as debt owed to the concern by customers arising from sale of goods or services in the ordinary course of business. Receivables are also one of the major parts of the current assets of the business concerns. It arises only due to credit sales to customers, hence, it is also known as Account Receivables or Bills Receivables.
Management of account receivable is defined as the process of making decision resulting to the investment of funds in these assets which will result in maximizing the overall return on the investment of the firm.
The objective of receivable management is to promote sales and profit until that point is reached where the return on investment in further funding receivables is less than the cost of funds raised to finance that additional credit.
The costs associated with the extension of credit and accounts receivables are identified as follows:
A. Collection Cost B. Capital Cost
C. Administrative Cost D. Default Cost.
Collection Cost
This cost incurred in collecting the receivables from the customers to whom credit sales have been made.
Capital Cost
This is the cost on the use of additional capital to support credit sales which alternatively could have been employed elsewhere.
Administrative Cost
This is an additional administrative cost for maintaining account receivable in the form of salaries to the staff kept for maintaining accounting records relating to customers, cost of investigation etc.
Default Cost
Default costs are the over dues that cannot be recovered. Business concern may not be able to recover the over dues because of the inability of the customers.
Factors Considering the Receivable Size
Receivables size of the business concern depends upon various factors. Some of the important factors are as follows:
180 Financial Management
1. Sales Level
Sales level is one of the important factors which determines the size of receivable of the firm. If the firm wants to increase the sales level, they have to liberalise their credit policy and terms and conditions. When the firms maintain more sales, there will be a possibility of large size of receivable.
2. Credit Policy
Credit policy is the determination of credit standards and analysis. It may vary from firm to firm or even some times product to product in the same industry. Liberal credit policy leads to increase the sales volume and also increases the size of receivable. Stringent credit policy reduces the size of the receivable.
3. Credit Terms
Credit terms specify the repayment terms required of credit receivables, depend upon the credit terms, size of the receivables may increase or decrease. Hence, credit term is one of the factors which affects the size of receivable.
4. Credit Period
It is the time for which trade credit is extended to customer in the case of credit sales.
Normally it is expressed in terms of ‘Net days’.
5. Cash Discount
Cash discount is the incentive to the customers to make early payment of the due date. A special discount will be provided to the customer for his payment before the due date.
6. Management of Receivable
It is also one of the factors which affects the size of receivable in the firm. When the management involves systematic approaches to the receivable, the firm can reduce the size of receivable.
Exercise 4
The board of directors of Aravind mills limited request you to prepare a statement showing the working capital requirements for a level of activity of 30,000 units of output for the year. The cost structure for the company’s product for the above mentioned activity level is given below.
Cost per Unit (Rs.)
Raw materials 20
Direct labour 5
Overheads 15
Total 40
Profit 10
Selling price 50
Working Capital Management 181
(a) Past experience indicates that raw materials are held in stock, on an average for 2 months.
(b) Work in progress (100% complete in regard to materials and 50% for labour and overheads) will be half a month’s production.
(c) Finished goods are in stock on an average for 1 month.
(d) Credit allowed to suppliers: 1 month.
(e) Credit allowed to debtors: 2 months.
(f) A minimum cash balance of Rs 25,000 is expected to be maintained.
Prepare a statement of working capital requirements.
Solution
Output per annum = 30,000 units
Output per annum = 12% of 30,000 =2,500 units Raw materials p. m. Rs. 20×2500 = 50,000
Labour p. m. Rs. 5×2,500 = 12,500 Overheads p. m. Rs. 15×2,500 = 37,500 1,00,000
Statement of Working Capital Requirements
Particulars Rs. Rs.
Current assets
Stock of raw materials (2 months) 50,000 x 2 1,00,000 Work-in-progress (1/2 months)
Raw materials = 50,000 x ½ 25,000
Labour = 12,500 x ½ x 50/100 3,125
Overheads = 37,500 x ½ x 50/100 9,375
37,500 Stock of finished goods (1 month) 1, 00,000 x 1 1,00,000
Debtors (2 month) 1,00,000 x 2 2,00,000
Cash balance required 25,000
4,62,500 Less: current liability
Creditors (1 month) 50,000 x 1 50,000
(Working capital required) 4,12,500
Exercise 5
Prepare an estimate of working capital requirement from the following information of a trading concern.
Projected annual sales 10,000 units
Selling price Rs. 10 per unit
182 Financial Management
Percentage of net profit on sales 20%
Average credit period allowed to customers 8 Weeks Average credit period allowed by suppliers 4 Weeks Average stock holding in terms of sales requirements 12 Weeks Allow 10% for contingencies
Solution
Statement of Working Capital Requirements
Current Assets Rs.
Debtors (8 weeks) 80,000 × 8
52 12,307
(at cost)
Stock (12 weeks) 80,000 ×12
52 18,462
30,770 Less: Current Liability
Credits (4 weeks) 80,000 × 4
52 6,154
24,616
Add 10% for contingencies 2,462
Working Capital Required 27,078
Working Notes
Sales = 10000×10 = Rs. 1,00,000 Profit 20% of Rs. 1,00,000 = Rs. 20,000
Cost of Sales=Rs.1,00,000 – 20,000 = Rs. 80,000
As it is a trading concern, cost of sales is assumed to be the purchases.
Exercise 6
Prepare an estimate of working capital requirement from the following informations of a trading concern.
Projected annual sales Rs. 6,50,000
Percentage of net profit on sales 25%
Average credit period allowed to debtors 10 Weeks Average credit period allowed by creditors 4 Weeks Average stock holding in terms of sales requirements 8 Weeks Allow 20% for contingencies
(M.Com., M.S. University Nov. 2001)
Working Capital Management 183
Solution
Statement of Working Capital Requirements
Current Assets Rs.
Debtors (10 weeks) (at cost) 5,20,000 10×
52 1,00,000
Stock (8 weeks) 5,20,000×8
52 80,000
1,80,000 Less: Current Liability
Credits ( 4 weeks) 5,20,000×4
52 40,000
1,40,000
Add 20% for contingencies 28,000
(Working Capital Required) 1,68,000
Working Notes
Sales=Rs. 6,50,000
Profit 25/125 of Rs. 6,50,000 = Rs. 1,30,000
Cost of Sales=Rs. 6,50,000 –1,30,000=Rs. 5,20,000
As it is a trading concern, cost of sales is assumed to be the purchases.
Exercise 7
A Performa cost sheet of a company provides the following particulars:
Elements of cost
Material 35%
Direct Labours 25%
Overheads 20%
Further particulars available are:
(i) It is proposed to maintain a level of activity of 2,50,000 units.
(ii) Selling price is Rs. 10/- per unit
(iii) Raw materials are to remain in stores for an average period of one month.
(iv) Finished foods are required to be in stock for an average period of one month.
(v) Credit allowed to debtors is 3 months.
(vi) Credit allowed by suppliers is 2 months.
You are required to prepare a statement of working capital requirements, a forecost profit and loss account and balance sheet of the company assuring that
Share Capital Rs. 12,00,000
10% Debentures Rs. 3,00,000
Fixed Assets Rs. 11,00,000
184 Financial Management
Solution
Statement of Working Capital
Particulars Rs. Rs.
Current Assets
Stock of Raw Materials (1 Month)
(5,00,000 x 35% x 1/12) 72,917
Work in process (1/2 months)
Materials (25,00,000 x 35% x 1/24) 36,458 Labour (25,00,000 x 25% x 1/24) 26,041
Overheads (25,00,000 x 20% x 1/24) 20,833 83,332 Stock of finished goods (one month)
Materials (25,00,000 x 35% x 1/12) 72,917 Labour (25,00,000 x 25% x 1/12) 52,083
Overheads (25,00,000 x 20% x 1/12) 41,667 1,66,667 Debtors (2 months) At cost
Materials (25,00,000 x 35% x 3/12) 2,18,750 Labour (25,00,000 x 25% x 3/12) 1,56,250
Overheads (5,00,000 x 20% x 3/12) 1,25,000 5,00,000 8,22,916 Less: Current liability
Credits (2 Months) for raw materials
25,00,000 x 35% x 2/12 1,45,833
Net working capital required 6,77,083
Forecast Profit and Loss Account
Dr. Cr.
To Materials By cost of goods sold 20,00,000
(25,00,000 x 35%) 8,75,000 To Wages
(25,00,000 x 25%) 6,25,000 To Overheads
(25,00,000 x 20%) 5,00,000
20,00,000 20,00,000
To Cost of goods sold 20,00,000 By Sales 25,00,000
To Gross profit 5,00,000
25,00,000 25,00,000
To Interest on
debentures 30,000 By Gross profit 5,00,000
To Net profit 4,70,000
5,00,000 5,00,000
Working Capital Management 185 Forecast Balance Sheet
Liabilities Rs. Assets Rs.
Share capital 12,00,000 Fixed Assets 11,00,000
Net profit 4,70,000 Stock
10% debentures 3,00,000 Raw material 72,917
Credits 1,45,833 Work-in-process 38,458
Finished goods 1,66,667
Debtors 5,00,000
Cash and Bank Balance 2,37,791
21,15,833 21,15,833
Exercise 8
Selva and Co. desires to purchase a business and has consulted you and one point on which you are to advise them is the average amount of working capital which will be required in the first year’s working.
You have given the following estimates and instructed to add 10% to your computed figure to allow for contingencies.
(i) Amount blocked up for stocks: Figures for the year
Stocks of finished product 3,000
Stocks of stores, materials, etc., 5,000
(ii) Average credit given:
Inland sales 4 weeks credit 26,000
Export sales—112 weeks credit 65,000
(iii) Lag in payment of wages and other outputs
Wages—
1
12 weeks 2,40,000Stocks of materials, etc.—
1
12 month 36,000Rent, Royalties, etc.—4 months 8,000
Clerical staff—
1
12 month 60,000Manager—12month 4,000
Miscellaneous expenses—
1
12 month 36,000(iv) Payment in advance
Sundry Expenses (paid quarterly in advance) 6,000 (v) Undrawn profit on the average throughout the year 9,000
State your calculations for the average amount of working capital required.
186 Financial Management
Solution
Statement of Working Capital
Particulars Rs.
Current Assets
Stock of finished products 3,000
Stock of stores material, etc. 5,000
Sundry debtors
(a) Inland (4 weeks) 2,60,000 × 4/52 20,000
(b) Export Sales (121 weeks) 65,000 ×1.512 1,875 21,875
Payments in advance 6,000 × ¼ 1,500
31,375 Less: Lag in payment of wages (112 weeks) 24,000 × 1.512 6,923 Stock, Materials etc. (112 months) 8000 × 126 4,500 Rent, Royalties, etc. (6 months) 8000 × 1261 4,000 Clerical staff (121 month) 60,000 ×1.512 7,500
Manager ( 21 month) 4000 × 1 2.5 167
Miscellaneous Expenses (112 months) 36,000 × 1.512 4,500 27,590
Net Working Capital 3,785
Add: 10% Margin for Contingencies 379
Net working capital required 4,164
Exercise 9
A performa cost sheet of a company provides the following particulars:
Elements of Cost Amt. Per Unit (Rs.)
Raw Materials 140
Direct Labours 60
Overheads 70
Total Cost 270
Profit 30
Selling Price 300
Further particulars available are:
Raw materials are in stock on an average for one month. Materials are in process on an average for half a month. Finished goods are in stock on an average for one month.
Credit allowed by suppliers is one month – credit allowed to customers is two months. Lag in payment of wages is 121 weeks. Lag in payment of overhead expenses is one month. One fourth of the output is sold against cash. Cash in hand and at bank is expected to be Rs. 50,000.
Working Capital Management 187
You are required to prepare a statement showing the working capital needed to finance, a level of activity of 2,40,000 units of production. You may assume that production is carried on evenly throughout the year; wages and overhead accrue similarly and a time period of 4 weeks is equivalent to a month.
Note: Year = 4×12 = 48 weeks Solution
Statement of Working Capital
Particulars Rs. Rs.
Current Assets
(i) Stock of raw materials (4 weeks) 2,40,000 × 14048 28,00,000
= 7,00,000 × 4
(ii) Work in process (2 weeks)
Raw materials 7,00,000 × 2 14,00,000
Direct labour 2,40,000 × 6048, 3,00,000 × 2 6,00,000
Overheads 2,40,000 × 7048 7,00,000
350000 × 2 27,00,000
(iii) Stock of finished good (4 weeks)
Raw Materials 7,00,000× 4 28,00,000
Direct Labour 30,000 × 4 1,20,000
Overheads 3,50,000 × 4 14,00,000
54,00,000 (iv) Sundry Debtors (8 weeks)
Raw Materials 7,00,000 × 8 × 34 42,00,000
Direct Labour 3,00,000 × 8 × 34 18,00,000
Overheads 3,50,000 × 8 × 34 21,00,000 81,00,000
Cash in hand and at Bank 50,000
1,90,50,000 (–) Current Liabilities
(i) Sundry creditors (4 weeks) 7,00,000 × 4 28,00,000 (ii) Wages Outstanding (112 weeks) 3,00,000 ×32 4,50,000
(iii) Lag in payment of overhead (4 weeks) 3,50,000 × 4 14,00,000 46,50,000
Net Working Capital required 1,44,00,000
Exercise 10
Mr. Siva wishes to commerce a new trading business and gives the following informations.
(i) The total estimated sales in a year will be Rs. 20,00,000.
(ii) His expenses are estimated fixed Expenses of Rs. 3,000 per month plus variable expenses equal to 10% of his turnover.
(iii) He expects to fix a sales price for each product which will be 33 % in excess13 of his cost of purchase.
188 Financial Management
(iv) He expects to turnover his stock six times in a year.
(v) The sales and purchases will be evenly spread throughout the year. All sales will be for cash but he expects one month’s credit for purchases.
Calculate
(i) His estimated profit for the year.
(ii) His average working capital requirements.
Solution
(i) Estimated profit of Mr. Siva for the year
Sales 20,00,000
(–) Gross Profit ( 20,00,000 × 3313 13313) 5,00,000
Cost of goods sold 15,00,000
Gross Profit 5,00,000
(–) Expenses
Fixed (3,000×12) 36,000
Variable 20,00,000×10/100 2,00,000
2,36,000 Net Profit 2,64,000 (ii) Statement of working capital
Particulars Rs.
Current Assets Stock
Turnover of stock is 6 times 2,50,000
Stock Turnover =
Cost of goods sold Average stock at cost 6 =
15,00,000 Average stock at cost
6 × Average stock at cost = 15,00,000 Average stock at cost = 15,00,000
6 = 2,50,000 Cash
To meet fixed expenses = 3,000 To meet variable expenses
20,00,000 × 10 100 × 1
12 = 16,667 19,667
Debtors
(as all sales are for cash only) –
2,69,667 Less: Current Liabilities:
Creditors (1 months)
15,00,000 × 121 1,25,000
Working capital required 1,44,667
Working Capital Management 189
Exercise 11
From the informations given below, you are required to prepare a projected balance sheet, profit and loss account and then an estimate of working capital requirements.
(a) Issued share capital 5,00,000
6% debentures 2,50,000
Fixed Assets at cost 2,50,000
(b) The expected ratios to selling price are
Raw materials 45%
Labour 20%
Overheads 15%
Profit 20%
(c) Raw materials are kept in store for an average of 121 months.
(d) Finished goods remain in stock for an average period of 2 months.
(e) Production during the previous year was 2,40,000 units and it is planned to maintain the rate in the current year also.
(f) Each unit of production is expected to lag in process for half a month.
(g) Credit allowed to customers is two months and given by suppliers is one month.
(h) Selling price is Rs. 6 per unit.
(i) There is a regular production and sales cycle.
(j) Calculation of debtors may be made at selling price.
Solution
Rs.
(i) Calculation of sales
Total Sales = 2,40,000×6 14,40,000
(ii) Calculation of Amount blocked in inventories.
(a) Stock of Raw Material 1,44,000× 45
100×1.5
12 81,000
(b) Stock of finished goods at cost (Material + Labour + Overheads)
80 2 1, 44,000
100 12
× × 1,92,000
190 Financial Management
(c) Work-in progress at cost
(Material + Labour + Overheads) 80 .5
144000×
100×12 48,000
(iii) Calculation of Amount locked up in Debtors Total sales 14,40,000
Debtors = 14,40,000× 2
12 2,40,000
(at selling price, as given) (iv) Calculations of creditors
(For Raw Materials)
Total Purchases = 14,40,000× 45
100 6,48,000
Creditors = 6,48,000× 1
12 54,000
Projected profit and loss account
To Cost of Goods sold : By Sales 14,40,000
To Raw Materials 6,48,000
To Labour 2,88,000
To Overheads 2,16,000
To Gross Profit 2,88,000
14,40,000 14,40,000
To Interest on Debentures 15,000 By Gross Profit 2,88,000
To Net Profit 2,73,000
2,88,000 2,88,000
Projected balance sheet
Liability Rs. Assets Rs. Rs.
Share Capital 5,00,000 Fixed Assets (at cost) 2,50,000
6% Debentures 2,50,000 Current Assets
Profit and Loss A/c 2,73,000 Stock 81,000
Creditors 54,000 Work in Process 48,000
Finished Goods 1,92,000
Debtors 2,40,000
5,61,000 Cash and Bank (Balance for) 2,66,000 10,77,000 10,77,000
Working Capital Management 191
Exercise 12
V.S.M. Ltd. is engaged in large scale retail business. From the following informations you are required to forecast their working capital requirements.
Projected Annual Sales Rs. 130 lakhs Percentage of net profit on cost of sales 25%
Average credit period allowed to debtors 8 weeks.
Average credit period allowed by creditors 4 weeks.
Average stock carrying 8 weeks (in terms of sales requirements).
Add : 10% to computed figures to allow for contingencies.
(MBA/MK Uni. May 2005) Solution
Sales 1,30,00,000
Gross profit 25% of sales 32,50,000
Cost of goods sold 97,50,000
Statement showing working capital
Particulars Rs.
Current Assets
(i) Debtors (97,50,000 x 8
52) 15,00,000
(ii) Stock (97,50,000 x 528 ) 15,00,000
Total current assets 30,00,000
(–) Current Liabilities
Creditors (97,50,000 x 4
52) 7,50,000
Net working capital 22,50,000
Add: Contingencies 10% 2,25,000
Net Working Capital Required 24,75,000
Exercise 13
Prepare an estimate of working capital requirements.
(i) Projected annual sales—80,000 units.
(ii) Selling price Rs. 8 per unit.
(iii) Percentage of profit 20%.
(iv) Credit allowed to debtors—10 weeks.
(v) Credit allowed to suppliers—8 weeks.
(vi) Average stock holding (in terms of sales)—10 weeks.
(vii) Allow 20% for contingencies.
(MFM/Bharathidasan AP, 2002)
192 Financial Management
Solution
Sales 80,000 Units
Selling Price Rs. 8
Total sales in Rs. 6,40,000
Sales Rs. 6,40,000
Profit 20% of sales 1,28,000 Cost of Goods Sold 5,12,000
Statement of Working Capital
Particulars Rs.
Current Assets
i. Debtors (5,12,000 x10
52) 98,462
ii. Stock (5,12,000 x10
52) 98,462
Total Current Assets 1,96,924
Less: Current Liabilities
Creditors (5,12,000 x 8
52) 78,769
Net Working Capital 1,18,155
Add : Contingencies 20% 23,631
Net Working Capital Required 1,41,786
Cash Management Exercise 14
A Company expects to have Rs. 37500 cash in hand on 1st April, and requires you to prepare an estimate of cash position during the three months.
April, May and June the following information is supplied to you:
Month Sales Purchases Wages Factory Office Selling
Rs. Rs. Rs. Expenses Expenses Expenses
Rs. Rs. Rs.
Feb 75,000 45,000 9,000 7,500 6,000 4,500
March 84,000 48,000 9,750 8,250 6,000 4,500
April 90,000 52,500 10,500 9,000 6,000 5,250
May 1,20,000 60,000 13,500 11,250 6,000 6,570
June 1,35,000 60,000 14,250 14,000 7,000 7,000
Other Information:
(i) Period of credit allowed suppliers 2 months.
(ii) 20% of sales for cash and period of credit allowed to customers for credit is one month.
(iii) Delay in payment of all expenses:1 month.
Working Capital Management 193
(iv) Income tax of Rs. 57,500 is due to be paid on June 15th.
(v) The company is to pay dividend to shareholders and bonus to workers of Rs.
15,000 and Rs. 22,500 respectively in the month of April.
(vi) A plant has been ordered to be received and paid in May. It will cost Rs. 1,20,000.
(Periyar University M.Com., Nov. 2005)
Cash Budgets of April, May, June
Particulars April May June
Opening Balance b/d 37,500 10,950
Sales (i) Cash 20% 18,000 24,000 27,000
(ii) Credit sales 67,200 72,000 96,000
(One month)
Total Receipts (A) 1,22,700 1,06,950 1,23,000
Payments :
Purchase 45,000 48,000 52,500
Wages 10,500 13,500 14,250
Factory Expenses 8,250 9,000 11,250
Office Expenses 6,000 6,000 6,000
Selling Expenses 4,500 5,250 6,570
Income Tax – – 57,500
Dividend to Shareholders 15,000 – –
Bonus to workers 22,500 – –
Plant Cost – 1,20,000 –
Total Payments (B) 1,11,750 2,01,750 1,48,070
Balance c/d (A-B) 10,950 (–)94,800 (–)25,070
Bank Overdraft – (+)94,800 (+)25,070
Assumed that the company has arranged overdraft facility.
Receivable Management Exercise 15
A Company’s collection period pattern is as follows:
• 10% of sales in the same month
• 20% of sales in the second month
• 40% of sales in the third month
• 30% of sales in the fourth month
The sales of the company for the first three quarters of the year are as follows:
Month Quarter I Quarter II Quarter III
First 15,000 7,00 22,500
Second 15,000 15,000 15,000
Third 15,000 22,500 7,500
45,000 45,000 45,000
194 Financial Management
Working Days 90 90 90
You are required to calculate the average age of receivables and comment upon the results.
(MFM/Bharathidasan University AP 2001) Solution
The collection period of the company’s policy indicates that the outstanding receivables at the end of each month will consist of 90% of the month’s sales, 70% of the previous month’s sales and 30% of the sales made two months earlier.
Statement of Accounts receivable and their age.
Sales I Quarter II Quarter III Quarter
30% 1st Month 4,500 2,250 6,750
70% 2nd Month 10,500 10,500 10,500
90% 3rd Month 13,500 20,250 6,700
28,500 33,000 24,000
Average of receivable is = Accounts receivable (Debtors)
Sales × No. of working days
= 28,500
45,000 ×90 33,000
45,000 × 90 24,000 45,000 × 90
= 57 Days 66 Days 48 Days
The average age of receivable is affected because of sales is fluctuation.
MODEL QUESTIONS 1. Discuss the objectives of inventories.
2. Explain various inventory control techniques.
3. What are the techniques of classification of inventory?
4. Explain the motives of holding cash.
5. Discuss the cash management techniques.
6. What is receivable management? Explain it.
7. S Ltd. is engaged in large-scale retail business. From the following particulars you are required to calculate the working capital requirement.
Project annual sales Rs. 208 lakhs
% of net profit on cost of sales
33 %
13Working Capital Management 195
Average credit period allowed to Drs. 6 weeks Average credit period allowed to Crs. 3 weeks Average stock (in term of sales) 6 weeks Add 10% to allow for contingencies.
(Ans. 29.7 lakhs) 8. The following details relating to Mr. Santosh want to start trading business. You
are required to calculate.
(a) Estimate profit.
(b) Working capital requirements.
Estimate annual sales – Rs. 12,00,000
Expected profit on purchase –
33 %
13 Fixed expenders Rs. 3,000 pm. of whichDepreciation amounts to Rs. 600 and variable Expenders chargeable to PLL a/c equal 8% of sales.
Stock term over – 6 times
Sales and purchases will occur evenly throughout the year Creditors allowed 1 month credit
Debtors allowed 2 months credit 30% of cash sales.
(Ans. (a)Net Profit Rs. 1,68,000 (b) Working capital Rs. 32,25,400) 9. Calculate the working capital from the following particulars:
Rs.
(a) Annual Expenses:
Wages 52,000
Stores and Material 9,600
Office Salaries 12,480
Rent 2,000
Other Expenses 9,600
(b) Average amount of stock to be maintained:
Stock of finished goods 1,000
Stock of materials and stores 1,600
Expenses paid in advance:
Quarterly advance 1,600 p.a.
(c) Annual Sales
Home Market 62,400
Foreign Market 15,600
196 Financial Management
(d) Lag in payment of expenses:
Wages 1
12 weeks
Stores and Material 1
12 months
Office Salaries 1
12 months
Rent 6 months
Other Expenses 1
12 months (e) Credit allowed to customers :
Home Market 6 weeks
Foreign Market 1
12 weeks
(M.Com. Rajasthan) (Ans. 5,230) 10. Arvind Ltd. supplies the following informations for calculating the working capital firm levels of activity of Rs. 2,40,000 units. The cost structure particulars are:
Cost Per Unit Rs.
Raw materials 30
Direct labour 10
over-heads 20
Total 60
Profit 15
Selling price 75
(a) Raw materials are in store on average for 1 month.
(b) Work in process (100% complete in regard to materials and 50% for labour and overheads for half a month’s production.
(c) Finished goods remain in godown on average for a month.
(d) Suppliers one month to customers 2 months (calculation of customers may be made on selling price).
(e) Minimum cash balance required is Rs, 30,000.
(f) The production is evenly throughout the year.
(Ans. Rs. 46,80,000) 11. The Board of Directors of Nanak Engineering Company Private Ltd. request you to prepare a statement showing the working Capital Requirements for a level of activity of Rs. 1,56,000 units of production.
Working Capital Management 197
The following informations are available for your calculations:
(A) Per unit (Rs.)
Raw Materials 90
Direct Labour 40
Overheads 75
205
Profit 60
Selling price per unit 265
(B)
(i) Raw materials are in stock, on average one month.
(ii) Materials are in process, on average 2 weeks.
(iii) Finished goods are in stock, on average one month.
(iv) Credit allowed by suppliers, one month.
(v) Time lag in payment from debtors, 2 months.
(vi) Lag in payment of wages, 1
12weeks.
(vii) Lag in payment of overheads is one month.
20% of the output is sold against cash. Cash in hand and at bank is expected to be Rs. 60,000. It is to be assumed that production is carried on evenly throughout the year; wages and overheads accrue similarly and a time period of 4 weeks is equivalent to a month. (C.A. Final) (Ans. 66,06,000) 12. A company Ltd. supplies the following cost sheet:
Element of cost
Raw material — 45%
Labour — 15%
Overheads — 25%
The following further particulars are available.
(i) Raw materials remain in shares 5 weeks.
(ii) Cash in processing 4 weeks.
(iii) Finished goods in own house 6 weeks.
(iv) Credit period to customers 8 weeks supplie 4 weeks.
(v) Lag in payment wages 2 weeks.
(vi) Selling price per unit Rs. 60.
You are required to prepare the working capital requirements adding 15%
for contribution in all levels of activity of 1,04,000 units of production made during the period.
(Ans. Rs. 20,17,100) Note: Debtors, calculate on the basis of cost.
198 Financial Management
13. On 1 April the director of XYZ Ltd. wants to know the amount of working capital required for the fourth coming year. Prepare a working capital and for cost the Balance sheet.
Issued share capital — Rs. 3,00,000
6% Debentures (floating charge on assets) — Rs. 1,00,000
Fixed assets — Rs. 1,50,000
Production during the previous year — 72,000 units Same level should continue during the current year.
The following is the cost sheet:
Raw materials — 40%.
Directs — 15%
Overheads — 25%
Raw materials are to remain in stock for 1 month, within process half a month, finished goods in warehouse for two months.
Credit allowed to debtors 2 months and creditors 1 month.
Selling price Rs. 8.
Work-in-process may be assumed to be 100%.
Complete in materials, one 50% complete in direct ways and overheads.
(Ans. W/C Rs. 1,72,800; NP 1,09,200; B/S 4,00,000;
Rs. 58,000 cash/bank balancing figure)