I would like to thank my committee members who have made interesting and useful comments during my thesis work. I would also like to thank all the staff, project staff and researchers of the Multiphase Lab, Department of Chemical Engineering, IIT Hyderabad, for their help and suggestions whenever required. I must not ignore the special contributions of the institute's library to provide all the necessary books, articles and access to many useful domains to enrich my asset list in this research work.
Regimes are characterized by differences in the shape of the rising bubble (for example, an ellipsoidal, axisymmetric cap with a rim and a donut) as well as in the path it traverses (for example, a straight, zigzag, and spiral path). But at high Ga and Eo, there is a discrepancy in terms of the regime demarcation boundary, indicating that the initial bubble state is a critical parameter. Some examples include their role in rainfall, the heat budget of the atmosphere, chemical and biological dispersal, volcanoes and explosive lakes, and disease transmission [3].
The effect of these forces results in different bubble and drop behavior, depending on the bubble or drop size, density, and viscosity of the fluids involved. The encapsulated bubble has wide applications in the medical field, such as in ultrasound imaging, where tiny encapsulated bubbles called contrast agents are used to enhance image contrast.
Literature Review on Rising Bubble in a Liquid
The bubble drag coefficient of the spherical cap is independent of the bubble size with a constant value of 2.6. They concluded their work as, for spherical bubbles, viscosity plays a major role in determining terminal velocity, but for ellipsoidal bubbles, surface tension is more important and spherical cap bubbles are independent of fluid properties. The size of the bubbles they studied ranged from 1 to 4 mm in diameter.
They also observed the three-dimensional motion of the bubble behaved differently with change in surfactant concentration. They found that as the size of the bubble increases, the oblate spheroid bubble rises in a wobbly and spiral fashion. As the size of the bubble changes, its shape and motion will behave differently in different liquids.
![Figure 1.1: (a) Spherical bubble, (b) Disk shaped bubble, (c) Oblate ellipsoidal cap bubble, (d) Spherical cap bubble, (e) Skirted bubble, Figure taken from Bhaga et al [1] with permission](https://thumb-ap.123doks.com/thumbv2/azpdfnet/10488316.0/13.892.147.772.186.928/figure-spherical-oblate-ellipsoidal-spherical-skirted-figure-permission.webp)
Key Contribution
Structure of the Thesis
This thesis describes experimental work on the shape and path of a rising gas bubble. The key motivation in this study was to verify whether we can experimentally observe the behavior of gas bubbles as reported in the simulation study of Tripathi et al. To better appreciate the present experimental results, we present some details of the simulation results of Tripathi et al. [2] as the background of our experimental study.
Non-dimensional numbers affecting rising gas bubble dy- namics
In general, for all multiphase flows where there is an interface between two different fluids, the important non-dimensional parameters Reynolds number Re and Weber number We are used to analyze the fluid flow. Reynolds number, Re = inertial force. But in the case of a gas bubble rising in a viscous liquid, its terminal velocity is not constant during its motion, and this terminal velocity term is an unknown value. Thus, in these cases this velocity term is replaced by the gravitational velocity term √. gR, which is a constant value throughout the motion of the bubble and is a known value.
If the terminal velocity term is replaced by the gravity term, the Reynolds number becomes the Galilei number and the Weber number becomes the Eotvos number. The other two non-dimensional parameters important to a rising bubble problem are density ratio and viscosity ratio. This roughly corresponds to the air-water system, where air is the dispersed phase and water the continuous phase.
So there is another dimensional number known as the Morton number which is independent of the bubble size and is defined by.
Rising bubble phase plot
Bubbles belonging to this regime show an axisymmetric cap shape with a thin rim that follows the main body of the bubble. The formation of a dimple in the lower center of the bubble causes its shape to change to a donut or toroidal shape by ejecting small satellite bubbles. This Morton number is independent of the bubble size and depends only on the physical properties of the liquid.
So as the size of the bubble increases, the position of the bubble in the Eo-Ga phase graph increases along the constant Morton number line corresponding to that particular fluid. Therefore, by knowing the properties of the liquid and the size of the bubble, it is possible to predict its nature very easily. Similarly, any shape asymmetry in a horizontal plane results in an imbalance of forces, leading to path oscillation of the bubble.
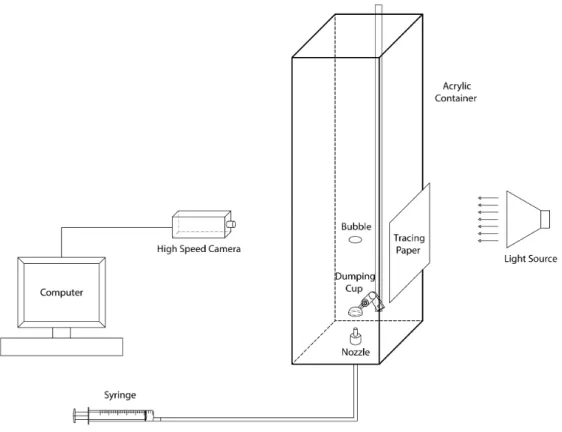
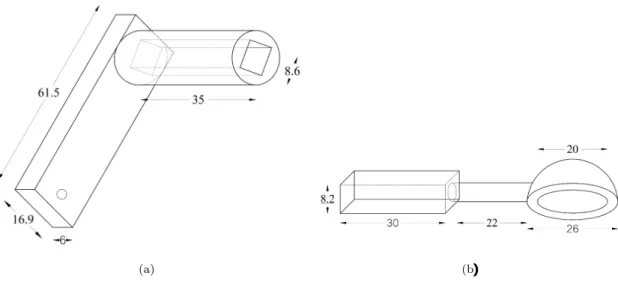
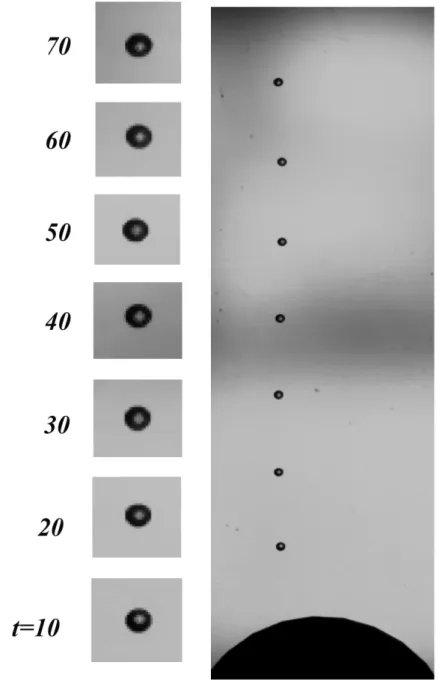
The bubbles are created by pushing the plunger of the syringe, which is initially filled with air. The bubble radius was estimated to be 1.37 mm based on the front view image and pixel per mm calibration. The role of the stick is to turn the deposit container after it is filled with air to release all the air at once as one bubble.
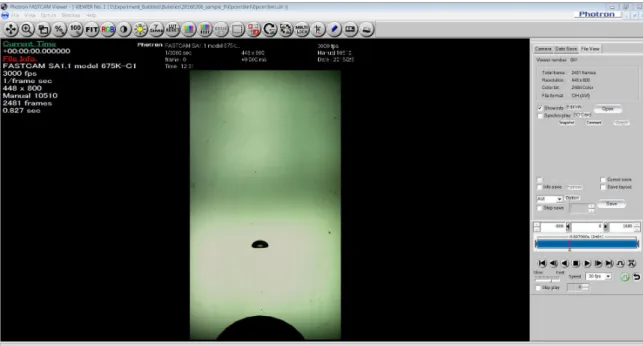
To obtain the dimensions of the bubble, it is necessary to calibrate the camera. This is done by capturing a graduated scale that stays exactly in the same plane of the nozzle and perfectly vertical. By changing the size of the bubble, we got some points along this line.
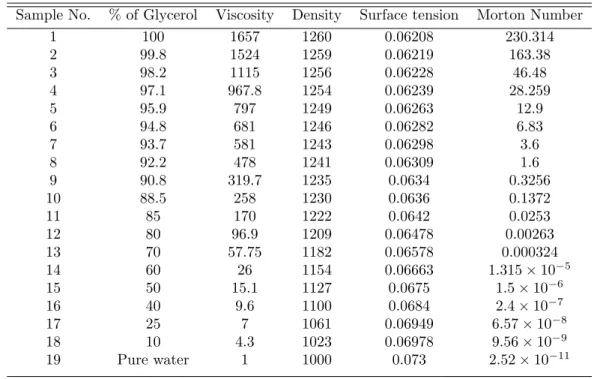
Aqueous glycerol solutions with different concentrations were chosen to change the Morton number of the liquid medium.
![Figure 2.1: Five different regimes on the Eo-Ga phase plot. Figure taken from Tripathi et al [2] with permission](https://thumb-ap.123doks.com/thumbv2/azpdfnet/10488316.0/18.892.154.781.214.668/figure-different-regimes-phase-figure-taken-tripathi-permission.webp)
Experimental Procedure
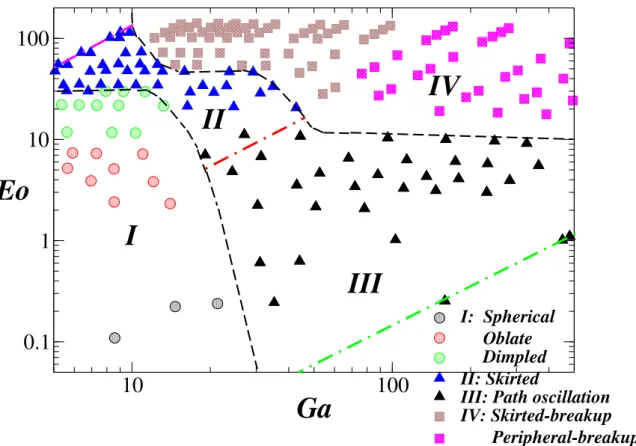
We performed approximately 297 experiments on gas bubble ascent in aqueous glycerol solutions of 18 different concentrations and in pure Millipore water. This helped us cover almost the entire area of the Ga-Eo phase graph, as shown in Figure 2.1. In each glycerol sample, we created an average of 16 bubbles of different sizes with a radius ranging from 3.6 mm to 26.7 mm using the dump cup mechanism.
After verifying the path and shape of each bubble, clear solid lines are drawn in phase plots, which divide it into four different regimes. Through our experimental investigation, we succeeded in replicating the Galilei-Eotvo phase plot of a gas bubble rising in viscous liquids. But this phase plot is slightly different from that obtained through numerical simulation by Tripathi et al. (Figure 2.1).
The first important thing we noticed is that, unlike five different regimes in the phase plot as in Figure 2.1, here there are only four regimes. We could not get a single bubble with a toroidal break, which is in regime V in Figure 2.1. But in our case we could not keep the bubble shape as spherical for bigger bubble.
It is practically impossible to keep a large bubble in an exactly spherical initial shape, because for a larger bubble the inertial force is very large compared to the surface tension. Regime V of the numerical simulation (Figure 2.1) consists of bubbles with high values of Ga and Eo numbers, which implies a higher inertial force and a relatively lower surface tension. Viscosity ratio and density ratio were also kept constant in all simulations by Tripathi et al.
So each Morton number line in the phase diagram corresponds to a particular value of the density ratio and the viscosity ratio.
Path oscillation IV: Skirted-breakup
If the bubble diameter in two perpendicular directions changes per pixel by 2×mm, we classify them as tilted spherical bubbles. The bubble in regime II shows an axisymmetric cap shape with a thin edge that follows the main body of the bubble and rises vertically upward without any path oscillation. This thin part of the edge moves in a wave-like manner and does not exhibit the axisymmetric nature, which makes the bubble asymmetrical in shape.
Due to the low surface tension of the liquid, the bubble cannot have a spherical shape and the edges of a dimple-shaped bubble are extended to form a thin skirt. In fact, these bells have an asymmetrical spherical cap shape, but a very thin skirt-like structure runs behind the main body of the bell. Also, the shape continually changes as it rises, making the bubble asymmetrical in shape.
Before rupture, the bubble in this regime possesses a skirt or an oblate spherical shape. In skirted breakup, a thin skirt of the bubble detaches from its main body, forming a large axisymmetric spherical cap and several small bubble fragments in its cap's wake. Here, as the bubble rises, its edges break off from the main body of the bubble and form small satellite bubbles.
On the other hand, by varying the Eotvos number and keeping the Galilei number constant (Figure 4.14(c)), the bubble with smaller Eotvos number travels with higher rate of rise compared to others. These numbers are a function of the fluid's viscosity, density and surface tension, as well as the radius of the bubble. 2] chose the initial shape of the bubble as spherical in all cases, which is practically impossible since larger bubble cannot maintain spherical shape due to its low surface tension compared to high inertial force.
The bubble is asymmetric in regime I, asymmetric in regime II and III, and breaks in regime IV. This work can be continued by changing the initial state of the bubble as a semicircular shape, the shape of the pouring cup from which the bubble is released, and taking the exact viscosity and density ratio for different fluids, to carry out the numerical simulation to to get exactly the same phase diagram as in Figure 2.1. An experimental study of the resistance and shape of air bubbles rising in different liquids.
![Figure 2.2: Eo-Ga phase plot with constant Morton number lines. Figure taken from Tripathi et al [2] with permission](https://thumb-ap.123doks.com/thumbv2/azpdfnet/10488316.0/19.892.139.777.432.784/figure-phase-constant-morton-number-figure-tripathi-permission.webp)