It can be represented as a vector in the coordinate system defined by the location of the nuclei. In the above equation, when (Eb-Ea) is approximately equal to h=the value of |Cb. t)|2 is large and so the transition from A to B will only occur if the energy of the light is approximately equal to the energy separation between the two states. New intensity decays are created in the sample as long as there is a non-zero intensity in L(tk). The time-resolved anisotropy decay data were analyzed based on the equations.
If only the beginning of the reaction is monitored (the first 60 seconds or less), [S] changes. The concentrations mentioned below correspond to the final concentrations of the reactants in the cuvette. Here 0 is the fluorescence lifetime in the absence of the quencher, while is the lifetime in the presence of the quencher.
Figures 4.1 A-4.1 E show the profiles of the hydrolysis reaction in the presence of increasing concentrations (expressed as fractional volume occupancy) of dextrans (15–500 kDa). This means that the size of the thickening agent plays an important role in the kinetics of the reaction. Indeed, thickening agents have been shown to affect the association state of the enzyme, which may be related to changes in the specific activity of the enzyme (Minton and Wilf, 1981). The question we ask ourselves is why do larger dextrans have a large effect on the reaction rate? We now know that a) their observed decrease is somewhat less than the actual decrease due to a countervailing increase in enzyme activity, and b) viscosity accounts for only a minor part of this effect.
We have observed the kinetics of the PNPP hydrolysis reaction in the presence of obstacles in 200s or later. In Section 5.1 the detection of near-ultraviolet and visible absorption and luminescence features of L-lysine HCl is discussed.
Novel absorbance and fluorescence characteristics of L-lysine.HCl 87
At this point, we attributed the formation of lysine aggregates to the presence of four methylene groups on the lysine side chain. The exact nature of the chromophore responsible for the absorption features cannot be determined. Importantly, the present investigation showed that the above spectral features depend on the proximity of the lysine side chains in the protein.
Consequently, the possibility that the absorbance features are due to scattering can be ruled out. Steady-state fluorescence anisotropy (rss) gives us a time integrated average value of the rotational motion of molecules in the excited state. Average lifetime (m) of the labeled protein was calculated in pH 7 and pH 12 buffers to enable comparison.
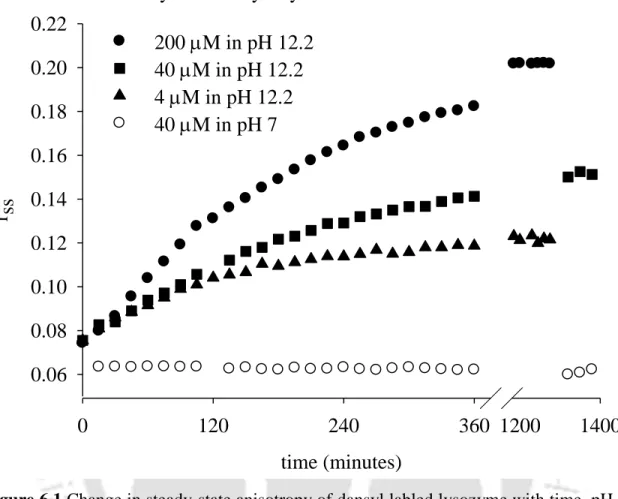
The pH dependence of aggregate formation was also studied with 40 µM dansyl-labeled lysozyme, as shown in Figure 6.6.

Near ultra-violet absorption arising from lysine residues in close proximity: a probe to
There is a clear difference between the spectra of the protein and polylysine from that due to scattering. The big question that remains to be answered is the nature of the chromophore involved. However, this parameter is dependent on both the fluorescence lifetime and rotational correlation time of the fluorescent probe.
Solutions of the dansyl-labeled proteins in buffers of both pH 7 and pH 12 had their emission maxima at 443 nm. Now the steady-state anisotropy is a function of both the fluorescence lifetime () and the rotational correlation time ( of the protein (Equation 2.48). Figures 6.2A and 6.2B show the intensity decay profiles of the labeled lysozyme at pH 7 and pH 12 buffer respectively.
Aggregates that formed with 40 M dansyl labeled lysozyme at pH 12.2 were observed to be reversible in the first 60 min of the experiment, however, aggregates obtained after t=60 min were quite irreversible.

Slow aggregation of lysozyme in alkaline pH monitored in real
Steady-state fluorescence measurements 105
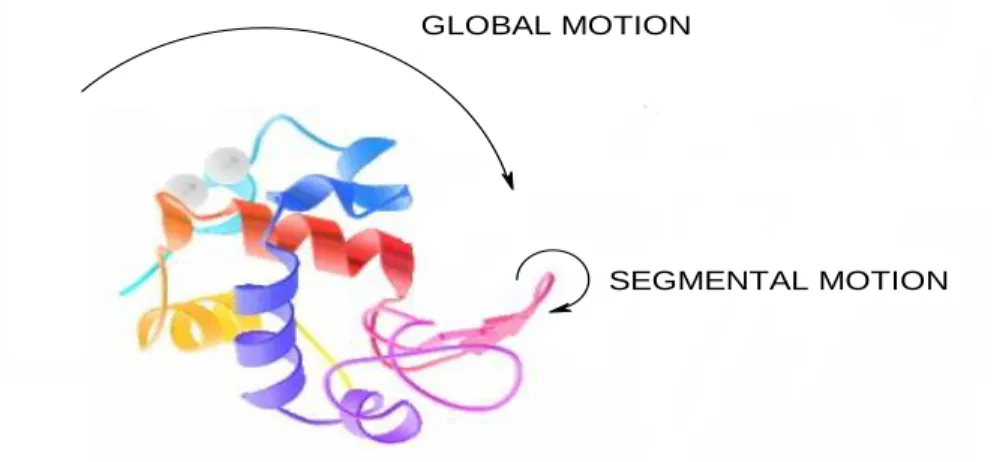
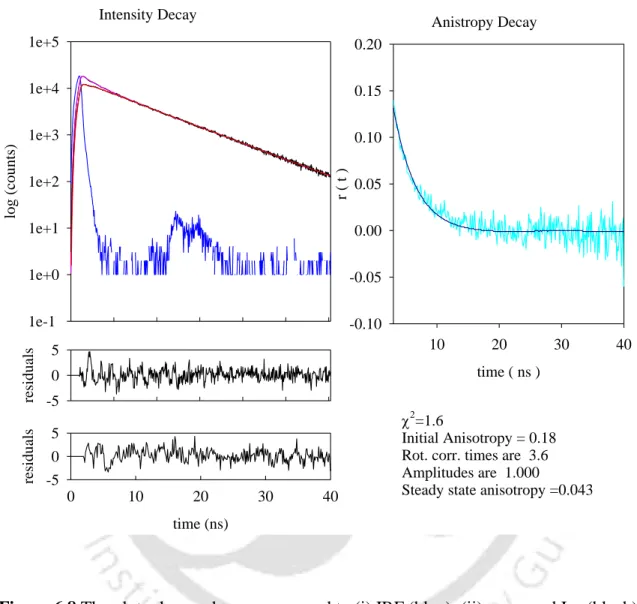
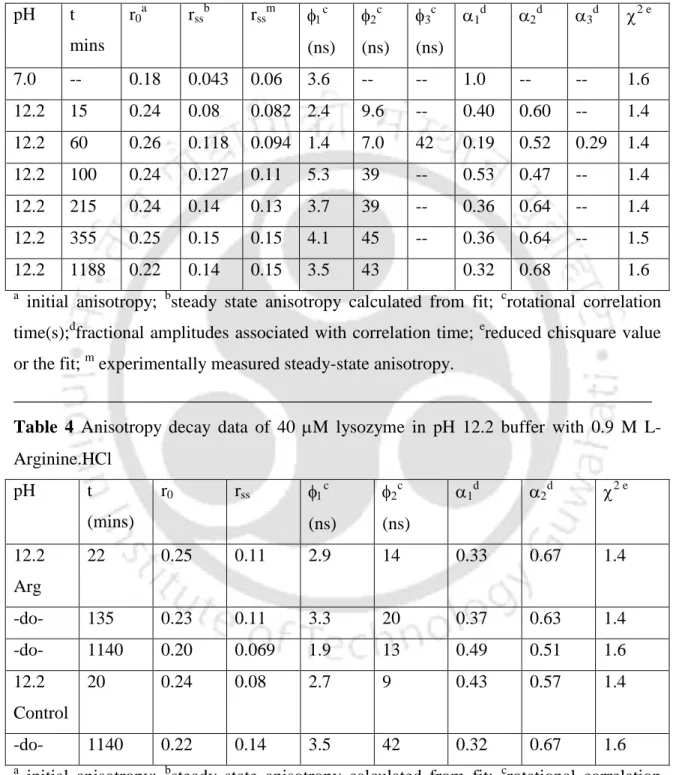
RSS of 0.06 was obtained with different concentrations of labeled protein in pH 7 buffer (data not shown) and the values were observed to remain unchanged over time. The anisotropy decay profile at pH 7 shows a fast decay while the profile of the sample at pH 12.2 decays less quickly even at the beginning of the measurement. Analysis of the anisotropy decay profiles (details are given in chapter 3—section 3) revealed that at pH 7 the labeled protein undergoes a mono-exponential decay with a rotational correlation time of 3.6 ns.
The almost similar size of the long component after overnight incubation indicates that the aggregates that form are quite stable. This slight increase from the initial value may be due to the inhibition of segmental movement of the aggregate. Their populations obviously decrease significantly with time as aggregation proceeds, which results in the formation of more higher oligomers.
Steady-state anisotropy measurements of the protein in 150 mM KCl at pH 12.2 showed no change compared to the control of the same concentration at pH 12.2 in the absence of KCl (Fig. 6.7). NMR identification and characterization of the flexible regions in the 160 kDa molten globule aggregate of barstar at low pH. Physical, morphological, and functional differences between pH 5.8 and 7.4 aggregates of the Alzheimer's amyloid peptide Abeta J.
Time-resolved fluorescence measurements 107
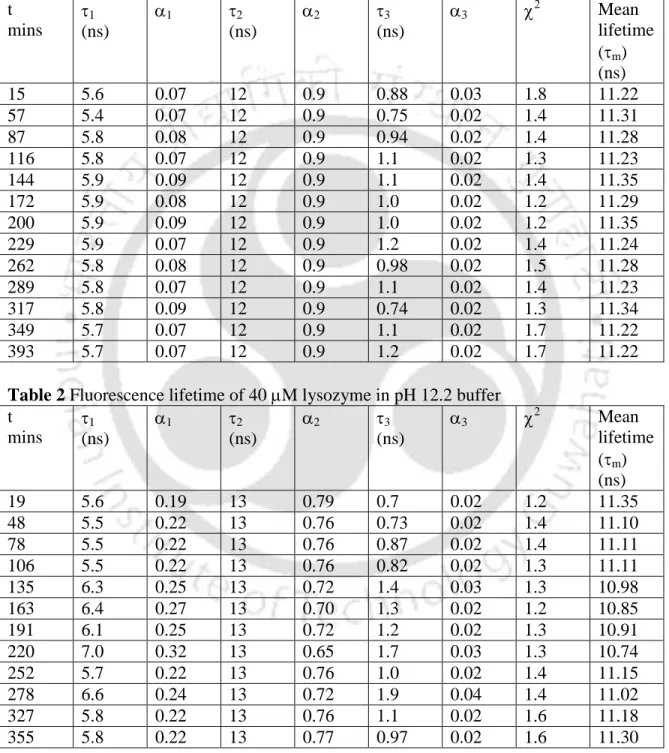
Tables 1 and 2 show the data obtained by analyzing the intensity drop profiles at pH 7 and pH 12, respectively. The curves in (a) shown above correspond to (i) IRF; (ii) measured intensity decay with fit; and (b) corresponds to the residual plot. The curves in (a) correspond to (i) IRF; (ii) measured intensity decrease with adaptation; (b) corresponds to the plot of residuals.
The almost unchanged value of mean lifetimes in pH 7 and pH 12.2 buffers, respectively, may be due to attachment of the dansyl probe to amino groups of L-lysine residues in the protein that remain exposed to the polar solvent in both the monomeric and aggregated forms. forms. The intensity decay shown in figure 1 can be fit to 3-exponential decay models; hence the 3 lifetime components. The mean fluorescence lifetime (m) was determined in pH 7 buffer (depicted by open squares) and in pH 12.2 buffer (shown as open circles).
The values were observed to remain unchanged for the duration of the measurement (∼360 minutes) and were also observed not to vary with pH.
Time-resolved anisotropy decay measurements 112
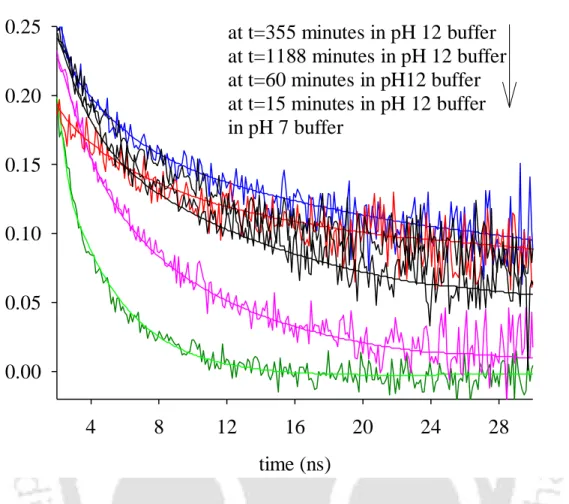
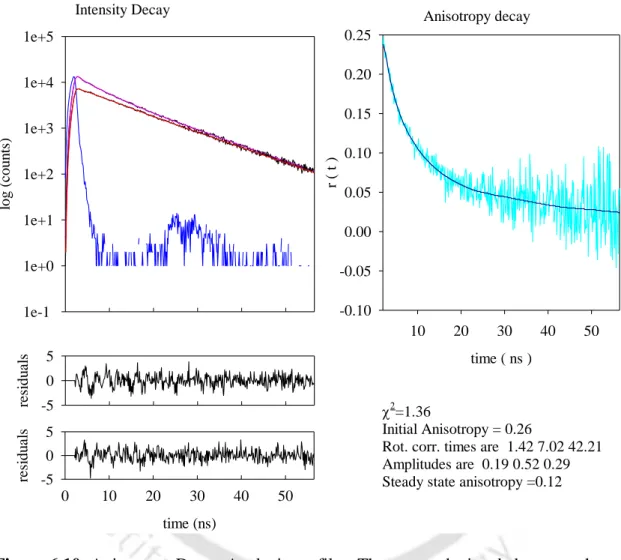
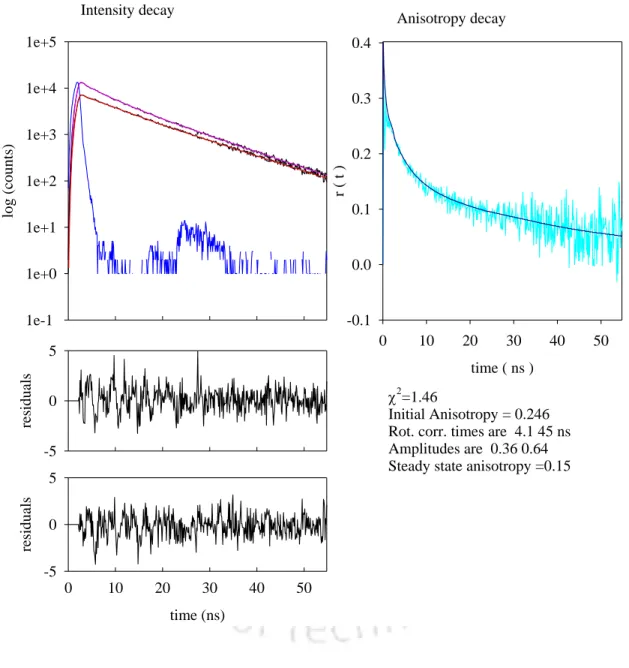
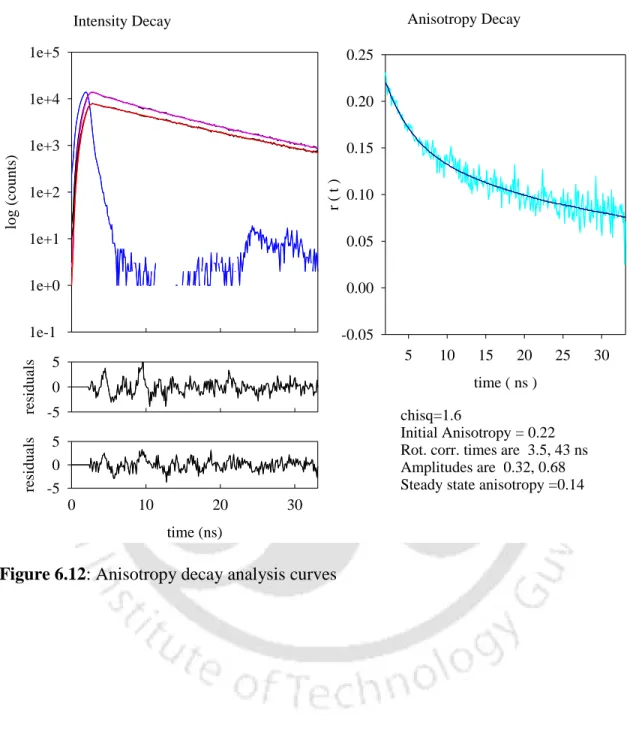
This is a clear indication of the formation of aggregates in solution, since a protein the size of lysozyme (Mr~14,300 Da) in its monomeric form cannot otherwise have such a long correlation time. After overnight incubation, a negligible decrease in the long component was observed, from 45 ns at t=355 minutes to ∼43 ns at t=1188 minutes. The short component showed an increase in magnitude from 2.4 to 4.1 ns, and after overnight incubation the value decreased slightly to 3.5 ns.
This anisotropy decay profile had to be fitted to a 3-exponential decay model, as analysis with a 2-exponential model yielded a reduced 2 value of 3.12. The need to fit the data to a 3-exponential decay model indicates the presence of a heterogeneous ground state population of oligomers due to the presence of dimeric and multimeric aggregate species in the initial phase. Another interesting observation was made, namely that the aggregates appear fairly reversible for the first 60 minutes (see Table 5), after which they tend to be irreversible.
This may, as previously mentioned, indicate the presence of a significant population of smaller oligomers viz. dimers and perhaps even monomers along with the higher oligomers at pH 12.2 in the first 60 minutes.
Effect of L-Arginine.HCl on aggregation 113
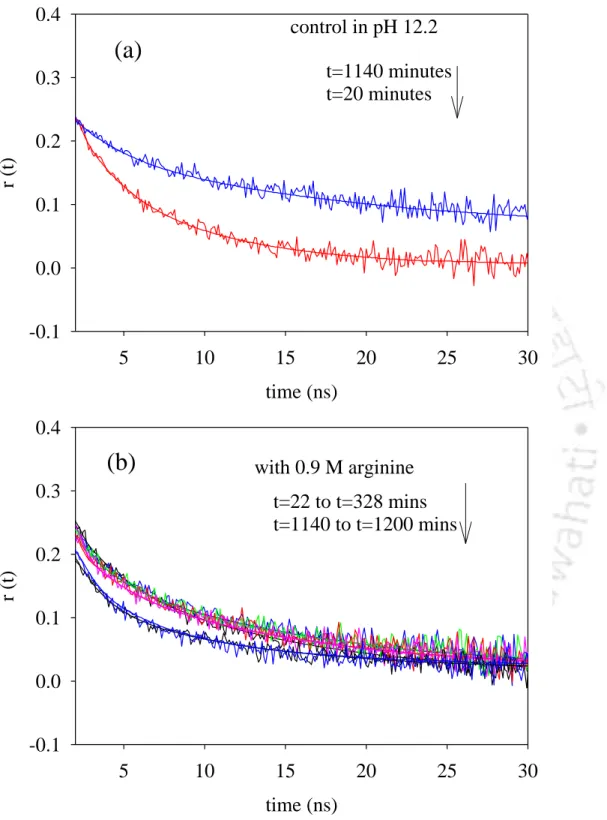
We observed that in the presence of high concentrations of arginine, 0.9 M, in buffer pH 12.2, the anisotropy decay showed a much lower residual anisotropy at t=1140 minutes compared to that obtained in the absence of arginine (Figure 6.5). The calculated steady-state anisotropy values were observed to decrease from an initial value of 0.11 to 0.07 after overnight incubation. In the case of the pH 12.2 control, however, the long correlation time component increased from 9 ns at t=20 minutes to 43 ns at t=1140 minutes with a corresponding increase in the steady-state anisotropy value from 0.08 to 0.14 (Table 3).
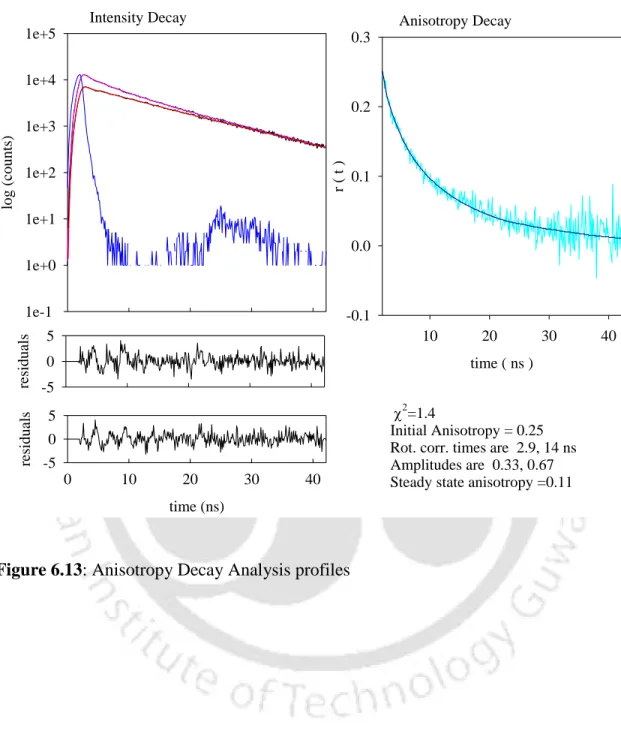
From the data in Table 4, it can be seen that 0.9 M arginine is effective in arresting aggregate growth. The initial value of the long component of the correlation time of 14 ns in 0.9 M arginine at pH 12.2 compared to 9 ns in the control at pH 12.2 can be explained by a 1.56-fold increase in viscosity of the protein solution upon addition of 0.9 M arginine. HCl. The value of 20 ns at t=135 min in the presence of 0.9 M arginine could indeed indicate the formation of small oligomers at the beginning which eventually dissociate.
Although the use of arginine as an aggregation inhibitor is known, its mechanism of action is still unknown.
Reversibility 116
In the figure above, the white columns show the rss values of the protein solutions immediately after preparation and the black columns indicate the rss values after overnight incubation of the protein solutions in the respective buffers at room temperature.
Experiments with guanidinium chloride 117
Experiments with KCl 118
Cytosol-mimetic chemistry: Kinetics of the trypsin-catalyzed hydrolysis of p-nitrophenylacetate upon addition of polyethylene glycol and N-tert-butylacetoacetamide J. Characterization of a molten globule state of bovine carbonic anhydrase III: loss of asymmetric residues in the aromatic environment. has a profound effect on both the near- and far-UV CD spectrum. A kinetic study of the competition between renaturation and aggregation during refolding of denatured-reduced egg white lysozyme.
Models of Amyloid Seeding in Alzheimer's Disease and Scrapie: Mechanistic Truths and Physiological Consequences of the Time-Dependent Solubility of Amyloid Proteins Annu. Effect of macromolecular crowding on the structure and function of an enzyme: glyceraldehyde-3-phosphate dehydrogenase. Probing the "molten sphere" intermediate state in protein folding by a hydrophobic fluorescent probe Biopolymers.
Protein misfolding and aggregation: new examples of the dark side of the protein world in medicine and biology Biochem Biophys Acta.