Furthermore, the project envisages the development of a modern laboratory called Discovery Center which will serve as a common facility for students' research at ICAR-IARI. Center for Advanced Agricultural Science and Technology (CAAST) is a student-centric sub-component of the World Bank-sponsored National Agricultural Higher Education Project (NAHEP) granted to ICAR-IARI to provide a platform for strengthening educational and research activities of postgraduates and doctoral students.
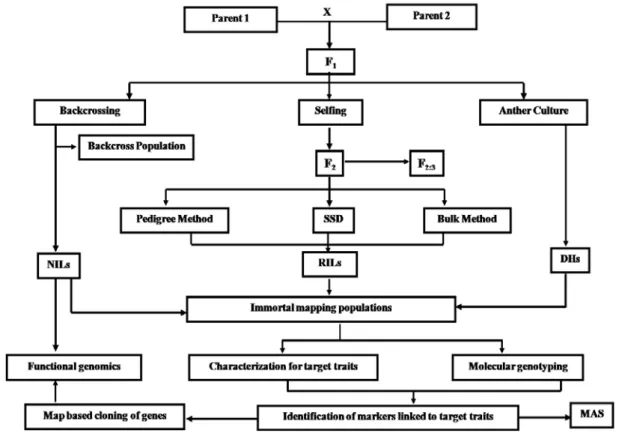
HYHORSPHQWDQGFKDUDFWHUL]DWLRQRIPDSSLQJ SRSXODWLRQVLQFURSV
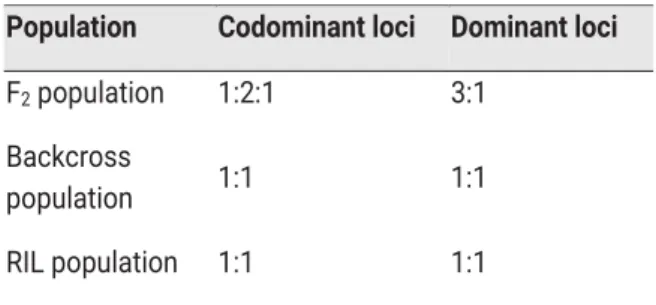
However, backcrossing with recessive parent (B2) or testcross would segregate at a 1:1 ratio regardless of the nature of the marker. Conceptually, the genetic composition of the two bulks is similar, but for the genomic region associated with the target trait.
PDSSLQJ
Multiple QTL Mapping
CIM controls the effect of other QTL present in other marker intervals on the tested chromosome and other parts of the genome. With the advent of new molecular biological tools and techniques and a better understanding of the genome, the concept of QTL is also changing over time.
47/PDSSLQJDSSURDFKHVLQFURSV
Single-Factor Analysis of Variance
Yes,” we conclude that the QTL is present in the same chromosomal region as the marker. The lower the P-value, the more likely the QTL truly exists in the marker region.
DWDFXUDWLRQKDQGOLQJRIJHQRW\SLFGDWDDQG VRIWZDUHIRUGDWDDQDO\VLV/LQNDJHPDSSLQJ
- Installing MAPMAKER/EXP
- Preparing data for MAPMAKER/EXP One of the most frustrating aspects in the use of
- Constructing linkage maps using MAPMAKER/EXP
- Loading the data file
- Finding linkage groups – two-point analysis Next step is to load the marker sequences for
- Exploring map orders by hand
- Displaying a genetic map
- Mapping a larger group
- Automatically finding map orders
- Verifying a Map Order
- Automatic error detection
- Visualizing the linkage groups and finishing the map
- Framing named linkage groups
- Drawing the chromosomes
- Finishing the map
- PARAMETER SETTING COMMANDS
- SEQUENCE RELATED COMMANDS
- TWO-POINT ANALYSIS COMMANDS
- MULTI-POINT ANALYSIS COMMANDS
- MAPPING COMMANDS
- DEBUGGING COMMANDS
For the first line, the syntax is data type
LJKWKURXJKSXWJHQRW\SLQJIDFLOLW\$YLVLW
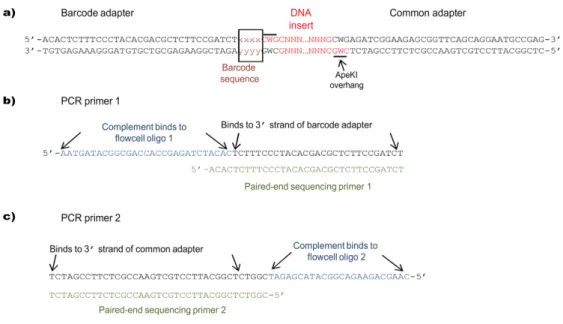
This is one of two major chip-based high-throughput SNP genotyping systems available. Barcode sequence positions and ApeKI overhangs are shown relative to the inserted DNA; (b) Sequences of PCR primer 1 and paired-end sequencing primer 1 (PE-1).
VVRFLDWLRQPDSSLQJLQFURSV
Occurrence of this type of LD occurs between loci that are conserved across the genome and are required to maintain the basic genome organization of the plant. Once the population substructure is identified, the Q matrix (population membership estimates) for each of the subpopulations is passed to the regression model as covariates. Another option is to calculate a false discovery rate (FDR), an estimate of the proportion of significant results that are false positives.
Efficient mixed model association (EMMA) is a mixed model approach that is better suited to association by considering population substructure and relatedness among individuals in the population. However, efficient genome-wide analysis of traits of interest would require a sufficiently large sample size and markers distributed throughout the genome with adequate density.
VVRFLDWLRQPDSSLQJXVLQJ*$3,7
- MLM (Mixed Linear Model)
- MLMM (Multiple Locus Mixed Linear Model)
- FarmCPU
- Analysis using GLM, MLM, MLMM and FarmCPU using one command
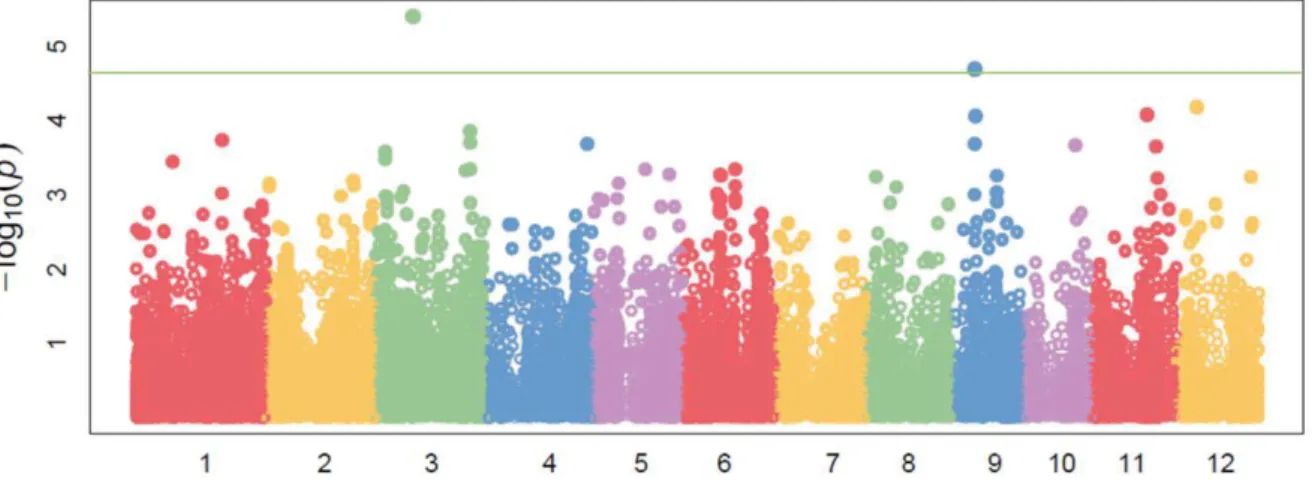
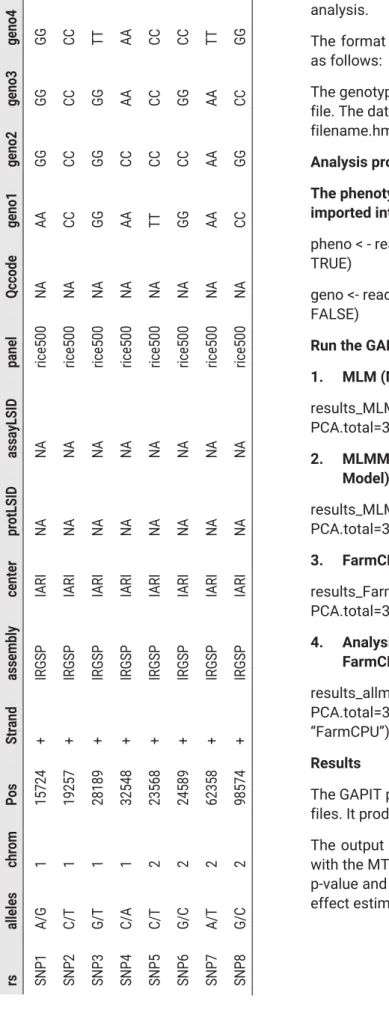
NAHEP – CAAST Training on Genomics Assisted Breeding for Crop Improvement, 30 September – October 2019, Division of Genetics, ICAR-Indian Agricultural Research Institute, New Delhi. Output results files include a table of results with MTAs along with p-values, FDR-adjusted p-value, and R-squared; and another table of allelic effect estimates. NAHEP – CAAST Training on Genomics Assisted Breeding for Crop Improvement, 30 September – October 2019, Division of Genetics, ICAR-Indian Agricultural Research Institute, New Delhi.
3KHQRPLFVWKHQH[WJHQHUDWLRQSKHQRW\SLQJ
Comparative analysis of QTLs mapped using a phenomic approach and previously mapped under field conditions demonstrated co-localization (Parent et al. 2015). Other phenomic features can also be used for phenomic selection (PS) in analogy to GS as a complementary method (Kumar et al. 2016). In indica rice (IR64), transcriptomic dynamics at different stages of vegetative and reproductive development have been studied using whole-genome microarray profiling (Sharma et al. 2012).
In chickpea, to track the tissue-specific gene expression, some transcriptome dynamics have been developed across multiple tissues, including flower bud, pod, root, shoot (Garg et al. 2011). For high-throughput and precise phenotyping of complex quantitative traits in many crop plants, an International Plant Phenomics Network (IPPN) has been developed (Clark et al. 2011).
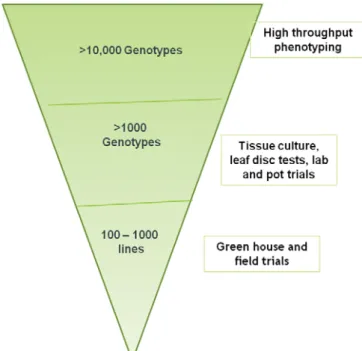
LJKWKURXJKSXWSKHQRW\SLQJIRUGLVHDVHUHVLVWDQFH
- Mutation breeding
- Single seed descent (SSD) method
- Shuttle breeding
- Doubled haploidy
- Marker assisting backcross breeding Phenotypic selection in terms of visible traits
- Speed breeding
- Miscellaneous
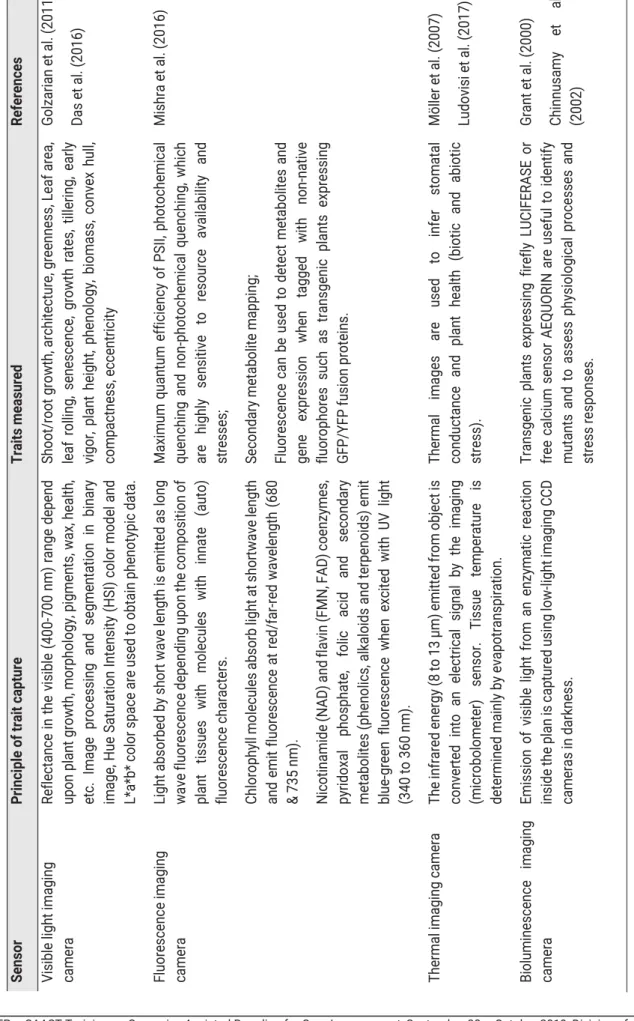
The evolution of modern hyperspectral sensors has increased the complexity of the measured data with a spectral range of up to 350 to 2,500 nm and a possible narrow spectral resolution below 1 nm (Steiner et al. 2008). The leaf temperature shows a close correlation with the plant transpiration (Jones et al. 2002), which is affected in different ways by a diversity of pathogens. The combination of fluorescence imaging with image analysis techniques has been shown to be useful for discrimination and quantification of fungal infections (Konanz et al. 2014).
These GEBVs are then used to select individuals for advancement in the breeding cycle (Heffner et al., 2009). The current crop improvement trend does not match the food and biofuel needs of the projected world population in 2050 (the 2050 challenge) (Ray et al. 2012).
HQRPLFVLQSUHEUHHGLQJ
- Marker assisted selection for biotic stresses in Wheat
- Marker assisted selection for abiotic stresses
- Marker assisted selection for other traits (i) MAS for Reduced plant height
- Identification and mapping of rust resistance genes
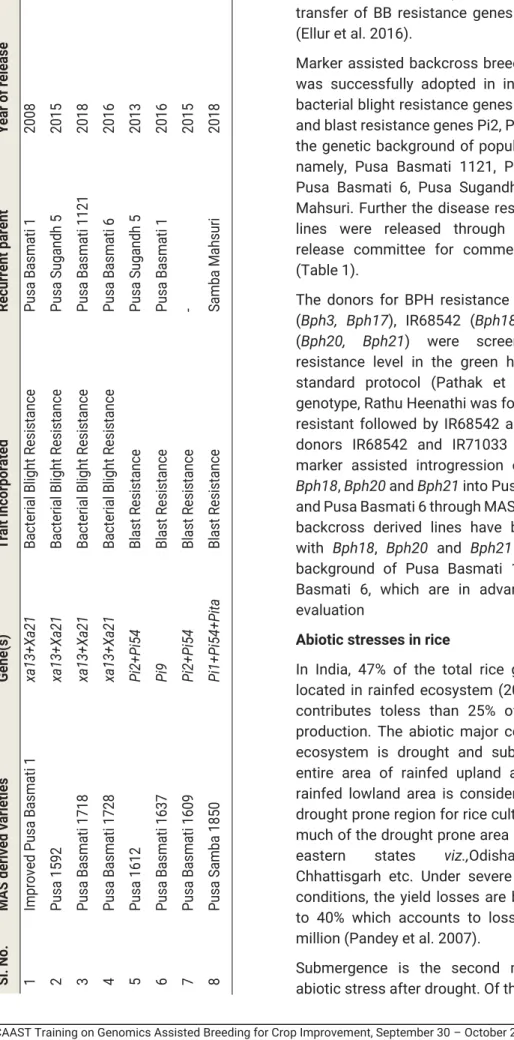
Genomic-assisted breeding approaches are contributing to the more efficient development of climate-resistant crops (Varshney et al., 2018). Marker-assisted selection (MAS) is essentially based on the premise that it is possible to infer the presence of a desirable gene allele from the presence of a marker allele which is closely linked to the gene (Beckman and Soller, 1983). Improved Pusa Basmati 1” carrying resistance genes xa13 and Xa21 in the genetic background of elite Basmati rice variety “Pusa Basmati 1” was produced at IARI, New Delhi (Gopalakrishnan et al. 2008).
The first drought-resistant aerobic rice variety produced in MAS released in India was MAS946-1 (Gandhi et al. 2012). A leaf rust resistance gene “LrTrk” in the durum wheat line Trinakria was mapped to chromosome 5BS (Gireesh et al. 2014).
HQKDQFHPHQWLQPDL]H
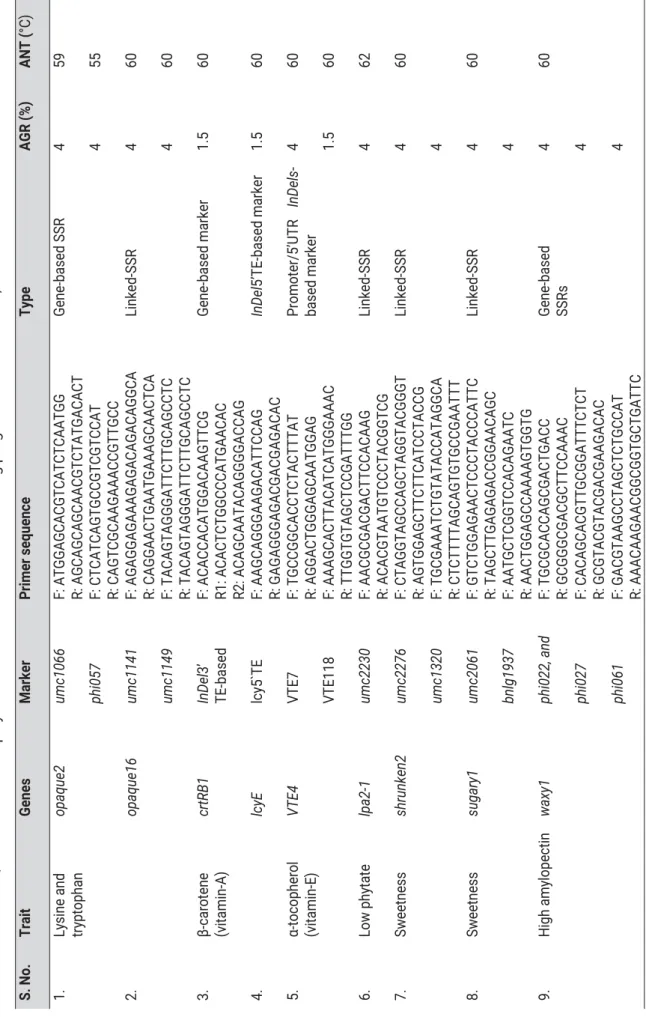
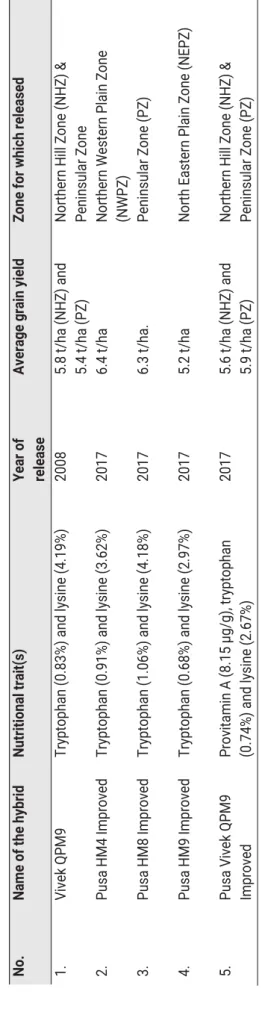
Balanced and nutritious diet for humans therefore assumes great significance to mitigate malnutrition (Gupta et al. 2015). The newly developed o16o16-based progeny developed here will serve as a valuable genetic resource in the QPM breeding program in India (Sarika et al. 2017). However, the frequency of the favorable allele of crtRB1 and lcyE is extremely low (<4.0%) in the available maize germplasm (Muthusamy et al. 2015c).
Symptoms of vitamin E deficiency (VED) include progressive damage to the nervous and cardiovascular systems (Traber et al. 2008). In India, an effort to increase the level of vitamin E in maize was initiated at IARI, New Delhi (Das et al. 2018).
IRULPSURYLQJSURGXFWLYLW\DQGVWUHVVUHVLOLHQFH
A molecular marker-based linkage map of chickpea was developed from the desi × kabuli cross BGD 112 and FLIP 90-166 using STMS markers (Bharadwaj et al., 2011b). Of the genomic regions mentioned above, the CaLG05 and CaLG07 genomic regions were the most important as they contained QTLs for traits that were highly correlated with yield under salt stress conditions (Raju Puspavalli et al., 2015). A total of 29 introgression lines with ~93% repeat parental genome were developed after three cycles of backcrossing followed by two generations of selfing ( Varshney et al., 2013 ).
Late embryogenesis abundant (LEA) genes represent a gene family that plays an important role in vegetative tissue in response to drought, salinity, cold stress, and exogenous application of abscisic acid (Dure et al., 1989). These were used successfully to select cold-tolerant progeny from a cross between Amethyst and ICCV 88516, but were ineffective in other crosses (Millan et al., 2006).
0ROHFXODUPDUNHUVLQ%UDVVLFDLPSURYHPHQW
Functional genomics
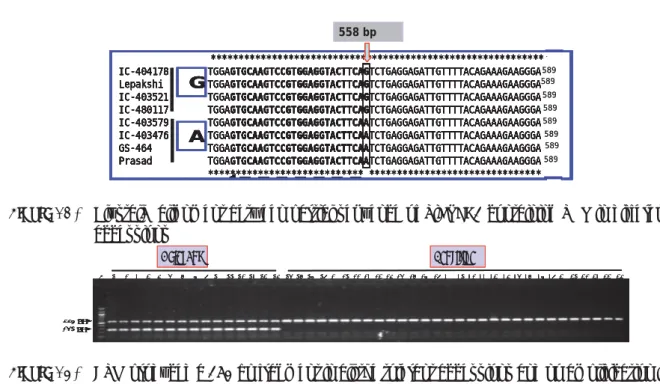
Therefore, to examine the genetic diversity of tolerance to drought-induced oxidative stress, we screened a group of 107 foxtail millet cultivars for their tolerance to dehydration based on lipid peroxidation (LP) (Lata et al. 2011a). Based on this SNP, an Allele Specific Marker (ASM) for dehydration tolerance was developed and this ASM would serve as a rapid, cheap and more reproducible tool for genotyping, and also encourages the breeding of foxtail millet with the help of markers for dehydration tolerance (Lata et. al. 2011b; Figure 4B). Further, ASM was validated in a core set of 170 foxtail millet accessions, and regression of lipid peroxidation (LP) and relative water content (RWC) in ASM suggested that the SiDREB2-associated trait contributed ∼27% and ∼20% , respectively of the total variation in LP and KRU (Lata and Prasad 2012, 2013b).
We then compared the transcriptome of salt-tolerant and sensitive cultivars of foxtail millet by constructing the SSH library and identified that SiNAC (Setaria italica NAM, ATAF and CUC) is strongly upregulated during salt stress in the tolerant cultivar (Puranik et al. 2011a). Similarly, we also identified the differential expression of WD40 proteins in the SSH library for salinity and dehydration stress in foxtail millet (Mishra et al. 2012a).
Conclusions and future perspectives
Markers must also be validated by testing for the presence of the marker on a range of cultivars and other important genotypes (Sharp et al., 2001). In some cases, phenotypic screening is less expensive compared to marker-assisted selection (Dreher et al., 2003). One of the known epigenetic mechanisms was methylation of cytosine leading to the formation of 5-methylcytosine (5-mC) (Kumar et al. 2018).
Small RNAs also play a key role in recruiting enzymes involved in epigenetic changes (Wang et al. 2016). A decrease in methylation in the tomato pericarp during ripening suggests a role for DNA demethylation in fruit ripening (Lang et al. 2017).
0DL]HWRRONLWIRUJHQHWLFVWXGLHV
In addition, genetic studies with maize have led to groundbreaking discoveries such as heterosis and transposable elements (jumping genes). There have been attempts in the past to use corn as a model for teaching certain concepts of genetics. Maize Genetics Unit, Department of Genetics, ICAR - Indian Agricultural Research Institute (IARI), New Delhi has been instrumental in developing various maize genetic stocks that can easily explain various key concepts of genetics to students.
1$LVRODWLRQIURPPDL]HWLVVXHV
Isolation of genomic DNA from maize leaf tissue
Isolation of genomic DNA from maize seed
Conventional backcross breeding requires 6-7 generations to introduce the desired gene with maximum recovery of the replicated parental genome. In other words, markers are used to select against the donor genome, which can accelerate the recovery of the replicated parental genome. The National Gene Bank (NGB), the most advanced facility was created for the ex situ storage of germplasm collections in.
The Food and Agriculture Organization of the United Nations (FAO) became the implementing agency for this project. On the south side of the building, nine greenhouses have been upgraded to BL4 biosafety level.