Projection of an urban settlement in the hills of Guwahati city was carried out using this model, which derives the parameters of the input model in relation to the master plan of the city. The projected Landuse Land Cover (LULC) map of the Guwahati hill city was used in the hydrological impact analysis of the watershed of the projected urban population growth.
List of Tables
109 Table 6.4: Calculated and observed values of soil loss from the studied watershed 110 Table 6.5: Hill cutting factor Hf and cover management factor Chu for urban settlement v. 167 Table B.3: Maximum runoff values from Kalapahar Hill catchments 170 Table B.4: Maximum runoff values from Sonaighuli Hill catchments 173 Table B.5: Maximum runoff values from Sarania Hill catchments 176 Table B.6: Maximum runoff values from catchments Kharguli Hill 177 Table B.7: Peak Runoff Values from Japorigog Hill Catchments 180 Table B.8: Peak Runoff Values from Burhagosain Hill Catchments 183 Table B.9: Peak Runoff Values from Khanapara and Koinadhara Hill Catchments 184 Table B.10: Highest runoff values from Garbhanga hill catchments 185 Table B.11: Peak runoff values from Kamakhya hill catchments 185 Table B.12: Peak runoff values from Kahilipara hill catchments 188 Table B.13: Peak runoff values from Betkuchi hill catchments 190 Table B.14 Peak Runoff Values from Hill Catchments Chunsali Hill 191 .
List of Notation
General
This indicates inferior economic growth compared to urban population growth in developing countries (United Nations 2013b). Rural-urban migration is the main reason for this high urban population growth in developing countries (United Nations 2001).
Motivation for the study
As a consequence of the sedimentation, the drainage capacity of the flow channels decreases, resulting in the increased frequency of the risk of urban flash floods. These management practices will be more effective if they are implemented taking into account future urban settlement in eco-sensitive areas.
Broad objectives of the study
Evidence of degradation of ecologically sensitive areas due to human disturbance is found worldwide, including the most developed areas such as Europe and the USA (European Environment Agency 2002; McDonald et al. 2010). If this continues, ecosystem imbalance is assured in the near future and highlights the need for a proper management plan to address future situations that may arise from increased urban settlement in ecologically sensitive areas.
Organization of the thesis
Introduction
Determination and projection of urban settlement/impervious area
In the first method, fractional impervious surfaces for the six watersheds of the study area were determined by calibrating fractional impervious surface maps. To test the usability of the process, four sets of hyperspectral data were applied to estimate the impermeable area.
Effects of urbanization on land use land cover change
For this purpose, they used remote sensing, GIS, metric analysis of the spatial landscape, and regression analysis of spatial error and lag. The relationship between urbanization and agricultural landscape pattern was found to be highly variable. The Expansion Intensity Index (EII), which measures the dynamics of expansion of built-up areas in an ecoregion, is the most influential indicator of urbanization that describes changes in the agricultural landscape pattern at the ecoregion level.
Impact assessment of urban settlement on hydrology
The SWAT model has been used to assess the impact of land use changes on water resources. Then, the SWAT model was used to simulate surface runoff and water yield changes in response to the effects of land use changes.
Sediment yield models and their application on impact analysis of land use land cover change on soil erosion
It was further modified by Morgan and Duzant (2008) to consider the effect of plant and vegetation properties on soil loss. According to Morgan (2009), plant cover protects the soil surface from the direct impact of raindrops causing the reduction of soil loss.
Management practices/techniques for controlling sediment and runoff
A sensitivity analysis of the model showed that the width of the grass strip and the flow have a strong influence on the sediment removal efficiency. Sensitivity analyzes of the model parameters showed that the total cost of the EMP responds strongly to the rainfall intensity in the basin.
Role of remote Sensing and Geographical Information System in hydrological study
Below are some previous works dealing with the use of RS and GIS techniques in hydrological analysis:. Ramlal and Baban (2008) presented some flood and watershed management strategies in the Caparo River Basin in Western India based on assessment of basin soil erosion and river morphological features in a GIS environment.
Critical appraisal of literature review
Although assessment of these impacts can be carried out by direct measurements of the rainfall and discharge at streams and the groundwater levels at wells (Burns et al. 2005), this method is quite time consuming and labor intensive. Researchers from different parts of the world have widely used GIS techniques to measure the amount of soil loss from a watershed (Fistikoglu and Harmancioglu 2002, Dabral et al. 2008, Panday et al. 2007, Biswas and Pani 2015).
Scope of the work
Generating future land use land cover maps (LULC) of the eco-sensitive areas by spatially mapping the planned urban settlement in the GIS platform. In principle, two hydrological components were chosen for the impact analysis: (a) peak discharge (b) soil loss.
Introduction
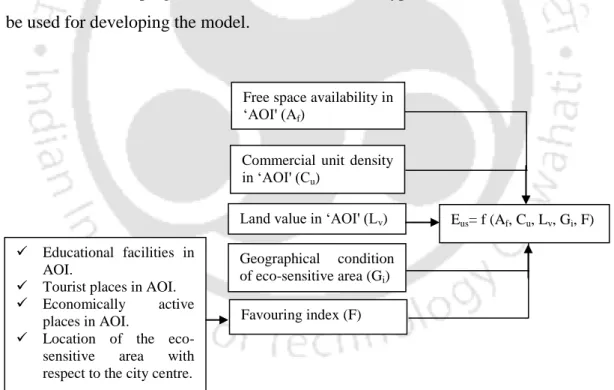
Model Development
From this view, the low availability of free space in AOI is considered an indicator of increasing urban settlements in the corresponding eco-sensitive area. 3.3) Here Eus is the amount of urban settlements in the eco-sensitive area (in % of area).
Case study
- Description of the study area
- Data collection and generation required for model development of the study area
- Model development for the study area
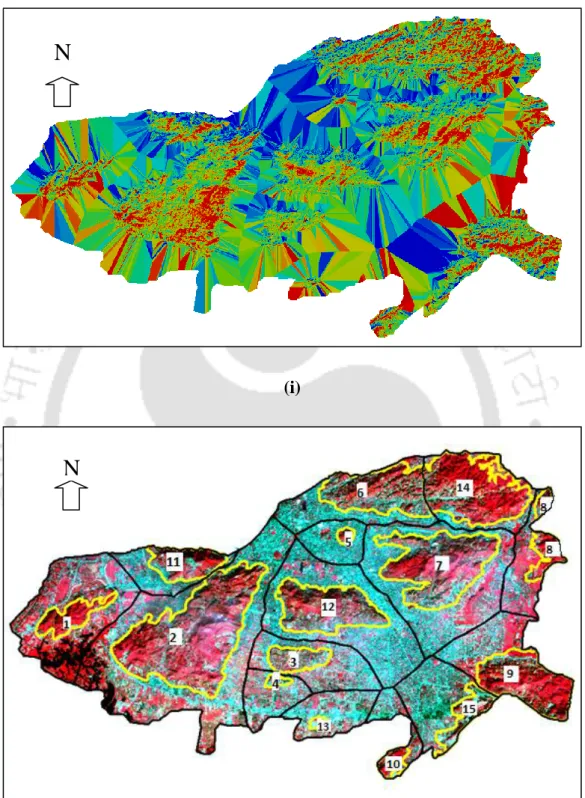
Thus, it indicates that the hills of Guwahati city are ideal to test the practical applicability of the proposed model. Values of the potential influencing factors of urban settlement in the hills of Guwahati city are shown in Table 3.6.
Results and discussion
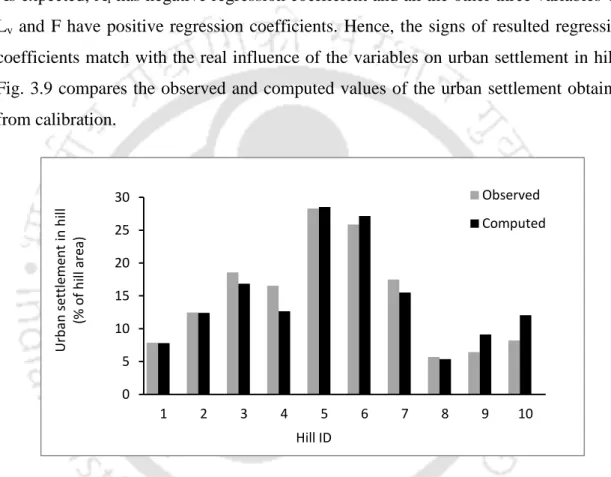
In addition, the same figure also shows the average change in urban settlement in the hills of Guwahati city due to the change in the values of these individual variables. It is found that on average, urban settlement in hills of Guwahati city is most sensitive to land value followed by available vacant space and density of commercial units in hills AOI.
Guwahati city
- Introduction
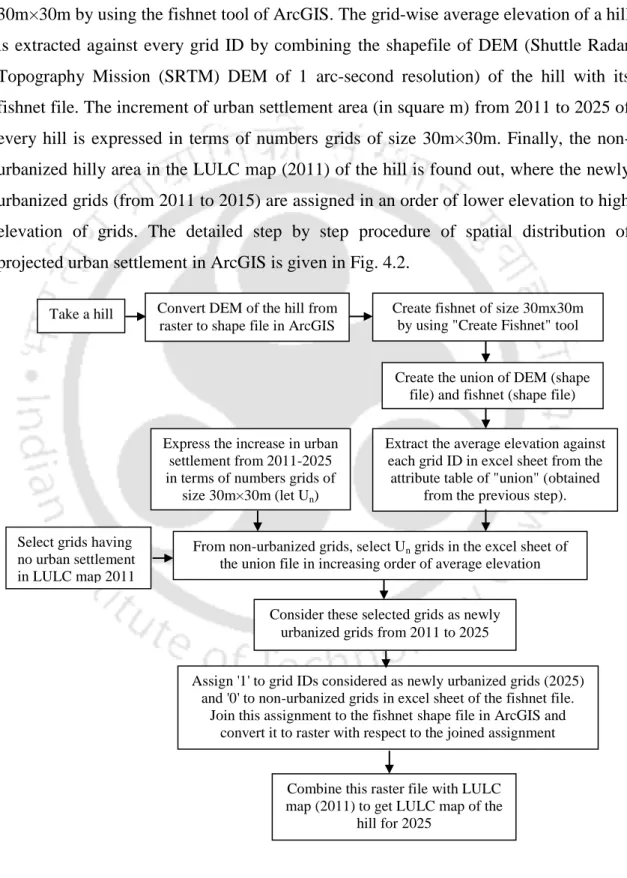
- Generation of future data
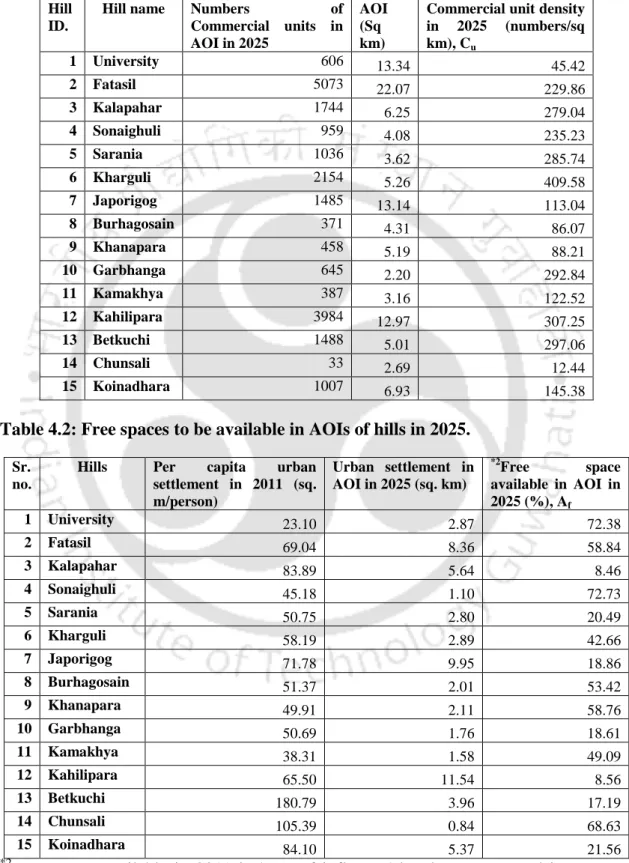
- Determination of future commercial unit density (C u ) in AOIs
- Determination of free space (A f ) to be available in 2025 in AOI of hill
- Projection of favouring index (F) to 2025
- Projection of average land values (L v ) to 2025 in AOIs of hills
- Results of urban settlement projection
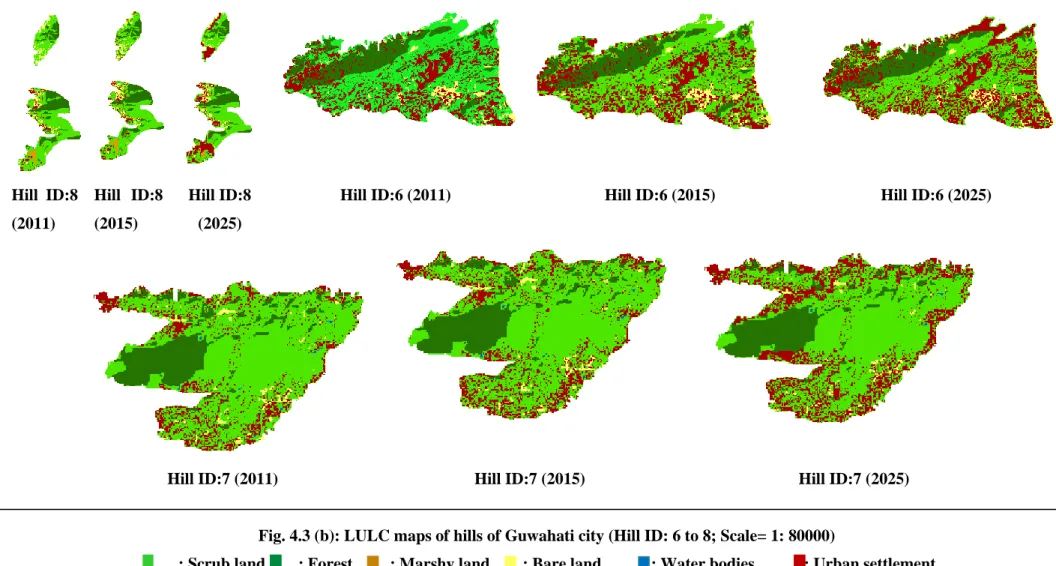
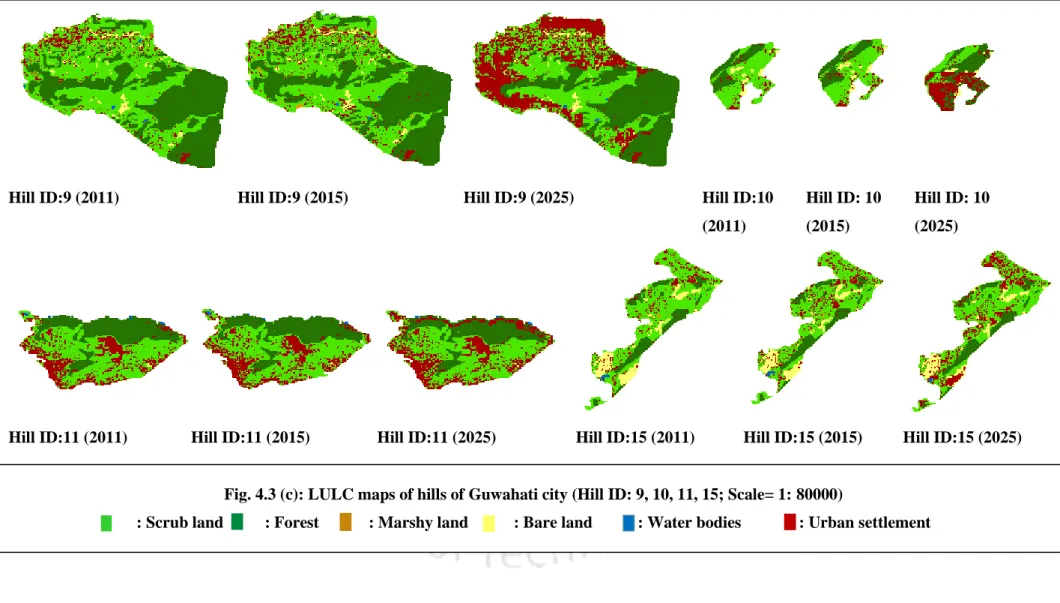
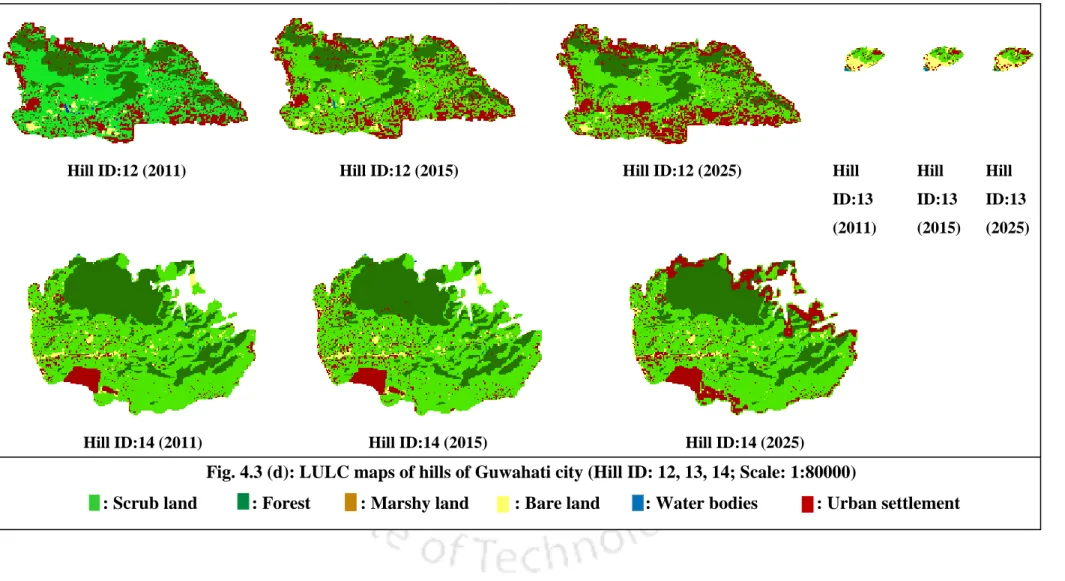
- Preparation of future LULC map for hills of Guwahati city
- Conclusions
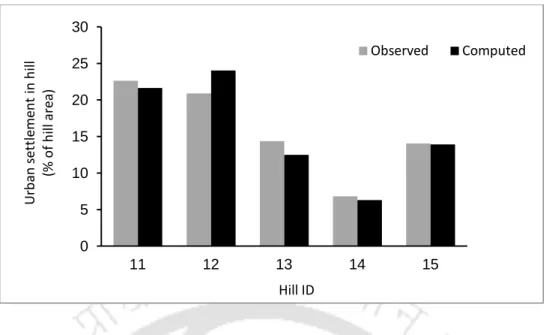
The values of the four input variables and the resulting urban settlements (in % of hill area) in 15 hills of Guwahati city are shown in Table 4.6. According to the model projections, the rate of change in urban settlement by 2025 will be highest in hills such as Garbhanga and Khanapara, located in the southern part of the city.
Introduction
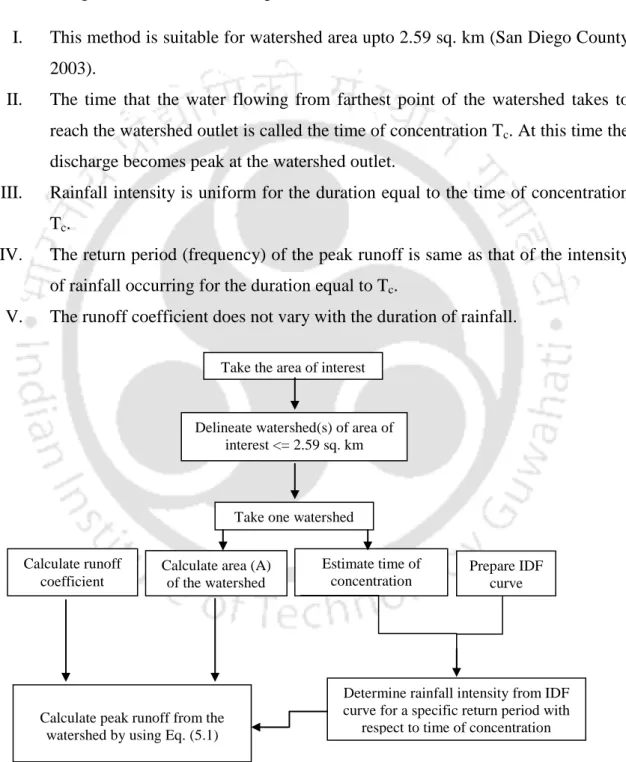
Determination of peak runoff from hills of Guwahati city
- Delineation of watersheds of hills of Guwahati city
- Determination of time of concentration for the watersheds of hills of Guwahati city
- Intensity duration frequency (IDF) curve for Guwahati city
- Determination of runoff coefficient
- Calculation of peak discharge for watersheds having area greater than 2.59 sq. km
The parameter values of the comparisons of IDF curves for different return periods are shown in Table 5.2. The parameters of the comparisons of safe IDF curves for different return periods are shown in Table 5.3.
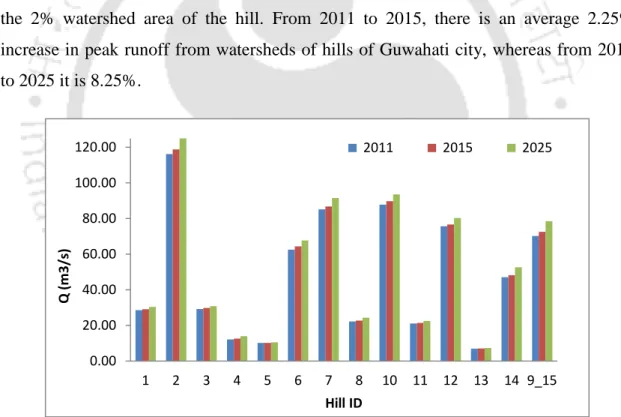
Results of peak runoff generation
Despite the highest growth of urban settlements in Garbhanga Hill (Hill ID 10) from 2011 to 2025 (from Table 4.6), the catchment of the same does not have a very high increase in peak flow compared to the catchments of other watersheds. As a result, the increase in peak runoff value from this Garbhanga hill catchment is only relative to the increase in urban settlements in the 2% hill catchment area.
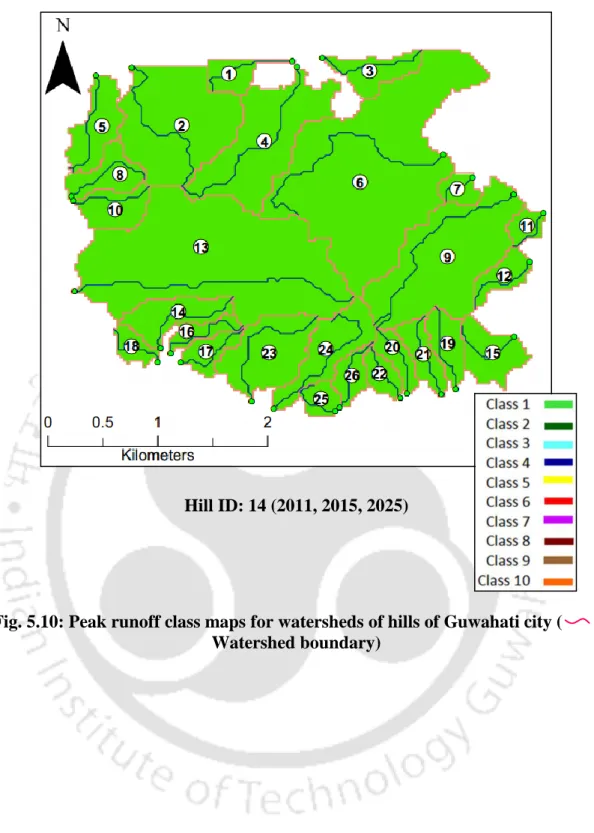
Generation of peak runoff maps
Conclusions
It will also help to identify the hill watersheds that need watershed management plan to minimize peak runoff.
Introduction
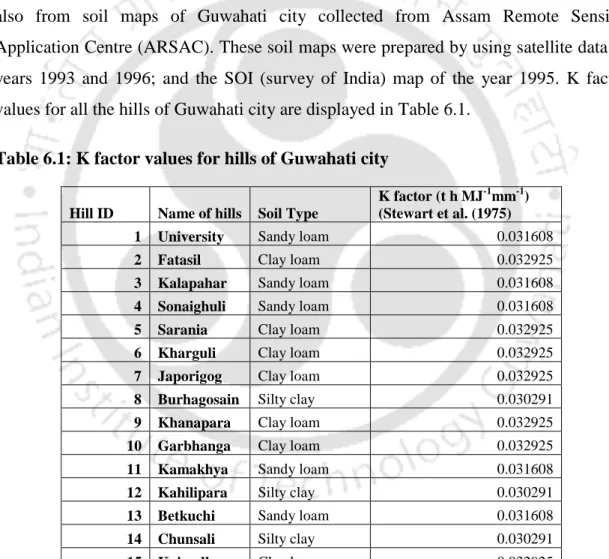
Estimation of RUSLE parameters
This factor was introduced to account for the effect of topography on soil loss (Renard et al. 1997). On the other hand, the support practice factor (P) is the ratio between the soil loss of a parcel of land with a specific soil conservation practice and that of linear cultivation with ascending and descending slopes (Pandey et al. 2007).
Derivation of hill cut factor (H f )
- General expression
- Determination and application of H f factor to the hills of Guwahati city The sample field survey data as mentioned in Section 6.3.2 has been used to represent
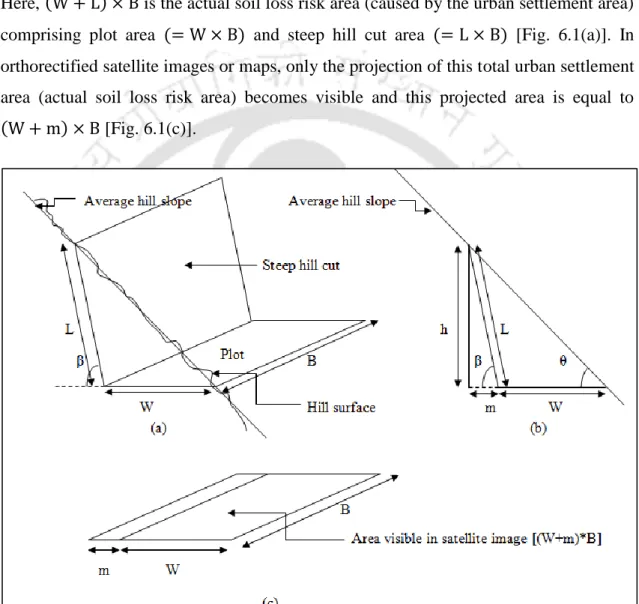
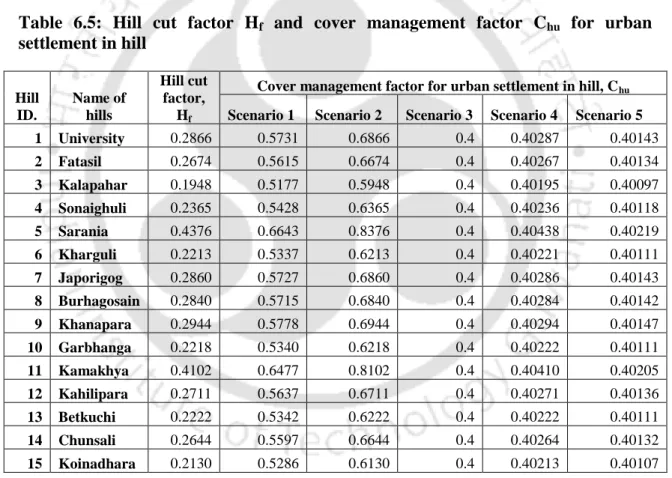
6.1(a) shows the schematic diagram of the steep hill cut caused by urban settlements on a hill. The values of hill cut factor Hf and cover management factor Chu for urban settlements in the hills of Guwahati city are shown in Table 6.5.
Results and Discussions
On the other hand, in 2025, Betkuchi Hill (Hill ID 13) has the lowest increase in soil loss rate. For all three of these scenarios, an overall decrease in the rate of land loss is found in 2025.
Preparation of soil loss vulnerability map
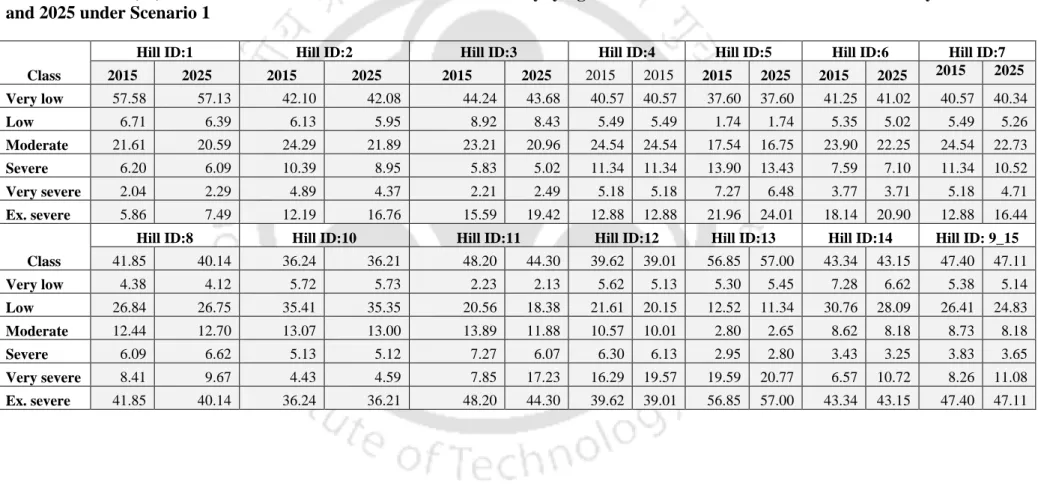
It is observed that the soil loss value is more sensitive to the variation of R-factor than that of the K-factor. Again, the spatial distribution of different soil loss classes in the watersheds of the hills of Guwahati city for the years 2015 and 2025 under scenario 1 is shown in Fig.
Conclusions
This shows that soil erosion in the hills of Guwahati city is very sensitive to the growth of urban settlements. It only considers soil loss due to stream and interflow erosion that can result in steep hill cuts.
Introduction
RUSLE was applied to calculate the soil loss of an urban hilly catchment and the steep hill areas, which are not visible in orthorectified satellite images, were originally not included in the model. Again, as discussed in section 6.4, the amount of soil loss from the hilly catchments of Guwahati city is highly dependent on the surface cover condition of the steep slopes.
The revised OPTEMP-LS model
- General mathematical formulation
Coverage management factor for the jth type of EMPs applied in the residential area of the hilly part of the watershed. Area of barren, steep slopes associated with urban settlements in the hilly area of the watershed (m2).
Maximum area available for EMPs: No EMP can be applied in the allowable coverage (building) area according to the applicable building bye laws. Therefore total
Runoff coefficient for the type of EMPs used in the general area of the watershed. Runoff coefficient for j. type of EMPs used in the settlement area in the hilly part of the watershed.
Owner’s choice for EMPs: As EMPs will have to be implemented and maintained within the residential area; the planned EMP area must be within the maximum and
- Application of the Model .1 EMP consideration
The unit costs of OBPs, and their coverage management factors and the run-off coefficients are displayed in Table 7.1. Unit costs of EMPs- grass, garden, forest and detention pond are from Sarma et al.
Sediment yield and peak runoff constraint: In the optimization model, the upper limit of the sediment yield is taken as the sediment yield from the watershed under
Although the unit costs here have been taken from the past literature for the purpose of theoretical use, it is essential to use the latest available costs for the actual application of the model. Runoff coefficients and cover management factors for land covers other than EMP to be included in Eq.
Maximum area available for EMP: As mentioned earlier, according to GMDA building bye laws (2006), the maximum coverage area of building in a plot of land can
The safe carrying capacity of the downstream drainage section (considering the most economical section criteria) is obtained as 4 m3/s designed using Manning's equation with the available channel bed slope of 0.21%, bed width of 1.5 m and Manning's roughness coefficient of 0.025. The values of various parameters related to the constraints of the optimization model are shown in Table 7.2.
EMP area suitability constraint: The suitability conditions for the considered EMPs (suitable soil type, slope range and elevation) are taken from Sarma (2011) and
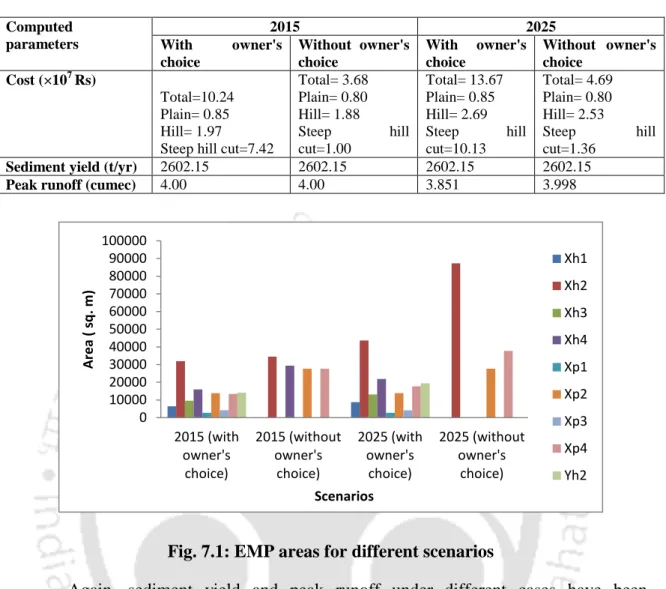
- Results and discussions
- Conclusions
- General
- Summary
- Conclusions
- Future scope of research
The watershed of the Guwahati hill city was mapped using the ArcSWAT interface of the SWAT model. "Hill Cut Factor (Hf)" takes into account soil loss due to steep hill cuts.
Appendix A
Appendix B
Sample calculations of peak runoff
- Peak runoff calculation by Rational Method
- Peak runoff calculation by NRCS TR-55 graphical peak discharge method Sample watershed= Watershed ID: 53 of Fatasil hill (Hill ID: 2)