Environmental effects of urban geometry changes on air temperature and outdoor thermal comfort in arid
climate of Mashhad 1
Elham Sanagar Darbani, Mojtaba Rafiyan, Toktam Hanaee, Danial Monsefi Parapari
Evaluation of factors affecting mean radiant temperature in a public apace (Case study: Shanbedi passage way in
Bushehr) 5
Zohre Majidi, Mohsen Taban
Resolving conflict on the trade-off curve generated by a multi-purpose sustainability model for the natural
environment and farming under water bankruptcy 7
Ali Reza Nafarzadegan, Hassan Vagharfard, Mohammad Reza Nikoo, Ahmad Nohegar
Formulation of ecological design and regulating strategies for urban rivers with reference to run-off water
control (Case Study: Ziyarat River, Gorgan city) 10
Niusha Habibi Ardebili, Mohammad Reza Masnavi, Bahram Malek Mohammadi
Erosion and accretion monitoring in mangrove forests using remote sensing and Digital Shoreline Analysis System
(DSAS) 12
Davood Mafi Gholami, Masoumeh Baharlouii, Beytollah Mahmoudi
Investigating the effects of climate change under different scenarios on groundwater in Kerman Plain 15 Farshad Soleimani Sardoo, Tayybe Mesbahzadeh, Naser Broomand, Ali Azareh, Elham Rafiei Sardooi
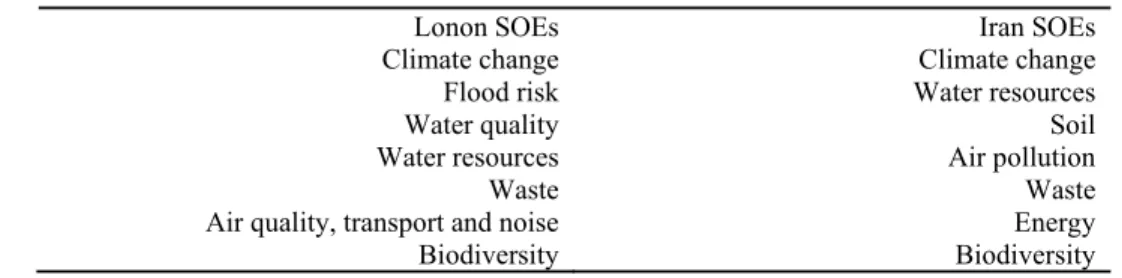
A comparative analysis of environmental state in Tehran and London cities using sustainability indicators 17 Fatemeh Adeli Sardoo, Esmaeel Salehi, Reza Salehi
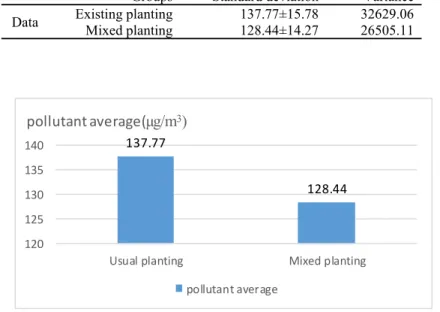
The effect of gasoline exhaust pollution on some anatomical, physiological and morphological characteristics of
Spinach 19
Amin Kohan, Maryam Haghighi, Mohammad Hossein Ehtemam, Nourollah Mirghaffari
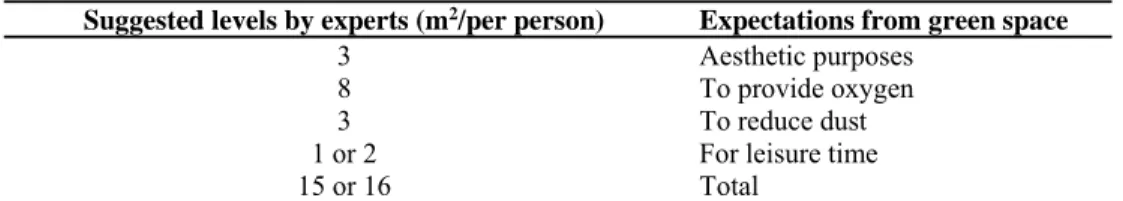
Southwest Zahedan green belt design with dust reduction approach 22
Peiman Golchin, Mansoreh Naroei, Abolfazl Kazemi Nasab
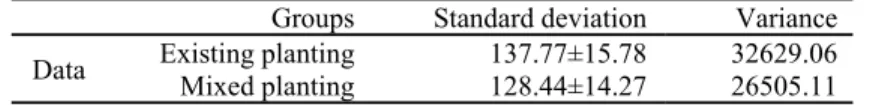
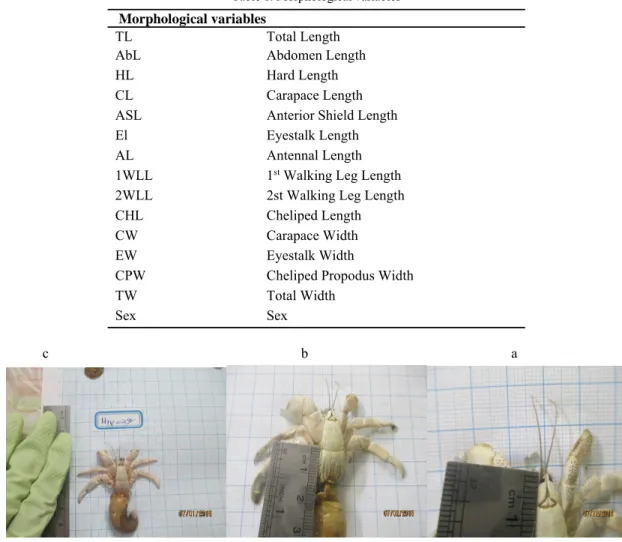
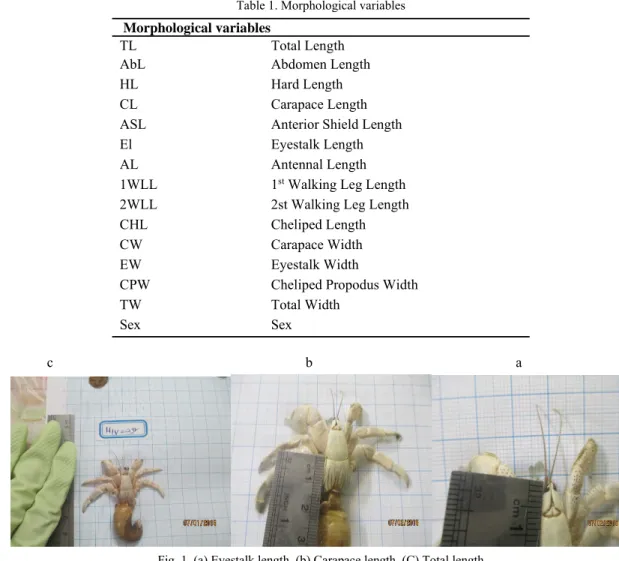
Evaluation of lead and cadmium pollutions in morphometric characteristics of Hermit crab (Coenobita scaevola) 25 Mahdieh Makareh, Atefeh Chamani, Minoo Moshtaghie
Self-purification of interval mountainous Abbas Abad River of Hamedan 28
Ali Vanaei, Safar Marofi, Arash Azari
Identification distribution pattern and origin of petroleum hydrocarbons in core sediment of southwest coast of
the Caspian Sea (Kiashahr) 31
Golshan Shirneshan, Alireza Riyahi Bakhtiari, Mahmoud Memariani
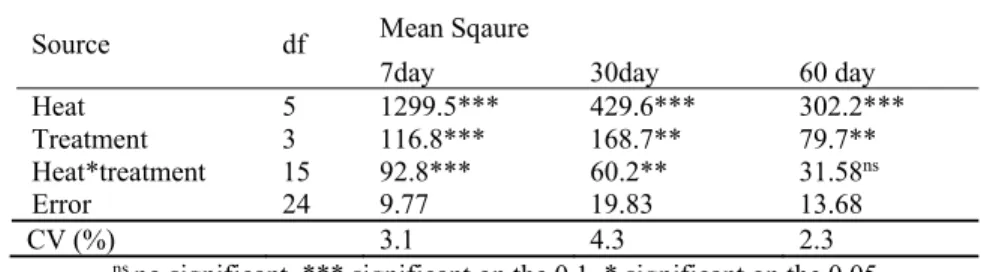
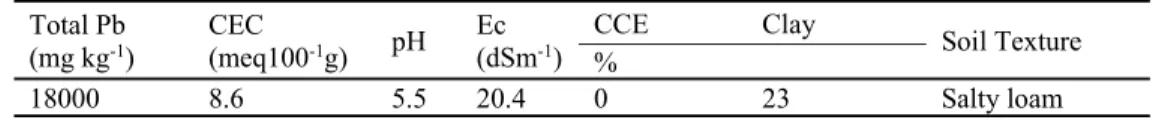
Pb (II) immobility in contaminated soils using phosphate, heat and lime (CaCO3) 33 Safye Hasanzad, Behnam Dovlati, Hosein Pirkharrati
Environmental effects of urban geometry changes on air temperature and outdoor thermal comfort in arid climate of Mashhad
(Case study: Pachenar and Shahed)
Elham Sanagar Darbani¹, Mojtaba Rafiyan²,Toktam Hanaee³, Danial Monsefi Parapari4 1. Department of Urbanism, Mashhad Branch, Islamic Azad University, Mashhad, Iran
(Email: Elham_Sanagar@yahoo.com)
2. Associate Professor, Architecture School, Tarbiat Modares University, Tehran, Iran 3. Assistant Professor, Department of Urbanism, Mashhad Branch, Islamic Azad University,
Mashhad, Iran (Email: Toktamhanaee@yahoo.com)
4. Assistant Professor, Department of Architecture and Urbanism , Shahrood University Technology, Shahrood, Iran (Email: Parapari@shahroodut.ac.ir)
Received: September 10, 2017 Accepted: February 4, 2018
Expanded Abstract Introduction
Decreasing environmental problems by reducing ambient air temperature can enhancing human health as one of the most important concerns of today's professionals, which can be expressed by outdoor thermal comfort as one of the most important environmental indicators of urban open spaces. We often think of people living their life inside buildings and we may not see that in fact for one reason or another we spend much of our time outside–
between the buildings. The spaces and places of these, and many other everyday activities, have a special social, cultural and even economic significance. In recent years natural disasters, such as the heat wave lead to mortality rate increased due to high air temperature, and research focus on providing thermal comfort as one of the most important issues for enhancing health and satisfaction of people from being in urban areas. Designers and planners ensure that people should live in comfortable places by means of environmental factors. Therefore, man-made and natural spaces in cities can provide comfortable environments. Moreover, urban geometry such as urban canyons and green spaces at pedestrian level is effective factors and there is limited attention in Iran.
Evaluating thermal comfort of the locals may help architects and planners to deal with urban problems by identifying thermal comfort needs in indoor and outdoor environments, so that the intensity of temperatures is reduced in open spaces by using design elements. In Iran, thermal comfort issues in academic studies are more focused on indoor spaces, and in recent years, approaches to outdoor thermal comfort have increased. This study focuses on effects of urban geometry on outdoor thermal comfort in two urban areas PACHENAR and SHAHED tissue in Mashhad. The first part of the article examines researches carried out in the subject area of the paper, and then, in the next section, theoretical foundations of the articles, thesis and books have been extracted. Air temperature, wind speed, mean radiant temperature (MRT), and the physiologically equivalent temperature (PET) are simulated with ENVI-met and Rayman to highlight the strengths and weaknesses of the existing urban geometry in summer season.
Matherials & Methods
The methodology is practical research based in two parts. First, the framework theory is extracted from researches such as papers, books and dissertation. The climatology data collected from weather station of Torogh which is located near Mashhad. After that Gis maps are used for neighborhood. In order to reach the PET values, the proposed method is applied to an urban canyon, which is simulated in terms of mean radiant temperature and PET, combining ENVI-met (http://www.ENVI-met.com) and Rayman. First, a simulation of the case study model is conducted in ENVI-met. Second, some of the key results and values from ENVI-met are imported into Rayman and other simulation runs.
ـــــــــــــــــــــــــــــــــــــــــــــــــــــــــــــــــــــــــــــــــــــــــــــــــــــــــــــــــــــــــــــ ـــــــــــــــــــ
Corresponding Author: E-mail: Mrafiyan@gmail.com
Environmental effects of urban … Elham Sanagar Darbani, et al.
2
ENVI-met simulations
The three-dimensional micro climate model ENVI-met is designed to simulate the surface-plant-air interactions in urban environment. ENVI-met software is a useful tool for planners to analyze and predict the thermal comfort impacts of various factors. ENVI‐met is a 3D model, which seeks to replicate the major atmospheric processes that affect the micro climate. This model simulates wind flows, radiation fluxes, temperature, humidity and other parameters, based on the fundamental laws of fluid dynamics and thermodynamics which is able to simulate the interactions between different urban surfaces, vegetation and the atmosphere. ENVI-met allows analyzing the effects of small scale changes in urban design on micro climate under different mesoscale conditions. A major shortcoming with ENVI-met is that buildings which are modeled as blocks whose width and length are multiples of grid cells and have no thermal mass. Input data required to initiate ENVI-met simulations are: Wind speed and direction at 10 m above ground level; Roughness length (Zo); Initial temperature of atmosphere; Initial temperature and humidity of the soil; Specific humidity at 2500 m; Relative humidity at 2 m.
The model calculation includes: Short-wave and long-wave radiation fluxes with respect to shading, reflection and re-radiation from building systems and the vegetation; Transpiration, evaporation and sensible heat flux from the vegetation into the air, including full simulation of all plant physical parameters. In this study, simulation was carried out in the summer (August) and based on the data of the meteorological station of Mashhad. This simulation was selected on August 28, 2017, during the sunrise and sunset times between 6 AM and 20 AM, which represents the hottest day in summer.
Rayman simulations and Assessing PET
The Rayman is produced byMatzarakis. This model has been developed in the Meteorological Institute of the University of Freiburg in Germany in 1998. This model is developed to simulate the short and long wave radiation flux densities from the three dimensional surroundings in simple and complex environments. RayMan is in fact a freely available radiation and human bioclimate model. The aim of the RayMan model is to calculate radiation flux densities, sunshine duration, and shadow spaces. The thermo-physiologically relevant assessment indices using only a limited number of meteorological and other input data. For such models to be applied in simple situations, the following atmospheric parameters are required: direct solar radiation, diffuse solar radiation, reflected short-wave radiation, atmospheric radiation (long-wave), longwave radiation from the solid surfaces. The following parameters describing the surroundings of the human body also have to be known tosky view factor, view factor of the different solid surfaces, albedo of the different solid surfaces, emissivity of the different solid surfaces.
Assessment of microclimate and thermal comfort outdoors
Due to the wide use of the PET index in different climate studies and the ease of expression of oudoor thermal comfort of individuals, in this paper, the PET index is calculated.Since these numbers are not localized in Iran, and in particular to Mashhad. The range of 23 is based on the Matzarakis and Mayer studies as a thermal comfort range. On the other hand, trees play an important role in this study.The simulation carried out in Envi-met has also been based on field observations of the density of these trees, which is called the LAI index (LAI). Dense trees with 10 m height (LAI= 4.73) and very dense trees with 15 m height (LAI= 9.35) were designed for simulating the vegetation. In addition, grass with 0.1m height (LAI= 0.03) was also used.
Model calibration
In order to make the results of these models based on simulations more credible, the model had to be calibrated.
The input values have to be changed slightly, so that the output values turn out to be a more accurate representation of reality. In order to do that the model was calibrated with on-site long-term measurements of air temperature (Ta), relative humidity (RH), wind speed (Ws) and direction (Wd) at two tissues as well as properties of ground surface materials. The general input data as a result of the calibration are shown in Table 1.
Discussion of Results & Conclusions
Simulation MRTs and wind on outdoor thermal comfort
PACHENAR has a compact urban geometry with an average height of 6 m. On the other hand, SHAHED with urban geometry of East-West and North-South street with widths of 4 to 20 m, and according to the regulation with occupancy level of 60%. Annual radiant temperature in summer is shown in the two case studies in summer and from 6:30 to 20:00 (Fig. 3). This chart shows that PACHENAR with a H/W ratio has a lower rate of MRTs at summer hours (11-14), while in SHAHED with a lower H/W ratio this rate has increased in these hours.
SHAHED showed an average distribution of MRTs between 40°C and 8.9°C and PACHENAR between -44°C and +8.8°C. In fact, ΔMRTs in the SHAHED were 31.1°C and in the PACHENAR is 35.3°C which indicates that the levels of radiation in this case.
Wind flow is one of the climatic parameters affecting outdoor thermal imbalance. Despite the difference between the height of buildings and the distance between buildings and pedestrian directions in the PACHENAR, the average wind speed does not change significantly in this area. This is especially true for high-H/W high passages with a very high enclosure, with no higher impact at 0.57 m/s, but in the new texture, due to the lower H/W rate, the effects of the wind have been somewhat affected by the impact, and as shown in Figure 4, less enclosure.
Wind flow rate up to 2 m, there is also the effect of wind on the second new tissue and in the streets of closeness is less significant.
Calculated thermal comfort
The PET value was calculated for 14:00 hours. PET values compare between 2 tissues (Fig. 4). The simulation shows that PACHENAR is between 8:00 and 13:30 hours (the PET value is from 27 to 48°C) and has thermal stress. This value reach peak at 12:00 (48°C) and nearing sunset, heat stress reduced. SHAHED has less heat stress than PACHENAR, with value ranging from 9.30 to 13 (PET values from 25°C to 29°C). In general, considering the difference in mean of ΔPET values between 8.30 and 14:00 in PACHENAR tissue is 9.9 and in SHAHED value is equal to 0.05, which indicates high heat stress in this time. Comparison of thermal comfort was done separately and also according to the ratio of H/W.
The impact of urban geometry of PACHENAR with North-South orientation
Data anylsis of North-South street receptors shows that average H/W rate is 1.5 (Fig. 5). The results of the simulation indicate that the heat stress level (maximum PET values at 10.30 at 42.6°C) in the North-South orientation in PACHENAR compared to the other receptor with a higher H/W= 2. Thus, increasing the ratio of height to width and shading, enhance outdoor thermal comfort.
The impact of urban geometry of SHAHED with North-South orientation
Data anylsis of North-South street receptors shows that H/W ratio is same, the western part of street due to the orientation of the sun light (western side) with PET index 37.5°C has a lower thermal comfort compared to the other direction (eastern side) with a maximum PET index of 42.3°C, in which the thermal stress is near to the PACHENAR, and therefore the thermal comfort in the western side of the sunshine is less than other side.
The impact of urban geometry of PACHENAR with East-West orientation
Data anylsis of East-West street receptor shows that H/W= 1.5 rate has a heat stress rate with a maximum PET index at 12.30 at 48.5°C, which is comparable with other receptors with rate of H/W= 3 (Fig. 6). Moreover, increasing H/W rate and shading, boost outdoor thermal comfort.
The impact of urban geometry of SHAHED with East-West orientation
Data anylsis of East-West street receptors shows that H/W ratio is same (height ratio to 1.87), but the northern side exposure to the sun with a maximum PET index of 42.7°C has a lower thermal comfort than the southern side with a maximum PET index of 41.3°C (although this difference is negligible; Fig. 6). Despite high H/W rate in PACHENAR, vegetation and buildings materials road surfaces cover is important in enhancing outdoor thermal comfort. Wind flowing effect thermal loss, in addition shading can enhance thermal comfort. There is a need for suitable vegetation to provide outdoor thermal comfort.
Discussion of Results & Conclusions
This study investigated the relationship between urban geometry, urban microclimate, and outdoor comfort in two different built-up areas, with different urban geometry, in the city of Mashhad, during the warm season. The study illustrated that PET index has inverse change with the rate of H/W and urban geometry play an improtant role on outdoor thermal comfort. Simulations carried out in PACHENAR shows that the higher H/W rate lead to boost PET index and pedestrians thermal comfort. The study shows that in SHAHED, increasing H/W rate, lead to enhance outdoor thermal comfort and the PET values. The reduction of PET may reach 15°C. These results are matched to Emmanuel et al. (2007), Yang et al. (2015), Saud Alznafer (2014) and Rodríguez Algeciras et al.
(2016). The study depicts that PET index is not affected by the street orientation to a significant extend and it depends on shading. Moreover, street canyons and their orientation in PACHNAR are not suitable for flowing wind and its effect is negligible in this case. However, in SHAHED shallow street canyons reason to flowing
Environmental effects of urban … Elham Sanagar Darbani, et al.
4
wind. An analysis of the distribution of MRT in areas showed that high rise buildings in SHAHED had the highest frequency of high MRTs than low rise buldings in PACHENAR. Green areas and trees are another parameter that has an effect on outdoor thermal comfort. Due to the narrow and deep valleys in PACHENAR, there was no green spaces and trees, while in the SHAHED, vast range of trees with different umbrellas was simulated. The study illustrates green spaces have reduced air temperature. According to the software reviews and outputs, the physiological equivalent thermo-physiological index of PET in SHAHED is higher in the thermal comfort range. Findings show that urban geometry such as the H/W ratio, vegetation reduced thermal stress. These results are matched to Ali-Toudert, Mayer (2006) and Abreu-Harbich, Labaki et al. (2014) studies.
Keywords: Envi-met,outdoor thermal comfort, PET index, Rayman, urban geometry. .
Evaluation of factors affecting mean radiant temperature in a public apace (Case study: Shanbedi passage way in Bushehr)
Zohre Majidi1, Mohsen Taban2
1. M.Sc. of Urban Design, Faculty of Architecture and Urban Design, Jundi Shapur University of Technology, Dezful, Iran (Email: Majidi_zh@jsu.ac.ir)
2. Assistant Professor, Faculty of Architecture and Urban Design, Jundi Shapur University of Technology, Dezful, Iran
Received: May 9, 2017 Accepted: February 4, 2018
Expanded Abstract Introduction
Rapid urban growth and expansion caused reduction in the level of thermal comfort in urban open spaces.
Reducing the use of air-condition systems in buildings is one of the positive interventions for protecting the environment in the cities in order to create suitable thermal conditions in the interior space. There is a direct relationship between thermal parameters of interior spaces and the outside ambient temperature. Creation of peoper outdoor condition for buildings and public spaces in city is the first and foremost action in order to control and optimize the thermal behavior of buildings. In a hot climate, creation of enclosure in urban open space leads to create more shadow and decrease radiant temperature which results in improvement of comfort condition and reduction of building energy use for cooling and saving energy consumption. Today, outdoor design should be put in our urban planning for improvement of environmental conditions.
Using appropriate enclosure in urban open spaces especially in hot and humid cities, one can improve the microclimate condition. Todays, morphological changes, plants and landscape reduction, air pollution and inappropriate construction lead to disturb the environment and increase temperature. Historic fabric is a good source for harmonizing urban planning with the climate. The meteorological parameters such as temperature, humidity, wind speed and radiant temperature have significant role in thermal comfort.
Thermal comfort is a necessary factor that should be considered in every stages of urban design process. One of the main issues in the assessment of the human comfort in outdoor spaces (especially in sunny outdoor conditions) is the amount of mean radiant temperature which is the sum total of short-wave and long-wave of absorbed radiation flows by the human body. The mean radiant temperature assessment is more sensitive because radiation is one of the meteorological factors which has a huge effect on human thermal comfort. The Mean Radiant Temperature is used as a benchmark more than the air temperature or the temperature for analysis of the impact of weather on the comfort of people. In the past, mean radiant temperature of historic fabric was balanced with creation of shades and it can be seen in several design and construction strategies like high walls, narrow passage ways, planting trees and awnings on façade and its glaring area. The mean radiant temperature is influenced by climatic parameters such as temperature, humidity, radiant temperature, wind, orientation and space enclosure.
The aim of this study is to evaluate the effect of urban fabric and physical design on the mean radiant temperature to control level of thermal comfort for inhabitants. Focus on the mean radiant temperature is essential for pedestrian and urban open spaces design. Bushehr is a coastal city in the south-west of Iran (Latitude: 28°55 N, Longitude 50°55 E) which has a hot and humid climate. Providing of thermal comfort is essential for people's presence in outdoor spaces in the city especially in the warm seasons. In cities, promoting use of streets and open spaces by pedestrians has physical, environmental, economic and social benefits. Thus, ensuring people's comfort in open spaces is essential for improving the quality of urban life. In a complex urban environment, the radiation is considerably different in open spaces because of buildings and vegetation shading and due to various surface materials.
Shadow creation and conducting wind flow into open spaces are very important for Bushehr to improve comfort.
Shanbadi district is in the eastern part of historic fabric of Bushehr. In historic fabric of Bushehr using enclosure, ـــــــــــــــــــــــــــــــــــــــــــــــــــــــــــــــــــــــــــــــــــــــــــــــــــــــــــــــــــــــــــــ ـــــــــــــــــــ
Corresponding author: E-mail: Mntaban@jsu.ac.ir
Evaluation of factors affecting mean ...
Zohre Majidiand Mohsen Taban 6
orientation of passages and buildings and use of appropriate materials, thermal stress was reduced through ventilation and shading. Also, high density of physical environment has influenced the thermal comfort. Street enclosure has been created by varying the width of street and height of the buildings. The historic fabric of Bushehr is located in the northeast part of Bushehr and has a triangular shape which is surrounded by sea on three sides (East, West and North) and one connection side (south) to the mainland and it is composed of four districts. Historic fabric of Bushehr is known as Charmahal consists of four districts: Dehdashti, Shanbadi, Kuti and Behbahani. Considered Shanbadi passage way has north-west south-east direction. There are valuable historic buildings in this district. Old bazar of Bushehr is in this district and some part of that has been reconstructed and regenerated. In present research 7 sections with different enclosure rate have been studied.
Shanbadi is one of the 4 historic districts in Bushehr and have lots of climatic design strategies which create harmony of urban fabric and local climate. Some passages leading to this area are input and output of the wind in different hours.
Materials & Methods
In this study, meteorological data are obtainedthrough field study in three seasons (summer, fall and winter) and in four period of time. In this research, summer study is analyzed. The site is in Shanbedi district, one of the four old district in Bushehr. Seven sections with different enclosure were chosen in study area and climate data is surveyed during the day separately in each of these sections. RAY man 1.2 software was used for calculating the mean radiant temperature. RAY man 1.2 software is a tool for calculating the mean radiant temperature and heat index such as PET, PMV and SET in urban studies. Mean radiant temperature calculation in RAY man software requires some information such as geographic location (latitude, altitude and time difference with Greenwich), the time of study data (date and time of study), characteristics of meteorological data (air temperature, humidity , cloud cover, wind speed and vapor pressure), surrounding surface reflection, scattered radiation ratio, the Bowen ratio and the global radiation. Air temperature and relative humidity for calculation of the mean radiant temperature were determined by WBGT device every 30 seconds and the amount of air flow by ANOMETR 3880 every 5 minutes. Both devices were set at a height of 1.7 m above the ground.
Results and Conclusions
The result indicates that in the area surveyed 10 to 12 o'clock enclosure has the most effect on the mean radiant temperature. In many hours of the days, wind has the most influence on the mean radiant temperature. There is a direct relationship between wind speed and enclosure. At 8 to 10 and 10 to 12 o'clock there is a relatively strong relationship between wind speed and enclosure, but in the period of 12 to 14 o'clock and 14 to 16 o'clock, the impact of the wind speed on enclosure is reduced until it loose its effect. In this section one of the influential factor increasing wind speed is multiple passages lead to this section that guide the wind to this area. In different hours of a day, we can see change in mean radiant temperature due to change of wind speed changes. Another influential factor, especially in the middle of the days, is the solar radiation when it is vertical and other factors have more influence than enclosure on the mean radiant temperature. For this time of the days awning and canopy in street is advised to decrease the amount of mean radiant temperature. Generally, in the most hours of the days wind has the greatest impact on improvement in the mean radiant temperature in this area.
To improve thermal comfort and decrease mean radiant temperature, especially in the middle of the day, shade should be created in the pedestrian path areas, sidewalks and public spaces. It can be made through artificial shading elements, locating trees which provide shadow or projections in building. Smart shading devices can be used to respond to need of radiation and shading in different time of the day and different seasons. These shading devices are capable of opening and closing automatically. Other green design parameters such as photovoltaic cells and water facilities to store water can also added to this devices. It can be a good design alternative for maintaining of thermal comfort in urban open public spaces in Bushehr.
In addition, creation of space with enclosure degree (ratio of height to width) of 1.73 makes it possible to create a favorable space. Enclosure can be created through use of the large tree canopy with radius more than 2 m in streets which the width is more than its height. Awing projection should be at least half of the height of the openings to create thermal comfort and reduce mean radiant temperature.
In a complex urban environment, the radiation flow is considerably different in open spaces due to casting shadows by buildings and vegetation and various surface materials. So, change in mean radiant temperature can make considerable spatial sensation changes even in a short distance.
The amount of shading can be optimized by using different shading strategies even in low enclosure rate of section. This can be obtain naturally using tall trees with big green mass and artificially by building projection and in site shades. Light color low reflection materials can absorb less heat and decrease amount of heat gain spatially in open spaces.
Keywords: Mean Radiant Temperature, RAYman software, Shanbedi passage way, space enclosure.
Resolving conflict on the trade-off curve generated by a multi-purpose sustainability model for the natural environment and farming under water
bankruptcy
Ali Reza Nafarzadegan1, Hassan Vagharfard2, Mohammad Reza Nikoo3, Ahmad Nohegar4 1. PhD Candidate, Department of Watershed Sciences & Engineering, University of Hormozgan, Bandar-
Abbas, Iran (Email: a.r.nafarzadegan@gmail.com)
2. Assistant Professor, Department of Watershed Sciences & Engineering, University of Hormozgan, Bandar-Abbas, Iran
3. Assistant Professor, Department of Civil and Environmental Engineering, Shiraz University, Shiraz, Iran (Email: nikoo@shirazu.ac.ir)
4. Professor, Faculty of Environment, University of Tehran, Tehran, Iran (Email: nohegar@ut.ac.ir)
Received: July 9, 2017 Accepted: February 4, 2018
Extended Abstract Introduction
The contradiction between increased demand for water and decreased water availability has led to excessive exploitation of water resources and, in some cases, encroachment on the share of water needed to preserve the natural environment. Today, managing water resources and finding optimum strategies for water allocation has attracted the attention of policy makers. Water scarcity, especially in arid and semi-arid areas, makes the situation dire and challenging for water allocation. Such physical restrictions cause competition for water among irrigation and drainage networks and the ecosystem. In order to achieve optimum sustainable strategies for allocation of water between multiple stakeholders, a set of conflicting (negatively or weakly correlated) and incommensurable objective functions should be addressed.
To reach optimum crop area and water allocation schemes, one can optimize the amount of water allocated to the plant by considering the crop response to water deficit. Thus, the cultivation of susceptible and resistant plants could be planned with full and deficit irrigation, respectively, under obtained optimum acreages. On the other hand, the incorporation of crop-water production function into the linear objective function for maximizing agricultural net benefit would transform it to a non-linear objective function. Therefore, the problem would become more complicated.
Regarding practical problems, the optimization of the ratios of variables and parameters would provide a deeper understanding for managers and decision makers than optimizing each of them in the form of a separate objective function. Thus, such formulation can be considered as a tool to assess the sustainability of agricultural ecosystems. Combining the objectives by taking advantage of ratios would facilitate the process of analysis of alternative solutions. One of the issues in dealing with multi-objective optimization problems is the choice of a solution from a usually large set of non-inferior alternative points that make up the optimal tradeoff (Pareto) curve. One can take advantage of social selection methods to resolve conflicts between the objectives of different stakeholders by identifying the best settlement solutions from among an optimal set of non-inferior alternative solutions.
The aim of the current study is to develop a non-linear multi-objective optimization model for water allocation which takes into account crop-water production function, reservoir continuity, and surface water balance. The developed multi-purpose framework is based on four sustainability indicators, two fractional functions and two simple functions.
ـــــــــــــــــــــــــــــــــــــــــــــــــــــــــــــــــــــــــــــــــــــــــــــــــــــــــــــــــــــــــــــ ـــــــــــــــــــ
Corresponding author: E-mail: hvaghar52@yahoo.com
Resolving conflict on the trade-off ...
Ali Reza Nafarzadegan, et al.
8
Materials & Methods Study area
The Dorudzan reservoir-river system is situated in the northern part of Fars Province, Iran. The system is fed by the Kor River. The Kor River supplies the water needs for Dorudzan and Korbal irrigation and drainage networks; at the end of its path, it discharges into the Bakhtegan Lake. The Dorudzan irrigation network comprises a main channel and three main irrigation channels that include a primary right channel (Ordibehesht), secondary right channel (Hamoon), and primary left channel.
The construction of upstream dams has remarkably decreased water input into the Bakhtegan Lake and mostly limited it to floods in the region. The drying of this lake has led to the spread of saline areas and occurrence of salt storms.
Water bankruptcy
The two main components of a bankruptcy situation are the amount of resources available and the claimed amounts of the stakeholders. In most water allocation cases, the first component can be easily equated with the amount of water available for distribution between users at a specific time and place.
The proportional cutback rule is one of the long-established principles for bankruptcy situations. It is widely employed to manage water resources under water scarcity in different parts of the world, including allocation of qanat water in Iran. According to the proportional cutback rule, allocated water to each water claimant is according to a proportion of its claimed volume of water. This proportion is defined as the ratio of total available water to total water demands of water claimants.
Deficit irrigation
Deficit irrigation is an optimization policy in which plants are subjected to different levels of water shortages. In each condition, the desirable level of water shortage and the resultant crop yield are determined through an optimization process on the basis of crop-water production function. This function describes the relationship between the gained crop yield and the total amount of water consumed by the plant through evapotranspiration.
Social choice approaches
Social decision-making methods are procedures that take into account all individual preferences in order to reach a social preference. In the current study, social choice rules such as the plurality, Borda count, median voting, majoritarian compromise, pairwise comparison, and Condorcet choice have been employed to choose a compromise point among a set of non-inferior alternative solutions.
Proposed sustainability model for farming and the ecosystem
In this research, we developed an optimization model for multi-purpose agricultural and environmental sustainability. The main goal of the proposed model was to address the optimal allocation of water between farming and the ecosystem in the Dorudzan reservoir-river system. The developed model consists of four objective functions, two fractional functions and two simple functions.
The first objective is the maximum ratio of net income– in terms of deficit irrigation– to blue water utilization. In order to optimize the virtual water content in agricultural products, one can divide the crop water requirement into two parts, green and blue water, and attempt to improve the water use efficiency of irrigation water.
The second objective is the maximum ratio of total crop yields to total blue water utilization or, in other words, the minimum total blue virtual water content.
The third objective is the maximum fairness in water allocation or minimum total difference between the amount of allocated water to each irrigation district and the water share, which is determined by the bankruptcy, proportional cutback, rule.
The fourth objective is the minimum shortage in meeting the water demand of the Bakhtegan Lake ecosystem.
The main constraints of the proposed model are reservoir continuity, surface water balance at the downstream of the dam, crops’ acreages, and water consumption in each irrigation district.
Discussion of Results
We computed the average values of the 12-month standardized runoff index (SRI) for the 7-year periods (33 periods) from 1976-2015. According to the outcomes, the period of 2007 to 2014 water years, with an annual average SRI value of -1.25 was selected as a period of water bankruptcy for implementation of a proposed simulation-optimization model for multipurpose sustainability of the Droudzan reservoir-river system.
By solving the developed model using the Non-dominated Sorting Genetic Algorithm II (NSGA-II), we generated an optimal trade-off set that contained 637 management alternatives. Each generated alternative offered different values for the objective functions of the model.
There was no socially optimal management option based on the median voting and majoritarian compromise rules. This output revealed that none of the generated efficient management alternatives could obtain the approval of the majority of stakeholders, not only at first ranking level, but at all possible ranking levels (637 levels). Moreover, the compromise set derived by the Condorcet rule was an empty set. The latter output indicated that there was no management option in the generated optimal trade-off set, which agreed upon by all stakeholders through the pairwise comparison procedure.
The output of the plurality rule was a compromise set with four members given the fact that the voting took place between the four aspects of sustainability. Therefore, each of the four identified options by the plurality rule was the most desirable option based on one of the four aspects of sustainability in the system under consideration.
Among applied social choice techniques, only the Borda count and pairwise comparison approaches were able to identify a compromise set with a single member, Management Option No. 87, which could be recognized as the socially-optimal conflict-resolving alternative for the problem under investigation.
According to the conflict-resolving management alternative, the 7-year (the bankruptcy period) average of the cultivation areas allocated to wheat, barley and canola would be 16%, 24%, and 41%, respectively. This management option would supply 46% of the water demand of Bakhtegan Lake. In terms of relative satisfaction, this alternative has the second rank based on three sustainability indicators of the blue water productivity, allocating water for preserving the natural environment, and fair distribution of water among identified socially- optimal management options.
Conclusion
Given the nonlinear and multi-objective nature of the problem under investigation, the output of the developed model was an optimal set of non-inferior solutions that form the trade-off curve between four aspects of sustainability (objective functions) in the Dorudzan reservoir-river system. The current study also attempted to find a compromise solution among generated non-inferior alternative solutions by using social choice rules.
Results of the proposed methodology provided valuable information on efficient water governance strategies and how to achieve multi-purpose agricultural and environmental sustainability in the study region.
Keywords: equity, fractional programming, multi-objective optimization, social choice rules, water allocation..
Formulation of ecological design and ...
Niusha Habibi Ardebili, et al.
10
Formulation of ecological design and regulating strategies for urban rivers with reference to run-off water control (Case Study: Ziyarat River, Gorgan
city)
Niusha Habibi Ardebili1, Mohammad Reza Masnavi2, Bahram Malek Mohammadi3 1. MSc. of Environmental Design Engineering, Faculty of Environment, University of Tehran,
Tehran, Iran (Email: niusha.habibi@ut.ac.ir)
2. Professor, Department of Architecture and Environmental Design, Faculty of Environment, University of Tehran, Tehran, Iran
3. Associate Professor, Department of Environmental Planning and Management, University of Tehran, Tehran, Iran (Email: malekb@ut.ac.ir)
Received: July 4, 2017 Accepted: February 4, 2018
Expanded Abstract Intr oduction
Urbanization has made fundamental changes on the earth, air, energy resources and urban population that have had immense ecological consequences for urban habitats, including urban rivers. Rivers are the vital elements in the supportive network of urban environment; and urban rivers can be considered with special ecological value which is gradually increasing in urban landscape. Excessive exploitation of natural resources than the environment capacity generates waste out puts that have gradually disrupted life and biodiversity in urban areas.
Natural corridors are seen as the components of the landscape structure in landscape ecology and rivers are considered as one of the most important natural corridors in landscape structure. According to Forman and Godron theories, the rivers corridors are classified to three parts such as the channel river bank, floodplain and hill slope.
Ecologists believe that ecosystem services provided through green infrastructure, can present healthy environment and physical and mental health for residents, a healthy environment can improve social and economic benefits and has an important role in various cities of the world. For instance, a landscape which had been neglected in River Mother (in Qian'an City, Hebei Province, China) was rehabilitated and designed based on landscape ecology approaches and users are considered at all stages of the process. Ecological solutions then were presented for rehabilitation and improvement of water quality including municipal wastewater management system to separate urban waste water and surface water, the strategy of flexible and green river, conversation of river natural ecosystem, using native vegetation and reducing maintenance costs, and eventually creating greenway with sidewalks and cycling line.
Materials & Methods
The area under study in this research is Gorgan city in region the western part of Golestan province. The city is located in the range of latitude and longitude (36.83° North 54.48° East) on the northern slopes of Alborz mountain. This region is structurally composed of three zones including, plain, piedmont and mountainous region. The city is built in the piedmont region. The most striking landscape structural elements in Gorgan are Alborz Mountains and rainforest located in the southern region of the city.
To perform this study, first, the library data are collected, analyzed and addressed to formulate the principles and framework. The source of the articles reviewed and information was the journals indexed in of ELSEVERE and SPRINGER databases. After review of the literature and analysis and evaluation of the area the method that was used in this thesis is formed by combining several methods based on ecological landscape planning and design.
This research has been studied in three scales, the large (studying the river from Ziarat to Gharehsou basin), medium (inside the Gorgan city) and micro scale (the area developing in the southeast of the area between ـــــــــــــــــــــــــــــــــــــــــــــــــــــــــــــــــــــــــــــــــــــــــــــــــــــــــــــــــــــــــــــ ـــــــــــــــــــ
Corresponding Author: E-mail: masnavim@ut.ac.ir
This paper presents part of the findings of Niusha Habibi Ardebili Master Thesis under title: Ecological landscape design of urban rivers with emphasis on run-off water control, case study Ziarat River–Gorgan city under supervision of professor M.
R. Masnavi, and advising by Associate Professor B. Malek Mohammadi, Graduate Faculty of Environment University of Tehran, Iran.
Ghaleh Hassan and Seyed Masood Bridge). Accordingly among the proposed by ideas Mac Harg and Ying, theories were selected and their methods are applied for the analysis of the river structure in basin on urban scale. Finally, the strategy was developed in the context of ecological landscape design in urban rivers and design solutions were provided for micro-scale (urban area). The stages of this study are summarized as following:
1. Analyzing Ziarat River at large scale based on Mac Harg model
2. Mapping the topography and geographical location of Ziarat River basin and deriving the layers by GIS software
3. Identifying landscape structural elements in Gorgan city according to Ying model (middle scale and the whole city)
4. Land use mapping and extracting appropriate layers (ecological, hydrological and topographical, urban construction, human activity)
5. Synthesis mapping of overlaying layers in large-scale (river morphology and flooding) 6. Synthesis mapping of overlaying layers in urban scale (possibilities and limitations) 7. Strategies and actions in the ecological design landscape in Gorgan
8. Ideas and solutions (ecological rehabilitation of the river landscape with sustainable urban drainage systems and floodplains management in the urban environment).
First, by overlapping the layers the knowledge about Ziarat River was obtained at large-scale. Ziarat River is located among steep rivers that can be divided into four zones in terms of organization and preservation project.
In this map four important zones (catchment (1), Naharkhoran (2), urban area (3) and agriculture (4)) were identified and characterized based on overlaying layers in large-scale and middle-scale (urban), then field investigation for checking the status are presented in a table of regulating strategies, policies and ideas for the ecological landscape design of an Ziarat urban river management, flood control and needs of users in those four zones.
Results, Discussion & Conclusions
The world's increased population followed by urbanization and rapid urban development has led to imbalanced presence of nature in cities which has led to serious environmental problems including the disruption of the ecological structure of rivers and increased surface runoff and flood in the city. This has attracted the attention of planners and designers to find solutions and approaches to improve situation. Among these design approaches the urban landscape ecological infrastructures such as urban rivers is among the approaches considered by ecologists, planners and urban designers studies conducted in this study suggest that based on the purposes of river management and flood control of Ziarat River in Gorgan, it is necessary to analyze them based on two scales of Ziarat River catchment (mountains in which the river originates and heads Gharehsou River) and urban scale (Seyed Masood Bridge to the beginning of the agricultural downstream lands) in which Mac Harg (large scale) and Ying (urban scale) methods are used.
The results show that based on Mac Harg and Ying methods at large and middle scales the following cases should be considered:
Establishing integrity in ecological infrastructure (green) through the integration of the riverside vegetation and upstream forests, creating integrity in hydrologic infrastructure (water) through the integration of the urban and river drainage channels and finally overlaying two green and hydrologic infrastructures to control surface runoff and flood in urban area and river.
As a result, the initial strategies and initiatives were developed in four areas based on which strategies for planning and environmental design were presented at the micro scale. According to micro-scale studies developing area in the southeast of the region between Ghaleh Hassan and Seyed Masood Bridge, it was found that the river is too narrow in Ghaleh Hassan and is not capable of retaining the flow of five years, therefore, to reduce the damage caused by floods when it rains and there is severe flood, a diversion track is built where the Ziarat and Alangdaerh rivers meet.
To control the runoff from rainfall due to the slope of the area, four sites are designed to create the retention ponds and storm water treatment to prevent surface runoff flowing into the city. Also, the bioswale is considered to maintain and increase water permeability and lead it to the detour and the city in areas where the slope decreases and water accumulation is likely to happen. Such strategy and framework can help to control surface runoff, rehabilitate river and restore these corridors to their natural structure.
Keywords
:
ecological landscape design, flood control, urban rivers.Erosion and accretion monitoring in ...
Davood Mafi Gholami, et al.
12
Erosion and accretion monitoring in mangrove forests using remote sensing and Digital Shoreline Analysis System (DSAS)
(Case study: Hara Biosphere reserve)
Davood Mafi Gholami1, Masoumeh Baharlouii2, Beytollah Mahmoudi3
1. Assistant Professor, Department of Forest Sciences, Faculty of Natural Rources and Earth Sciences, Shahrekord Uiversity, Shahrekord, Iran
2. MS.C. Student, Department of Forest Sciences, Faculty of Natural Resources and Earth Sciences, Shahrekord University, Shahrekord, Iran (Email: masoomebaharloie70@gmail.com)
3. Assistant Professor, Department of Forest Sciences, Faculty of Natural Resources and Earth Sciences, Shahrekord University, Shahrekord, Iran (Email: b.mahmoudi@ut.ac.ir)
Received: January 16, 2017 Accepted: February 4, 2018
Expanded Abstract Introduction
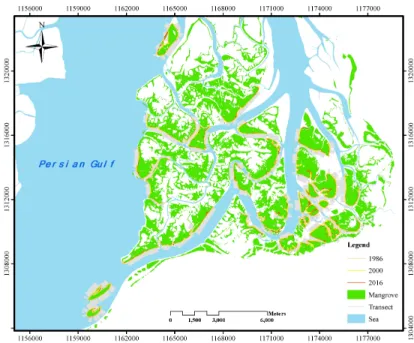
Loss of a wide range of goods and services provided by ecosystems as well as unsustainability of mangrove- dependent human communities are direct results of the destruction and loss of mangrove ecosystems. This shows the importance of effective planning and management strategies for conservation and restoration of mangrove ecosystems. One way to achieve the above objective is to assess mangrove shoreline changes over time, which can be used as one of the best indicators to assess responsiveness of mangroves to sediment morphological and dynamic changes of coastal areas and to assess the vulnerability of these ecosystems to climatic stresses. This shows the importance of assessing the rate of progression and regression and/or erosion and sedimentation to assist the planning and implementing the conservation actions and restoration of mangrove forests of the country. Therefore, the aim of this study is to monitor mangrove's shorelines changes for a period of 30 years in Hara biosphere reserve in Hormozgan province, Iran.
Materials & Methods Study area
Hara Biosphere Reserve with 85686 hectares areas is located in the south of Iran in the Straits of Khuran between Qeshm Island and the Persian Gulf. The study area lies at 26° 45' to 26°58’N, 55° 30' to 55°50’E situated in the Mehran River delta. It hosts the largest Avicennia mangrove along the Persian Gulf shoreline and, represents a centre of biodiversity in Iran. The Strait of Khuran is also a Ramsar site, providing habitat to two globally threatened species: a wintering habi tat for the pelican Pelecanus crispus, and a regular feeding place for the green turtle Chelonia mydas. For ecological reasons such as wetland environment, mangrove forests and biodiversity, this region has attracted many visitors and can be considered as the most spectacular regions of Iran for a unique coastal Seascape.
Processing of satellite images and ground truth and social survey
The landsat images of the years 1986, 2000 and 2016 were used to analyse the rate of progression and regression of mangrove forests of Khamir site during a period of 30 years. Since cloud cover reduces the image quality and causes error in detecting phenomena of the images, by examining a large number of images in the archive of landsat satellite, images without cloud cover were used. Also, to determine the exact boundaries of the Mangrove forests, those images in which the sea level was at low tide, were used in this study. Geometric correction was the first step for image analysis. Although landsat C images are characterized by good geometric precision, in order to achieve maximum possible accuracy, and recorded a total of 128 ground control points using GPS that has a good distribution of the surface area, were also detected in the image. Landsat C images of 2014 with a root mean square error lower than one pixel (in this study, RMS= 0.143) were georeferenced with the use of ـــــــــــــــــــــــــــــــــــــــــــــــــــــــــــــــــــــــــــــــــــــــــــــــــــــــــــــــــــــــــــــ ـــــــــــــــــــ
Corresponding Author: Email: d.mafigholami@nres.sku.ac.ir
IDRISI software, as well as by recording totally 128 ground control points with a good distribution over the region. Finally, the corrected images of landsat C were used for geometric correction of landsat TM images in 1986, 1998 and also the image of landsat MSS in 1973. RMS value of no one of the landsat TM and MSS images in any of corrections was higher than 0.18. All images were geo-referenced to UTMWGS-1984 zone 40N projection and datum.
In general, according to the resolution of the images used, the closed-canopy edge of the boundary of the Mangrove forests was considered as off-shore (marine) boundary and single trees and seedlings in the area beyond the edge were excluded from the analysis of site boundaries. In order to separate mangroves from surrounded water and land in coastal areas and to draw the final borders of the sites, NDVI vegetation index was used. After preparing NDVI and to achieve maximum accuracy in determining the boundaries of mangroves, the off-shore (marine) border of Mangroves was manually digitized using precise visual interpretation on a scale of 1: 10,000 and by help of expertise of the team leading the project. The off-shore border of the mangrove sites were identified in images of 1973, 1986, 1998 and 2014. Finally, the accuracy of digitalized boundaries were evaluated and approved by putting them on landsat images. Ground validation was performed in 2012, 2013 and 2016. Accordingly, a total number of 620 ground control points determining the off-shore boundaries of Mangrove sites were entered into the GIS and then were compared to boundaries extracted from the images.
Also, the location of villages and human settlements in the vicinity of Mangroves was recorded. All recorded points were entered into ArcGIS 10 software for analysis. Also, social surveys were conducted by performing face to face interviews with families living in villages adjacent to mangroves and experts from the Department of Natural Resources of the province. Given that the purpose of the interview was to achieve the respondent views on how the position and size of Mangroves have been changed over time, so those people were interviewed who have the highest history of residence (residence time more than 30 years) in the area. Accordingly, 25 people aged from 50 to 65 years were interviewed face to face. Views recorded were used to analyse the results.
Calculating the change rate of mangrove boundaries using DSAS
As stated above, determining the progression and regression rate of mangroves is based on measuring changes of mangrove boundary position relative to a baseline over time, and transects depicted perpendicular to baselines show these changes over time. In this study, for the selected sites, a number of 1684 transects with a distance of 30 m from each other, were drawn using DSAS software. In this study, by considering the general direction of each site, and also using the mapped buffer for Mangrove boundaries in images of 1998, applied baseline were drawn manually and transects were drawn perpendicular to the baseline. Overall, calculation of the rate of erosion and sedimentation, or the progression and regression can be done using various statistical methods including end point rate (EPR), average of rates (AOR), minimum description length (MDL), by jackknifing (JK), linear regression rate (LRR), reweighted weighted least squares (WLS) least absolute deviation (LAD) and weighted least absolute deviation (WLAD). Among these methods, LRR statistical method has had the highest usage because of assessing changes in coastlines and border of ecosystems at different times (more than 2 periods). In this method, the average rates of progression and regression of mangroves are estimated using the position of mangroves’ border-lines and the baseline and fitting the regression line of least squares relative to the position of the border-lines.
Results & Discussion
The results of the analysis of mangroves’ boundaries changes showed that calculated LRR values vary in different regions. Within these changes, positive values of LRR for drawn transects indicate progression of mangroves’ borders towards the sea (sedimentation) and negative values represent the regression of mangroves’
boundaries (erosion) or the landward migration. Analysis of changes rate of progression and regression showed that of 1684 drawn transects for analyzing the rate change of mangrove boundaries in coastal part of habitat. A number of 875 transects had negative LRR values and 809 transects represented positive LRR values. The highest number of transects with negative IRR values occurred in the western part of the habitat (Khamir site;
53% of the negative transects) so that the mean change rate of mangroves’ boundaries at these sites was equal to 0.26 myr-1. In an eastward move and by approaching to the Kal river estuary, Mardo habitat which was located in Mardo Island, showed an average rate of boundaries changes 0.74 myr-1 or progression towards the sea. Based on these results, the average value of boundaries changes in the coastal part of habitat was equal to 0.50 myr-1. According to obtained results, from 2571 drawn transects for analysing the rate change of mangroves’
boundaries in Island part of habitat, a number of 1734 transects (67% of the negative transects) had negative LRR values and 837 transects represented positive LRR values. The average value of boundaries changes in the Island part of habitat was equal to 0.73 myr-1. This shows progression or sedimentation in mangroves. The results also showed that the minimum and maximum value of LRR was equal to -12.77 myr-1 and 12.98 myr-1, respectively (Fig. 1). The obtained results showed that the progression or sedimentation rate in the island part of
Erosion and accretion monitoring in ...
Davood Mafi Gholami, et al.
14
Hara biosphere was more than coastal part of this habitat. As well, the average value of mangroves’ boundaries changes for Hara biosphere reserve was equal to 0.62 myr-1 which indicates the dominance of sedimentation process over erosion in this habitat.
Fig. 1. Mangrove shoreline changes in Island part of Hara biosphere reserve
Conclusion
In this study, the spatial changes of mangroves’ boundaries in the Hara biosphere reserve were monitored over a period of 30 years. The results showed that the mangrove forests in the study area are characterized by different rates of progression and regression in their distribution ranges according to the dynamic conditions of the coastal area. According to the results, the average rate of erosion or regression in the studied mangrove forests is -0.62 myr-1. These results are comparable with results of other studies conducted in Mangroves’ regions of the world.
A study conducted by Ellison and Zouh (2012) on Mangrove forests of Douala Estuary in Cameroon showed that in a 32-year period (1975-2007), mangroves in the region are characterized by an average regression rate of -3 myr-1. Gilman et al. (2007) estimated the average erosion rate for mangroves of American Samoa as -1.11 myr-1 for a period of 40 years (1961-2001). In a study carried out by Tran Thi et al. (2014), the average regression rate of Mangrove forests of Mui Ca Mau, Vietnam was estimated -3.24 myr-1 during a 51 year period (1953-2011).
These results indicate the lower regression or erosion rate of mangrove forests in Hara biosphere reserve compared to mangroves studied around the world. Finally, it can be said that the results of this study can significantly help implementation of conservation and restoration measures by providing detailed information on the progression or regression of mangroves in Iran. In addition, the results of this study showed that the spatial analysis of mangroves’ boundaries using satellite images and GIS can be a useful tool for monitoring and identification of the most vulnerable and erodible sites.
Keywords: erosion and accretion, landsat, Mangroves boundaries changes.
Investigating the effects of climate change under different scenarios on groundwater in Kerman Plain
Farshad Soleimani Sardoo1, Tayybe Mesbahzadeh2, Naser Broomand3, Ali Azareh4, Elham Rafiei Sardooi5
1. Lecturer, Faculty of Natural Resources, University of Jiroft, Iran
2. Assistant Professor, Faculty of Natural Resources, University of Tehran, Iran (Email: tmesbah@ut.ac.ir) 3. Associate Professor, Shahid Bahonar University, Kerman, Iran (Email: nbroomand@yahoo.com) Assistant Professor, Faculty of Natural Resources, University of Jiroft, Iran (Email: aliazareh@gmail.com) 4. Assistant Professor, Faculty of Natural Resources, University of Jiroft, Iran (Email: ellrafiei@gmail.com)
Received: August 11, 2017 Accepted: February 4, 2018
Expended Abstract Introduction
Changes in air temperature and rainfall have a significant effect on water resources and hydrologic variables.
Climate change and temperature increase, especially in arid and semi-arid regions, will have more severe effects on water resources. One of the most reliable tools for studying the effects of climate change is the use of climatic variables simulated by exponential microscale models such as LARS-WG, which can predict the climatic parameters on a local scale. On the other hand, due to precipitation decrease in arid and semi-arid regions, excess pumping of groundwater aquifers is commonly. Excessive utilization of water resources has led to over- exploitation of aquifer capacity, which has caused irreparable damage to water resources. Therefore, the management of groundwater should be a principle in the country's planning. On the other hand, our country is geographically located in a region that is naturally and inherently part of the arid and hyper-arid regions (about 66%), but also among the countries with a higher coefficient of climate changes than many other regions of the globe the Earth. Increasing the air temperature along with increasing the use of water for irrigation, drinking and sanitation, and water consumption of livestock and poultry, on the other hand, due to climate change, it is considered as one of the most important parameters in feeding groundwater resources. In the discussion of the effects of climate change on water resources, summary of the research background indicates that it is important to research on the effects of climate change on groundwater resources, especially in arid areas, due to the fragile ecosystem. On the other hand, according to the research of Ministry of Energy, Kerman plain is due to excessive overuse of groundwater resources over the last few years, except for forbidden plains. Therefore, research on the effect of different climate scenarios on groundwater level in the future period of Kerman plain for managers' awareness and planning to reduce its negative effects seems necessary.
Matherials & Methods
Kerman Plain located in Kerman province is part of the watershed of Dranjir desert which is part of the central watershed of Iran. This area is located almost in the southwest of the Loot plain. The plain is 2030 km2. Kerman plain is located between 56°, 20´ and 56´´, 57°, 20´ and 50´´ East, 30°, 0´, 23´´ until 30°, 27´ and 5´´ North. In the first stage, the data needed to study the phenomenon of climate change including daily temperature (minimum, average, maximum) and daily precipitation from 1971 to 2012 were collected from the synoptic station of Kerman. The first version of the LARS-WG in Budapest in 1990 was developed as a tool for exponential microscale by the statistical method in Hungary. The three main parts of this model are: calibration of the model, evaluation of the model and the production of meteorological data. The production of LARS-WG data is done in three phases: calibration, evaluation and creation of meteorological data (Babaian et al., 2009). In this research, GMS software and Modflow code are used. The software that incorporates the Modflow model, with a variety of features added to it, has the ability to build and analyze the model with more modflow software.
In order to evaluate the status of groundwater resources from October 2002 to September 2030, four scenarios ـــــــــــــــــــــــــــــــــــــــــــــــــــــــــــــــــــــــــــــــــــــــــــــــــــــــــــــــــــــــــــــ ـــــــــــــــــــ
Corresponding Author: E-mail: fsoleimani2016@gmail.com
Investigating the effects of ...
Farshad Soleimani Sardoo, et al.
16
were considered and the level of stagnation was compared to the initial conditions for 2003, 2013 and 2030 compared to 2002.
Scenario 1. Continue the current harvest of aquifers in the future based on constant and climate change utilization in order to evaluate the aquifer management in the current situation and to answer this fundamental question, what will be the rate of change in the aquifer decline over the course of the current period, without changing the climate.
Scenario 2. Continuation of the current trend in the future based on current utilization and climatic conditions of scenario B1, A2 and A1B in this scenario, it is assumed that monolithic exploitation of underground water is carried out. But climatic conditions change according to scenario B1, A2 and A1B.
Scenario 3. Continuation of the current trend with 10% increase in groundwater exploitation and climatic conditions scenario B1, A2 and A1B.
Scenario 4. Continuation of the current trend with a 20% increase in groundwater exploitation and climatic conditions scenario B1, A2 and A1B.
Discussion of Results
Initially, climate change was simulated using the LARS-WG model. After calibrating and verifying the LARS- WG model, the daily temperature and precipitation time series in the period 2030-2011 directly using the simulation of the HADCM3 model in the LARS-WG model under the propagation scenario (A2, B1 and A1B).
The synoptic station of Kerman was produced and its changes compared to the base period are shown.
Conclusions
The results of the LARS-WG model during the statistical period (2011-2030) indicate an increase in rainfall in the winter and spring, and an increase in temperature in the summer and autumn seasons. Also, annual precipitation changes in scenario A2, A1B and B1 during the following period were 31.71%, 29.26% and 19.41%, respectively, and the mean values of these values were 8.33, 7.35, and 6.09, respectively. We saw the percentage of annual temperature rise, which stated that the temperature and precipitation values in the upcoming period were 4.74% and 13.92% in scenario A2 and 88.2, respectively and 16.48% in scenario B2.
Also, the results showed that during the statistical period (2031-2002), it indicates that the temperature of the region is increasing throughout the season and increasing precipitation in the winter and spring season. In another part of the study, groundwater modeling was done with the GMS model. Also, to determine the accuracy of the model calculated in the stable state, the mean square error (RMSE) between the values of the surface of the stationary in the wells was obtained with the values calculated by the model in October 2002, which was 1.37, indicating the accuracy above the model. It can be said that the calibrated model has acceptable accuracy and the mathematical model can perfectly simulate the natural conditions governing the aquifer of Kerman Plain.
Therefore, this model can be used to simulate the effects of climate change on groundwater fluctuations in the upcoming periods.
Four scenarios were considered with the aim of assessing the status of groundwater resources from October 2002 to September 2030 and providing a management solution. The average of groundwater losses in all four scenarios was for the first scenario (-0.86, -5.85 and -9.9), the second scenario in A2, A1B and B1 states (-9.26, - 9.36 and -9.49), the third scenario in A2, A1B and B1 (-12.09, -12.21, -12.28) and the fourth scenario in A2, A1B and B1 modes (-15.43, -15.55, and -15.58). The results of this study indicate that the calibration model error is accurate and the mathematical model can simulate the normal conditions governing the aquifer of Kerman Plain. Therefore, we can use this model to simulate the effect of climate change on groundwater fluctuations in the future periods. The results indicate a decline in groundwater levels under different climate scenarios that should be resourced with proper water resource planning and strategies to adapt to climate change.
In order to prevent the decline of groundwater level, water use patterns should be revised in different parts. In agriculture, the irrigation system should be changed, the cultivation pattern will also go towards low-water products. Also, due to the impact of climate change, either directly or indirectly, it is necessary to develop adaptation strategies for climate change in order to save on water consumption.
Keywords: climate change, climate scenarios, Kerman Plain, underground water drain.