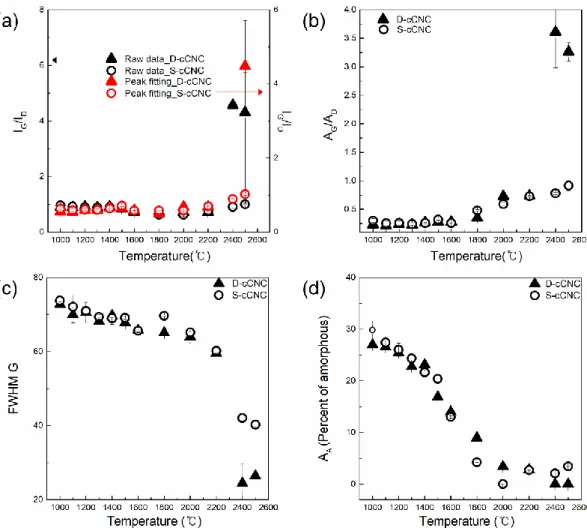
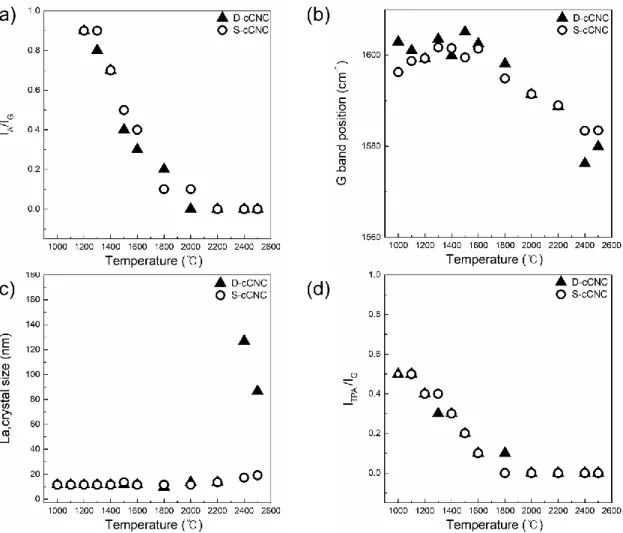
34 Figure 2.9 Graphs of the structural parameters as a function of heat treatment temperature obtained from Raman spectra. 37 Figure 2.10 Graphs of the structural parameters as a function of heat treatment temperature obtained from Raman spectra. 65 Figure 3.11 Tensile properties of PES_CNC2 composite fibers spun from DMAc; (a) Stress-strain curve of PES_CNC2 with spindle-spun-tensile ratio 2.0.
Cellulose Nanocrystals (CNC)
Bottom: dominant network of hydrogen bonds in cellulose Ⅰβ: (left) chains at the origin of the unit cell; (right) chain in the center of the unit cell [5]. Another type of cellulose is called nanocrystalline cellulose (NC) or nanowhiskers, also called "nanocellulose whiskers", "nanocrystals", "monocrystals", "cellulose rod nanocrystals" and whiskers. The final type of cellulose is called bacterial nanocellulose, which also appears in the literature as "bacterial cellulose", which also appears in the literature as "bacterial cellulose", "microbial cellulose" and "biocellulose" [6-9].
Preparation of Cellulose Nanocrystals
Mechanical size reduction
Mechanical procedures have been used to isolate cellulose nanofibers that produce a high shear force that causes transverse cleavage along the longitudinal axis of the cellulose microfibrillar structure, resulting in the extraction of long cellulose microfibrils [10]. A high-pressure homogenizer using cavitation, shear and impact forces broke the microfiber cell walls and obtained the desired nanofibrils. Using liquid nitrogen, the process freezes the cellulose fibers and exposes them to high shear force [11].
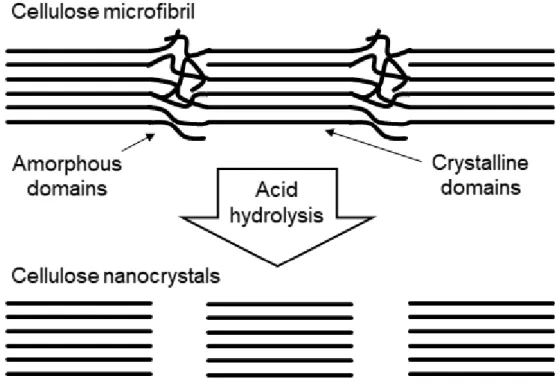
Acid hydrolysis of cellulose microfibrils
CNC prepared with hydrochloric acid cannot generate negatively charged sulfate groups on the surface of CNC, as evidenced by the reaction scheme in the figures below [25-29]. The negative sulfate groups on CNC can be determined by FTIR, as the prominent sulfate peak located at 1205 cm-1 in the CNC spectrum represents S=O vibrations attributed to the sulfate functionality.
Mechanical properties of CNCs
Carbonization of Cellulose Nanocrystals
Mechanism of carbonization of cellulose
Polymer/CNC Composites Films and Fibers
Dispersion of Cellulose nanocrystals
Due to hydrogen bonding and van der Waals force between chains, the dispersion of CNC is one of the key parameters as a reinforcing agent [20, 38]. As the sonication power and time increase, the CNC becomes more dispersive and it is desirable to produce the composite with better CNC uniformity [38]. The hydrodynamic radius of CNC was calculated to be between 22 and 27 nm from equation (1) when CNC is individually dissolved in H2O/DMF solvent.
CNC related polymer nanocomposites
With CNC containing moisture, a hydrogen bond is formed between the water and the surface of the CNC, thus weakening the interaction between the CNC.
Introduction
Carbonization of cellulose nanocrystals
Experimental
- Materials
- Carbonization condition and sample codes
- High-resolution Transmission Electron Microscopy (HR-TEM)
- Raman Spectroscopy
- WAXD Analysis
- X-ray Photoelectron Spectroscopy
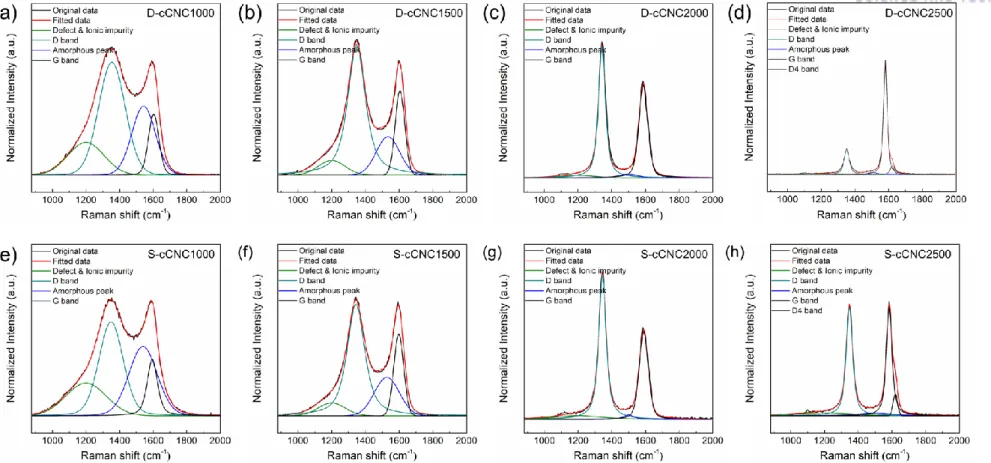
Raman spectra were collected over 30 locations of samples and were averaged over thirty scans to improve the signal-to-noise ratio, and the data were corrected for instrument spectral response. Raman curve fitting for spectral parameter determination was performed with the software program called by Peakfit software package provided by sigmaplot. The peak analysis was performed using the peak deconvolution to fit a Gaussian function using the origin-peak fitting program.
Result and Discussion
Norten et al [37] found that the oxidation process of the cellulose gives dehydration of the cellulose gives dehydration of the cellulose, resulting in the aromatic formation and cross-linking of the structure. Raman spectroscopy is a powerful tool to analyze the degree of perfection of graphitic structures for various carbon materials, including highly oriented pyrolytic graphite (HOPG), graphene, carbon nanotubes, pyrocarbons or carbon black [53–62]. Raman spectrum of single crystal graphite and HOPG shows a single band at 1580 cm-1 and is indicative of the ordered crystallites of the carbons.
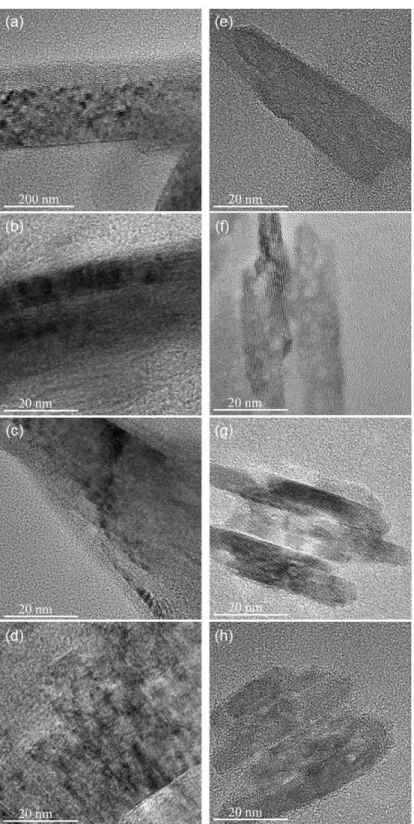
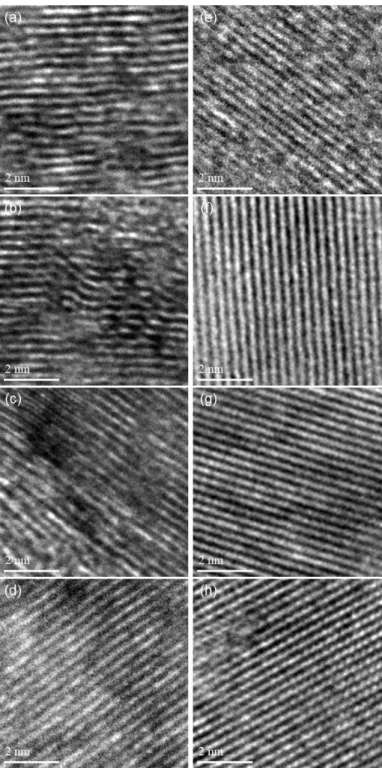
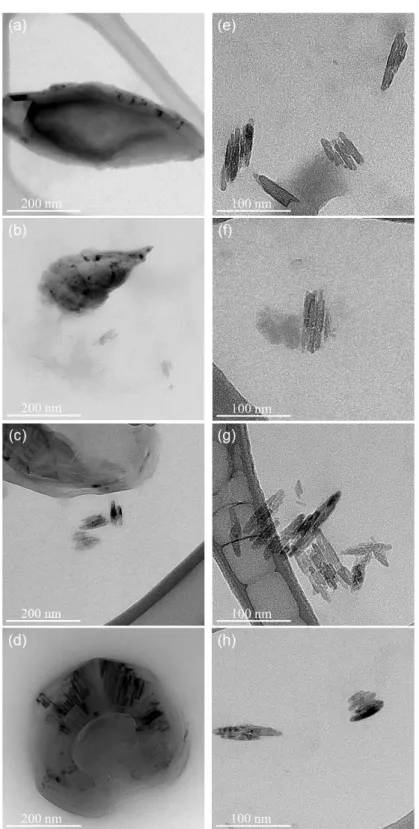
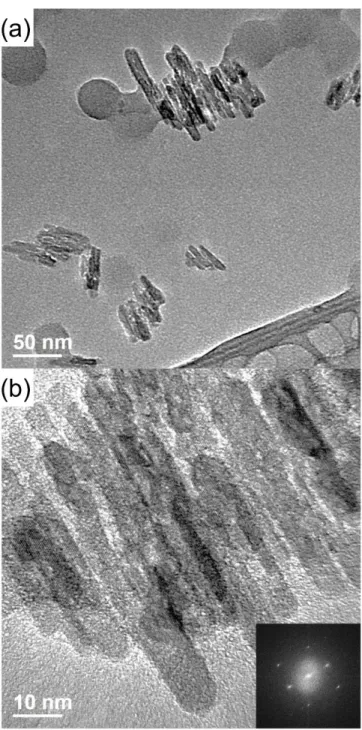
The spectra are normalized to the maximum value of the intensity of the G band, which in each case is located at around 1580-1600 cm-1. Since in-plane defects and small cluster size are known to broaden the G band, these trends indicate that the defect level decreases and/or the lateral dimensions of the clusters increase along the annealing path. As shown in Figures 2.6 and 2.7 (TEM), distortion sites and kink sites are noticeable at low carbonization temperature (1000 and 1500 oC).
The fitting results of the Raman spectra informed that increasing carbonization temperature resulted in decreasing amorphous carbon content. Investigation of C-C bond elongation due to thermal expansion plays an important role in the observed Raman shift with temperature [75–78]. The greater the slope of the line, the greater the thermal conductivity of the samples [80].
The longer bond length is the result of the thermal expansion of the material with the temperature increases. It is indicative that a well-ordered structure of the sample has higher G-band shift, which means that the sample is better able to transfer heat. To evaluate the chemical structure of the surface of cCNCs, peak extraction was processed to the C1s spectra.
Introduction
Current study for PES/CNC composites
Experimental
- Material
- Solution Preparation
- Fiber spinning
- Fiber characterization
From Table 3.1, control PES fibers are spun from DMF at 3.5 m/min using 150 µm diameter 8 hole spinner at 60 oC in water bath maintained at 10 oC. The spun yarns are taken at a speed of 10 m/min and kept immersed in a water bath for 1 day to remove the solvent. The spun yarns are further drawn to maximum at any temperature from 70 to 160 oC and vacuum dried at 100 oC for 1 day.
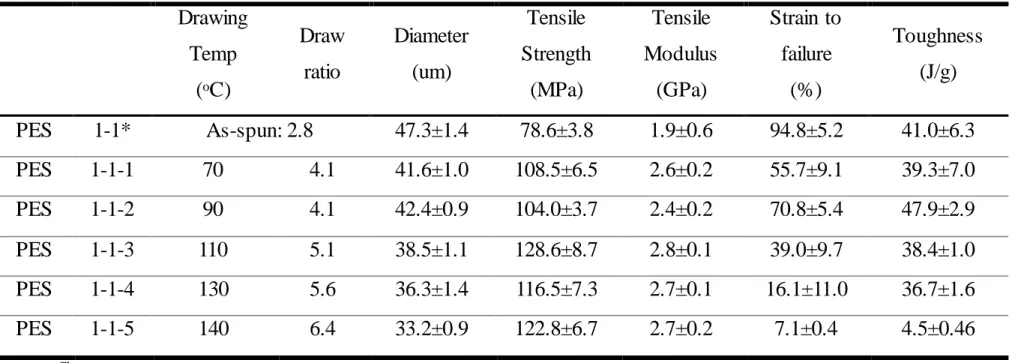
The total draw ratio determined by multiplying the spin draw ratio by the post draw ratio is as high as 6.4 which is listed in Table 3.1. Control PES fibers are spun from DMAc at 3.5 m/min with 150 μm diameter with 8 hole spinneret at 60 oC in a water bath maintained at 10 oC. The as-spun fibers are taken up at 7 m/min and 11.2 m/min and kept immersed in water bath for 1 day to remove the DMAc solvent.
The total drag ratio is determined by multiplying the spin drag ratio by the post-drag ratio. The preload is 1.3 cN/tex and the gauge length is 1 inch for typical tensile testing conditions for measuring linear density.
Result and Discussion
Dispersion study of CNC in DMAc and DMF solution
The tensile fracture surface of the fibers was observed on the gold-coated sample with a scanning electron microscope (FEI, Nova Nano SEM). Based on the theory of the Stokes-Einstein relationship, and the results of Kirkwood and Riseman [40] (𝐷ℎ= 𝐿/ ln(𝐿/𝑑)), the estimated hydrodynamic diameter (Dh) of the CNC from U. It can be calculated the theoretical hydrodynamic diameter of based on the CNC dimension provided by the manufacturer, which is in the range of 44-54 nm.
One can see that, with the use of horn-type sonication, 150 minutes of sonication time were needed to obtain highly dispersed individual CNCs. Although horn-type sonication is a very powerful tool for CNC machining, they have the problem of titanium tip erosion which is critical for the processing of nanocomposites. Therefore, we have tried to use bath-type sonication, where the dispersion is not directly exposed to sonication.
As we performed the dispersion experiment using horn-type sonication, we performed a similar experiment using bath-type sonication. Since the dispersion force of bath-type sonication is much weaker than that of horn-type sonication, it showed the saturation time to be about 30 hours. Due to the impurity issue generated by the horn-type sonication, we performed the bath-type sonication to distribute CNC for nanocomposite manufacturing.
Dynamic light scattering data using bath-type sonication with 0.1 wt.% concentration of CNC in DMAc solution.
Tensile properties of PES and PES/CNC composite fibers
Tensile properties of PES fibers spun from DMAc solvent with draw ratio 3.2 are listed in Table 3.3. From tables 3.1 and 3.2 we get fibers with maximum tensile properties at a tensile temperature of 100-110 oC. For PES/CNC1 composite fibers with Draw ratio 2, there is no difference between PES control fiber and PES/CNC1 composite fibers.
Compare with the maximum achievable tensile ratio with CNC1 1-1-3 samples and PES 2-1-5 samples, the tensile strength and toughness of CNC1 1-1-3 samples are slightly higher than those of PES 2-1-5 samples. For PES/CNC1 composite fibers with a draw ratio of 3.2, the tensile properties of PES/CNC1 with an as-spun draw ratio of 3.2 have higher tensile properties than PES and PES/CNC1 with an as-spun draw ratio of 2.0 . Moreover, PES/CNC1 fibers with a draw ratio of 3.2 as-spun fibers exhibit higher tensile properties compared to PES/CNC1 fibers with a draw ratio of 2.0 as-spun fibers.
For PES/CNC2 composite fibers, the tensile properties are all samples lower than the PES control fibers from Table 3.5. In the case of PES/CNC2 composite fibers, it can be confirmed that CNC does not work effectively as a reinforcing agent and fillers. The mechanical properties of the various structural parameters for the control PES fibers and the composite fibers are listed in Table 3.6.
However, in the case of PES/CNC2 composite fibers, the tensile modulus and strength are reduced compared to PES control fibers and PES/CNC1 composite fibers.
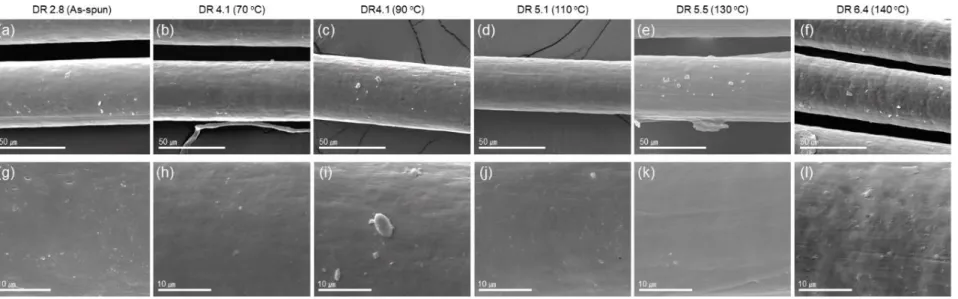
Fiber Morphology of PES and PES/CNC composite fibers
Sheltami, Effects of hydrolysis conditions on the morphology, crystallinity and thermal stability of cellulose nanocrystals extracted from kenaf bark fibers, Cellulose. Yao, Comparison of the strengthening effects for cellulose nanocrystals obtained by hydrolysis of sulfuric acid and hydrochloric acid on the mechanical and thermal properties of bacterial polyester, Compos Sci Technol. Montemagno, Estimation of the sulfur ester content of cellulose nanocrystals prepared by hydrolysis of sulfuric acid: a reproducible and fast infrared method, Wood Sci Technol.
Bawa, Siddaramaiah, Bacterial cellulose nanocrystals exhibiting high thermal stability and their polymer nanocomposites, Int J Biol Macromol. Hu, Low-temperature carbonization of cellulose nanocrystals for high-performance carbon anode of sodium-ion batteries, Nanoenergy. Pereira, Cellulose nanocrystals: a versatile precursor for the preparation of various carbon structures and luminous carbon dots, Ind Crop Prod.
Asthana, Characterization of carbon nanotube filters and other carbon materials by Raman spectroscopy - II: a study of dispersion and disorder parameters, J Raman Spectrosc. Fang, Characterization of carbon nanotube materials by Raman spectroscopy and microscopy - A case study of multi-walled and single-walled samples, J Optoelectron Adv M. Tascon, Comparative efficiency of X-ray diffraction and Raman microprobe techniques for the study of carbon materials, J Mater Chem.
Norouzi, Fouling mitigation of polyethersulfone membranes using an aqueous suspension of cellulose nanocrystals as a non-solvent, Cellulose.
![Figure 1.3 Proposed mechanism for the conversion of cellulose to carbon [33].](https://thumb-ap.123doks.com/thumbv2/123dokinfo/10516961.0/19.893.169.725.110.1048/figure-1-proposed-mechanism-conversion-cellulose-carbon-33.webp)