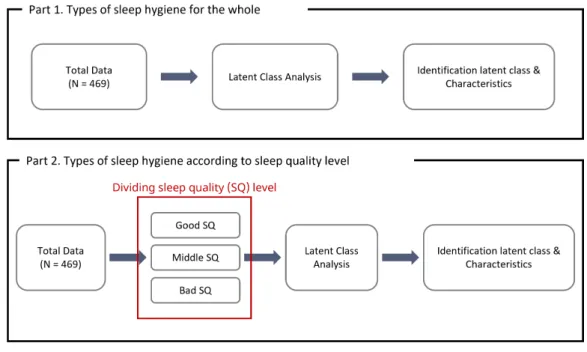
The current study used a Latent Class Analysis (LCA) to investigate the different profiles of sleep hygiene in college. As a result, as a result of classifying latent classes according to the levels of eight subscales of sleep hygiene, three heterogeneous classes were first derived (Good CESH, Middle CESH and Poor CESH). Secondly, as a result of classifying the latent classes of sleep hygiene divided according to the level of sleep quality, there are two heterogeneous classes derived from the GSQ group (Good SEDH and Bad SEDH) and three heterogeneous classes from the MSQ group (Bad STH, Good STH and CPH) and BSQ group (Good CESH, Bad STH and Bad SEDH).
In addition, even if the sleep quality is poor, the type of sleep hygiene that shows a good level has been confirmed.
Introduction
For example, (Tan et al., 2012) reported sleep improvements in children and adolescents following intervention through sleep hygiene education. One study highlighted the need for sleep hygiene education to improve sleep in college students (Brown et al., 2002). An effective way to identify different sleep hygiene profiles is using Latent Class Analysis (LCA).
How are the sleep hygiene groups classified according to the level of sleep quality at university.
Related Works
This is because the PSQI was originally designed to be used as a simple and valid evaluation of disorders that could affect sleep quality in clinical populations (Buysse et al., 1989). In (Leigh et al., 2016) the NHP Sleep scale was used, but the scale was found to be highly consistent with the PSQI and similar questions were found. Matricciani et al., 2020) identified sleep profiles for children and parents together, but in this one, sleep, physical activity and sitting time were collected using a wrist-worn GENEActiv accelerometer.
Most studies on the sleep of Korean university students have also confirmed sleep patterns using questionnaires such as the morning-eveningness questionnaire (MEQ) and circadian rhythm (Kim et al., 2006; 김정기 et al., 2009; Lee et al., 2016 ).
Method
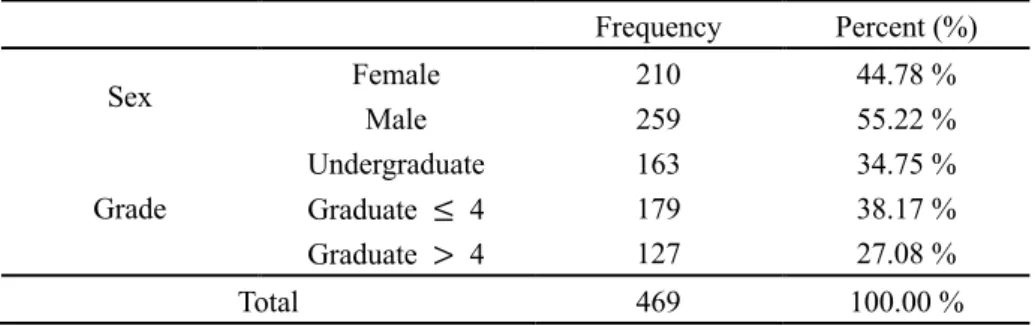
Participants and procedure
Subsequently, data were collected only from respondents who agreed in writing that their survey responses were used in the study. To improve data quality, consistency between the background information and the response to the confirmation question was confirmed. When any inconsistent response was received, respondent data were excluded from the analysis.
For the study, there may be potential factors for cultural differences, so only Korean students' responses were used.
Measurements
The cut-off point of PSQI was 5, meaning that the higher the score, the worse the sleep quality. Anxiety Generalized Anxiety Disorder-7 (GAD-7; Spitzer et al., 2006), consisting of 7 questions, was used to evaluate anxiety symptoms. In this study, only 6 questions from Part A were used, and the higher the score, the weaker the attention.
Alcoholism The Korean version of the Alcohol Use Disorders Identification Test (K-AUDIT; Kim et al., 2008) was used to measure the level of drinking problems.
Statistical analysis
In the case of women, 6~10 points were the cutoff level and 10~40 points were the risk level. In the case of men, 10~20 points were divided into borderline levels and 20~40 points were divided into risk levels. The final model was determined by extensive determination of class size and interpretability, as well as model goodness-of-fit, such as the likelihood ratio statistic (G2), information criteria, and entropy.
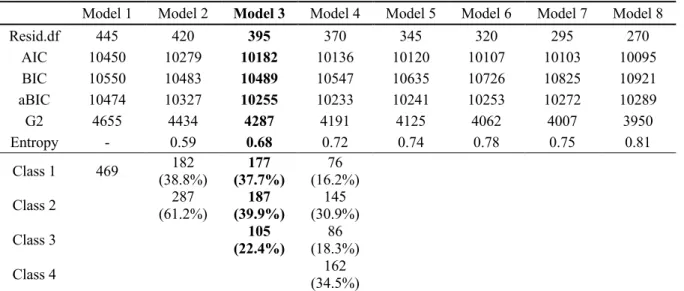
Entropy was an indication of how accurately the classes are classified, and the closer it is to 1, the smaller the error and the better the classification. Therefore, the smaller the AIC, BIC, aBIC, and G2 values and the larger the entropy values, the better the model fits. Even if the statistics were good, whether the model could be interpreted in a substantively meaningful way from a content validity standpoint was also an important consideration.
After selecting the final model, participants were assigned to their most likely latent class. After that, group differences around the 8 sleep hygiene subscales between the identified LCA classes were confirmed by analysis of variance (ANOVA), post-hoc test and item response probability. In addition, differences in characteristics by class were analyzed in sleep quality, emotional factors, and factors related to college life by ANOVA and post-hoc test.
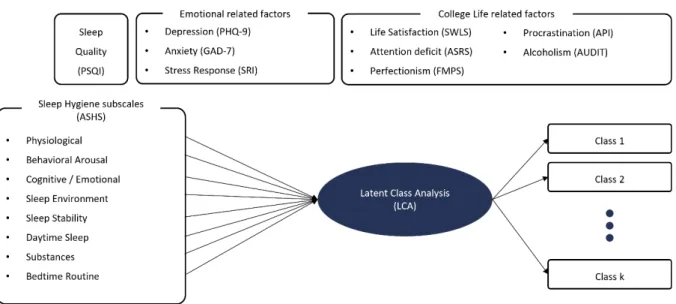
These were performed in R (version 4.0.4) and post-hoc analyzes were performed with Scheffe's test. The LCA model used in this current study can be expressed as shown in Figure 2.
Results
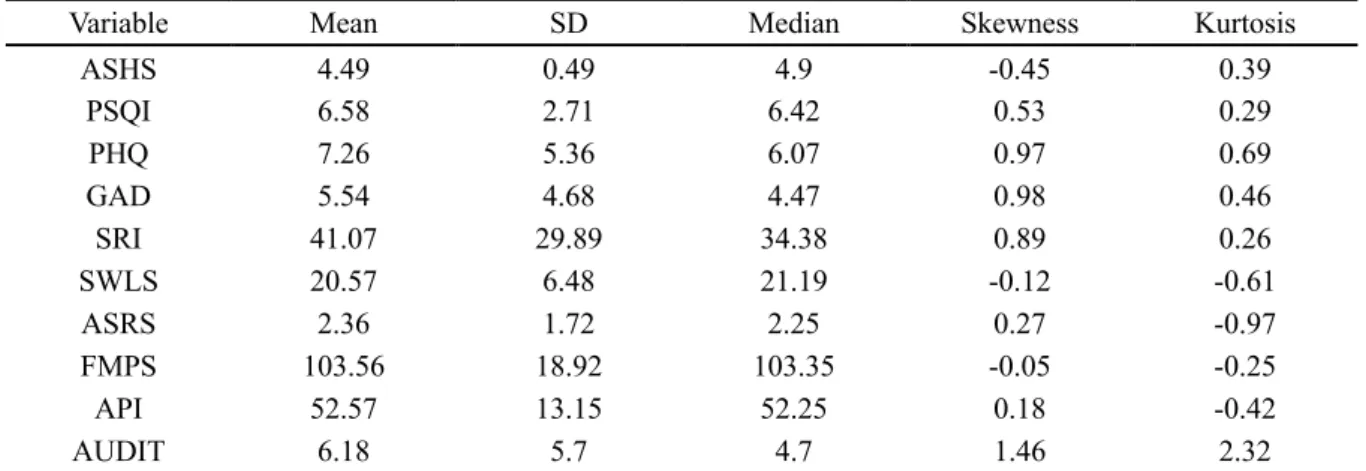
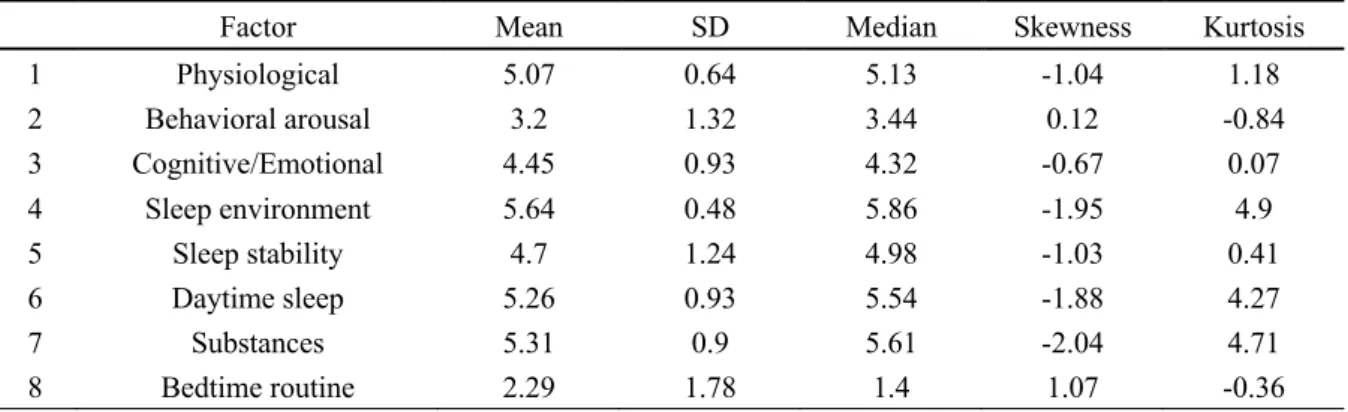
Descriptive statistics
Part 1: Types of sleep hygiene for the whole
- Model selection
- Latent classes on sleep hygiene
- Characteristics between latent classes
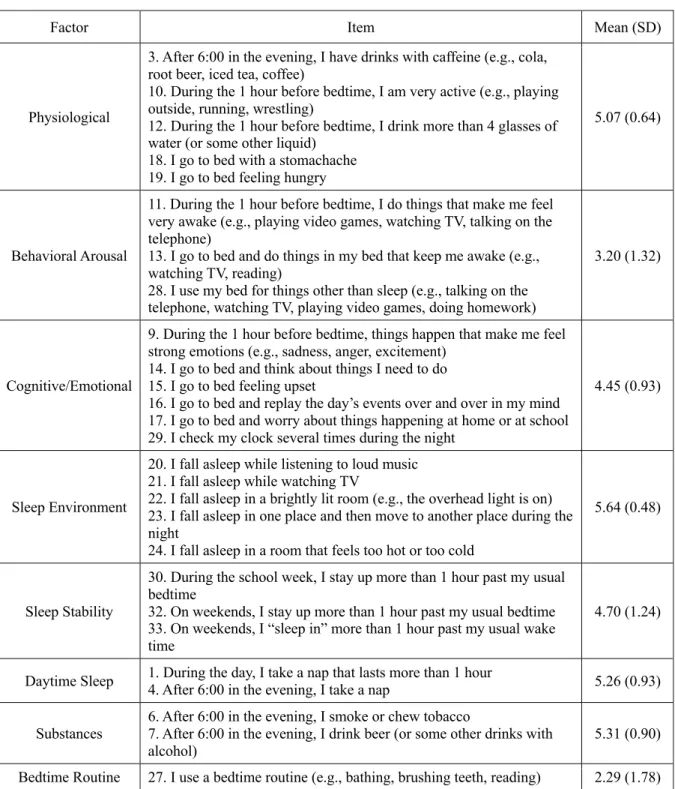
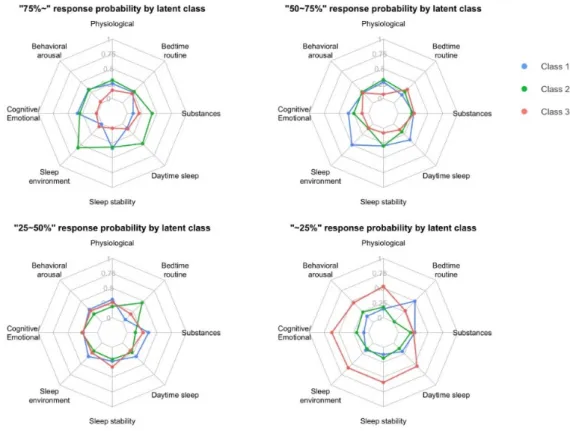
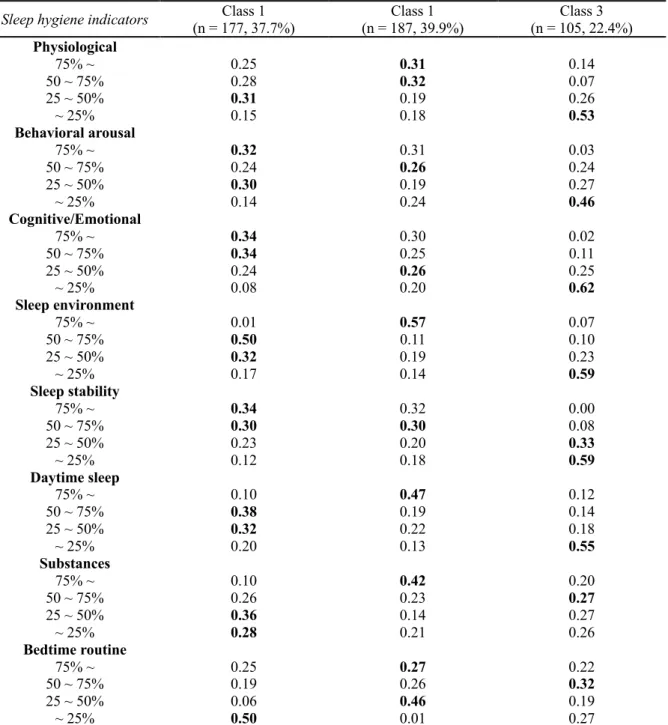
The meaning of each latent class can be interpreted with a score distribution for the 8 sleep hygiene subscales for each latent class. However, compared to other classes, there appeared to be problems in substance hygiene and it was confirmed that about half of the subjects did not have a bedtime routine. In class 2, the percentage of subjects with scores above the 50th percentile accounted for more than 60% of the class in 5 subscales of sleep hygiene: physiological, sleep environment, sleep stability, daytime sleep, substances.
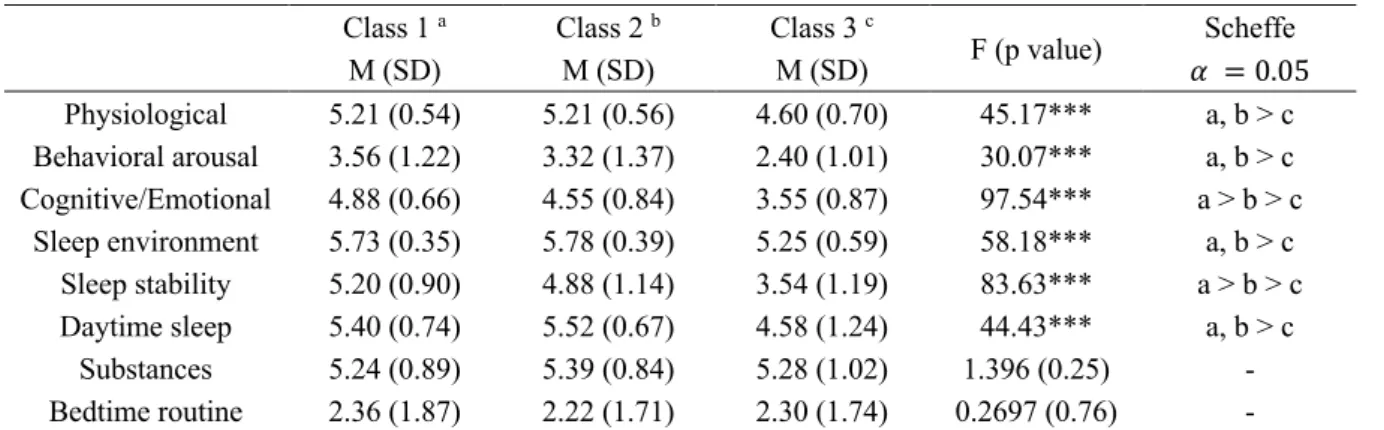
In addition, they were found to have higher sleep hygiene scores than Class 1 in daytime sleep and substance use factors. In addition, in the physiological, cognitive/emotional, sleep environment, sleep stability and daytime sleep, more than half of the class was distributed in response and was very high at 0.62 in the cognitive/emotional factor. ANOVA and post-hoc test were performed to confirm statistical differences in sleep hygiene subscales according to latent classes, and the result was presented in Table 7.
All three types showed statistically significant differences in the remaining 6 subscales, except drugs and bedtime routine factors. These post-hoc tests showed that there was a significant difference between the three latent classes in the factor of cognitive/emotional and sleep stability. It was also found that the mean value of sleep quality level was significantly higher in the order of Poor CESH, Middle CESH and Good CESH groups.
Regarding the variables related to college life, the mean values of the good CESH group and the average CESH group did not show a significant difference. Adolescent sleep hygiene rate; PSQI = Pittsburgh Sleep Quality Index; PHQ = Patient Health Questionnaire-9; GAD = Generalized Anxiety Disorder-7; SWLS = Satisfaction with Life Scale; ASRS = Adult Attention Deficit/Hyperactivity Disorder Self-Report Scale; FMPS = Frost Multidimensional Perfectionism Scale; API = Aitken Procrastination Inventory; AUDIT = Alcohol Use Disorders Identification Test.
Part 2: Types of sleep hygiene according to sleep quality level…
- Sub-groups divided according to the sleep quality level
- Model selection
- Latent classes identified within each sub-group
- Characteristics between latent classes within each sub-group
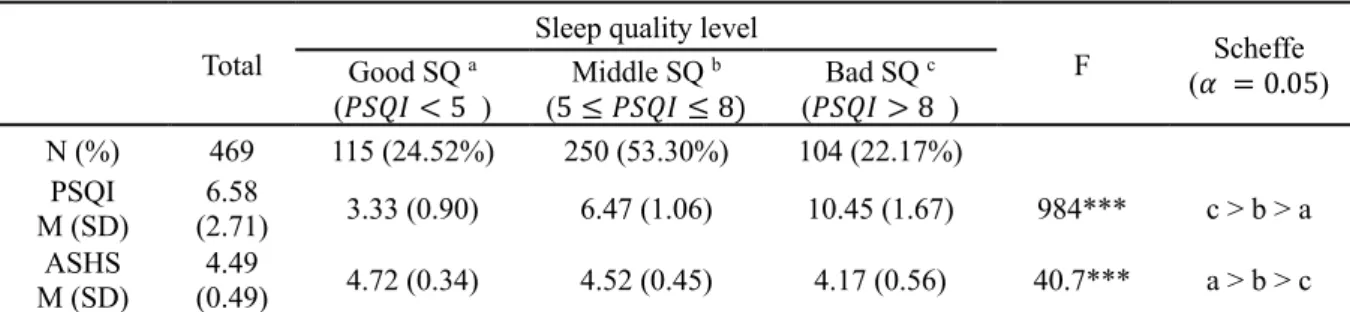
Descriptive statistics for the total sleep quality score (PSQI) and sleep hygiene score (ASHS) of each group were presented in Table 9. In contrast, the BSQ group had the highest PSQI and the lowest ASHS, which was defined as the group with the worst sleep quality and sleep hygiene. SQ = sleep quality; M = mean; SD = standard deviation; N = number of samples; PSQI = Pittsburgh Sleep Quality Index; ASHS = Adolescent Sleep Hygiene Scale.
It was confirmed whether the two latent classes identified within the GSQ group were statistically different on the sleep hygiene subscales. Therefore, Class 1 was labeled as the Good Sleep Environment and Daytime Sleep Hygiene Group, and Class 2 was labeled as the Bad Sleep Environment and Daytime Sleep Hygiene Group. Radial plot of item response probability for each response in the sleep quality group.
Radial plot of the item response probability for each response in the average sleep quality group. Radial plot of the item response probability for each response in the Poor Sleep Quality group. In the Good Sleep Quality (GSQ) group, two types of Good SEDH and Poor SEDH were identified.
The Middle Sleep Quality (MSQ) group was identified as three types: Poor STH, Good STH and CPH. Descriptive statistics between two latent types in Middle Sleep Quality Group Bad STH a Good STH b CPH c. It was confirmed that the Poor Sleep Quality (BSQ) group was divided into three types: Good CESH, Poor STH and Poor SEDH.
Descriptive statistics between two latent types in the group of poor sleep quality Good CESH a Poor STH b Poor SEDH c.
Discussion
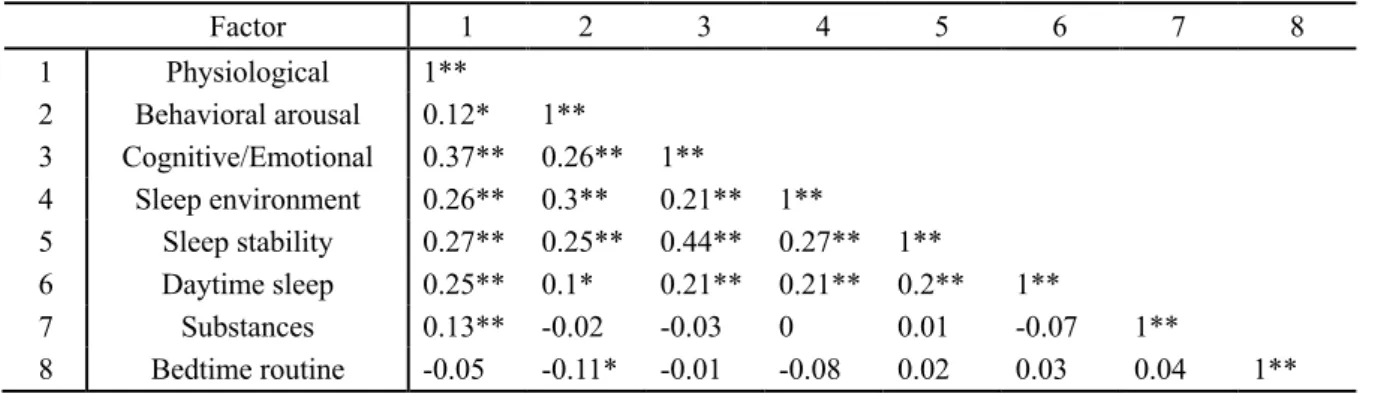
Accordingly, it was confirmed that there was a very high correlation of 0.5 and 0.58 between the sleep hygiene of cognitive/emotional and sleep stability, respectively, which were the criteria for dividing the three groups. In Part 1, although the latent classes were identified as an indicator of sleep hygiene for all subjects, it was confirmed that the sleep quality level was statistically significantly distributed into the upper, middle and lower levels. Therefore, in this study, Part 2 was conducted precisely to confirm whether the latent types of sleep hygiene would show a similar context to the results of Part 1 at the level of sleep quality, divided into the upper, middle and lower levels. .
In other words, the Good SQ group had good sleep quality and sleep hygiene, while the Bad SQ group had poor sleep quality and sleep hygiene. Therefore, a latent class analysis was performed in each of the three subgroups to find out in more detail what the sleep hygiene subscales show according to the sleep quality level. As a result of confirming the latent types of sleep hygiene according to the sleep quality level, a total of 8 latent classes were derived.
It was confirmed that each latent class derived within the high, medium and low sleep quality groups showed different patterns in 8 sleep hygiene subscales. These results suggest that even at the same sleep quality level, there may be different problems between subjects in terms of sleep hygiene. Unlike the results of Part 1, Part 2 confirmed that sleep hygiene can be very good even if sleep quality is poor.
Indeed, this type showed similar levels of sleep hygiene to the two latent types of good SQ groups (Appendix). It was also divided into two types in the Good SQ group, but it was shown that even if the quality of sleep was good, some sleep hygiene may have problems. Third, it is significant in that it examined the relationship between the subscales of sleep hygiene and sleep quality by simultaneously considering the aspects of those two for sleep problems.
In addition, the potential relationship between sleep hygiene and emotional and university-related factors was identified.