
1. The Result of Pre-test Score a. The Result of Pretest Score of Experiment Class - The Effect Of Picture Crossword On English Vocabulary Size At Seventh Grade Students Of MTsN Katingan Tengah - Digital Library IAIN Palangka Raya
Teks penuh
Gambar
Dokumen terkait
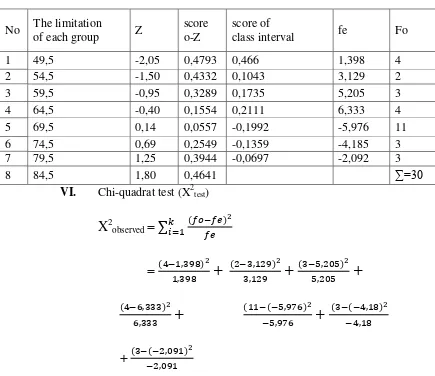
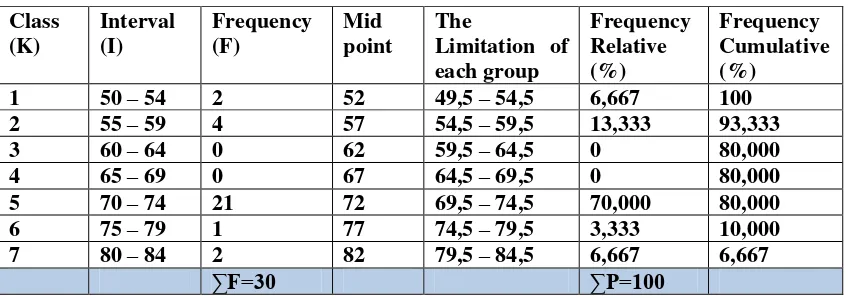
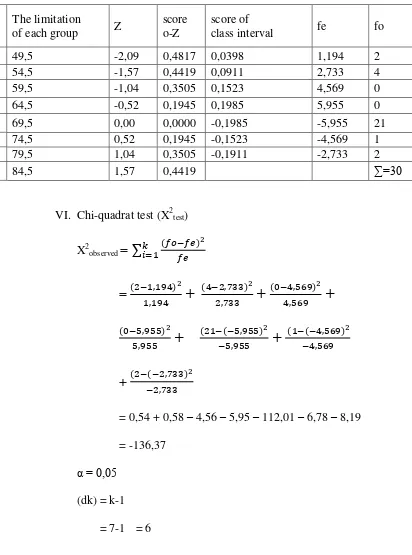
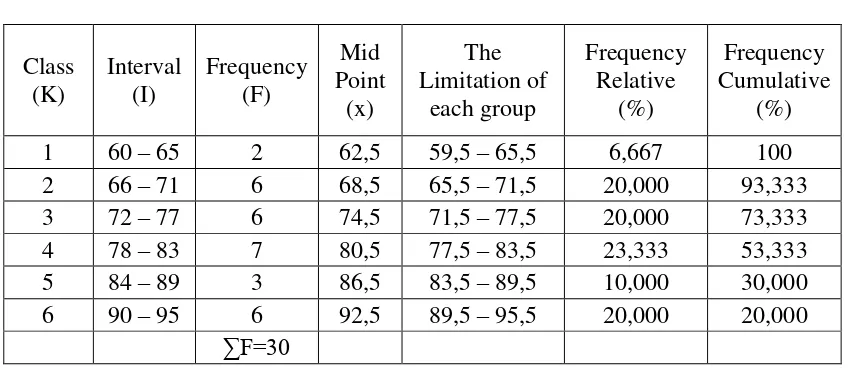
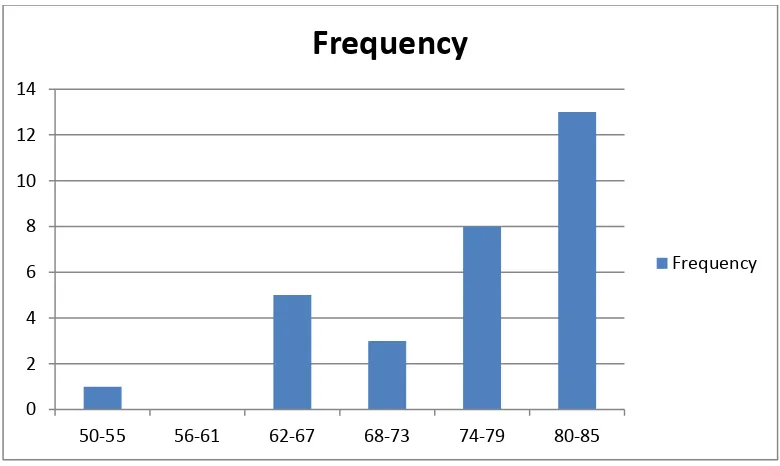
To determine the frequency of score, percent of score, valid percent and cumulative percent calculated using SPSS 16 (see appendix 7). The distribution of students’ pre
Hasil dari Pengujian Hipotesis menentukan bahwa Hipotesis Alternatif (Ha) yang menyatakan bahwa mengajar kosa kata menggunakan teka teki silang bergambar memberikan
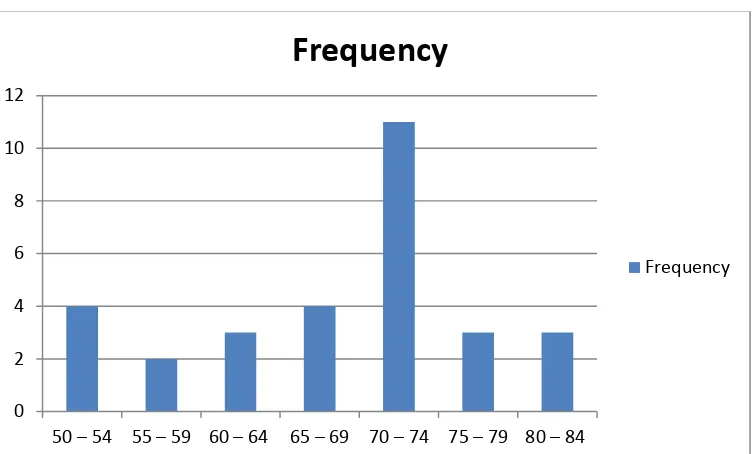
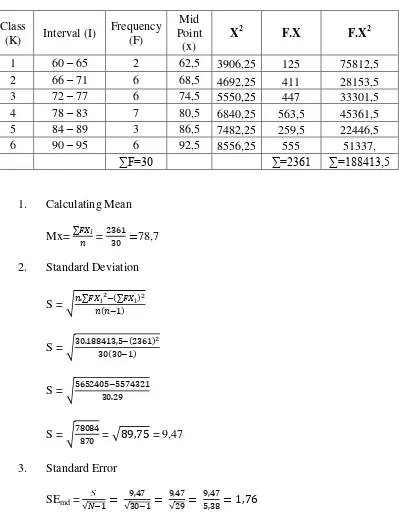
The next step, the writer calculated the scores of mean, median, mode, standard error of mean, and standard deviation using SPSS 21 program as follows.. 0 5 10 15
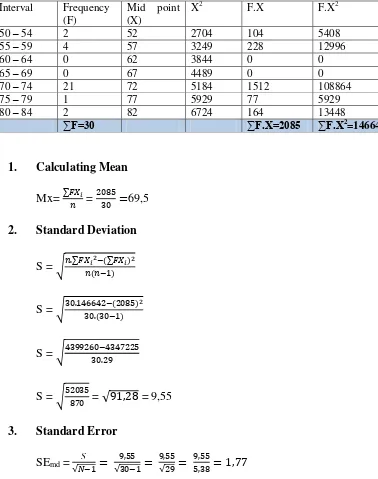
The next step, the writer calculated the scores of mean, standard deviation of mean of pre-test in experiment class using SPSS as follows: Table 4.6 The Table of Calculation of Mean,
Table 7 The Mean, Standard Deviation, and Mean Score Interpretation for Each Category CATEGORY MEAN STANDARD DEVIATION INTERPRETATION Instructional Content 4.43 0.7279
FIGURE 3 FIGURE SHOWING THE MEAN OF NORMAL ATHLETES AND ATHLETES WITH DISABILITIES FOR SELF CONFIDENCE TABLE 4 CALCULATION OF MEAN, STANDARD DEVIATION, STANDARD ERROR, OF MEAN,
The Mean Score and Standard Deviation of the Students’ Pre-test and Post Test Test Mean Score Standard Deviation Pre-test 42.3 13.405 Post-test 69.1 8.913 Based on the table
The Mean Score and Standard Deviation of the Students’ Pre-test and Post-test Mean Score Standard Deviation Pre-test 2,95 0,72 Post-test 3,38 0,91 Table 4 shows that there was the
