However, there is a high possibility that the outbreak of dengue fever will occur in Korea within a few years since global warming is accelerating and the medium mosquitoes for dengue fever also live in Korea. The aim of this study is to predict how many patients will occur when there is an outbreak of dengue fever using climate change scenario.
Introduction
Background of research
Likewise, if the level of humidity is high, the number of reproduction of mosquitoes increases as well as their life span. Therefore, if the average temperature and relative humidity generally increase due to global warming, the active period or life span of mosquitoes will be longer than before, increasing the number of mosquitoes and consequently the number of human contacts.
Research objectives
They move actively and the rate of development from a larva to an image also increases.
Existing research
Mathematical models for epidemic
The SIR epidemic model
Mathematically, each compartment can be expressed depending on the size of the time from time. The number of people in each of the compartments, approximately a differential coefficient of the size of each compartment, is taken as the distinguishable function.
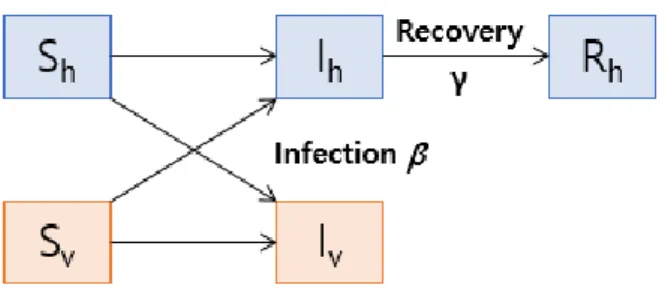
The basic vector-host model
In the same way, susceptible vector becomes infected vector at a rate 𝛽𝑆𝑣𝐼ℎ through contact with infected host. This basic model can be extended by a different form taking into account pre-adult mosquito or the addition of another compartment in SIR model for host.
Application: Epidemic models for dengue fever caused by global warming in Jeju Island
Research material
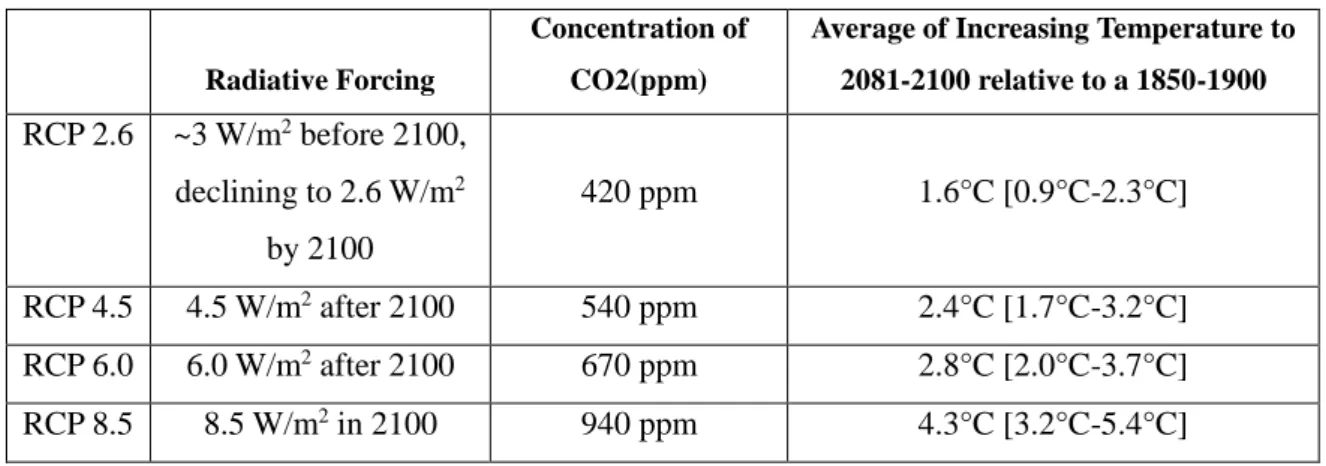
The latest climate change scenario chosen by the Intergovernmental Panel on Climate Change (IPCC) for its Fifth Assessment Report (AR5) is RCPs characterized by radiation, a measure of energy, absorbed and retained in the lower atmosphere. The RCPs are divided into one mitigation scenario (RCP 2.6), two medium stabilization scenarios (RCP 4.5, RCP 6.0) and one high emissions scenario (RCP 8.5). In this study, the daily average temperature, relative humidity, evaporation, precipitation, and dew point data of Jeju Island based on RCP 8.5 are used to express several parameters that affect mosquitoes, such as oviposition rate, mortality rate, virus incubation rate, and maturation in built-in functions.
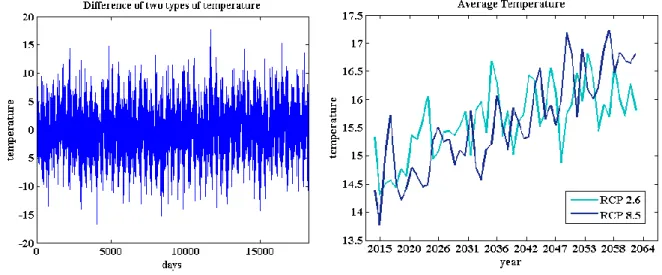
RCP 8.5 is chosen to take the major impact on the disease outbreak. Figures 3.1 and 3.2 show the change of temperature and mean temperature data based on RCP 2.6 and 8.5 for 50 years. According to the above results, the difference of the two average temperature values is about 0.5°C, and it is easy to find that the temperature based on RCP 8.5 is relatively higher than that based on RCP 2.6.
Although other things are not apparent from the above graphs such as highest and lowest temperature, the highest temperatures are 30.98°C and 30.23°C, the lowest temperatures are -3.41°C and -3.21°C corresponding to RCP 8.5 and RCP 2.6, respectively.
Research methodology
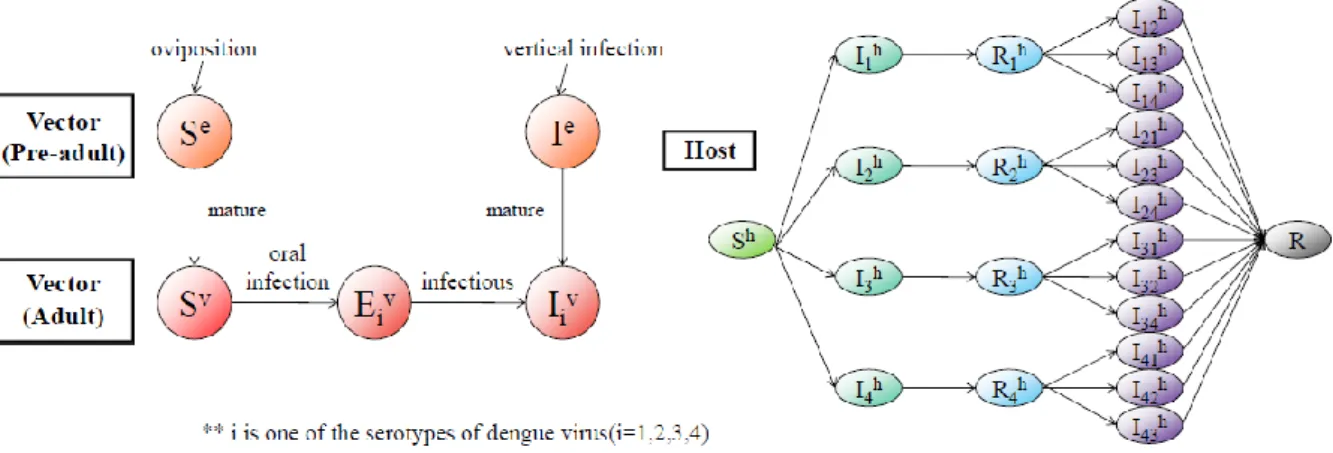
In this study, the phenomenon of dengue infection was demonstrated through the first and second infection models. In mosquitoes, the SI model was used to express the first and second infections at the larval stage and the SEI model for the images. For the human cases, the SIR model was used for the first infection and the SIRIR model for the second infection to express the infection among humans.
In creating the simulations, two types of mathematical models were performed, assuming that the first occurrence of dengue fever is January 1, 2014 as the initial condition. The calculations and results of the two models and two types of methods were compared and analyzed to predict the month with the highest number of patients, the estimated highest number of patients, and the estimated number of fatalities.
Mathematical models for dengue fever
- Primary infection model
- Secondary infection model
- Two strains model
In this primary infection model [8], it is assumed that the three population types, human, pre-adult mosquito and adult female mosquito, are taken into account, and the specific of the serotypes plays a significant role as a key factor influencing the spread. of this disease. Thus, it is necessary to formulate the secondary infection model to deal with the dynamics of dengue fever in more detail. When 1, there is an amplification of secondary infection relative to primary infection, but a reduction occurs when 1.
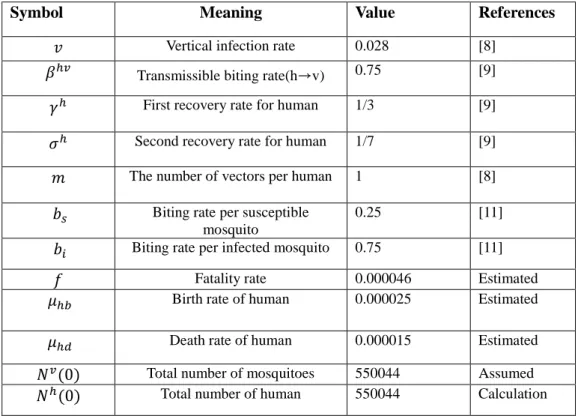
This model involves other three parameters related to mosquitoes that are not included in the primary infection model, such as the frequency of infected mosquito bites 𝑏𝑖, the frequency of susceptible mosquito bites 𝑏𝑠 and the number of mosquitoes per bite. host 𝑚. On the other hand, the two parameters that are not included in the primary infection model, 𝛾ℎ and 𝜎ℎ, are the first recovery rate and the second recovery rate, respectively. This model is described by ODEs that describe the transition of primary infection with strain 1 and secondary infection with strain 2 as follows.
Noting the subscripts where 𝑖 = 1 and 2 means primary infection and 𝑗𝑖, 𝑗 = 3 − 𝑖 is secondary infection.
Parameters
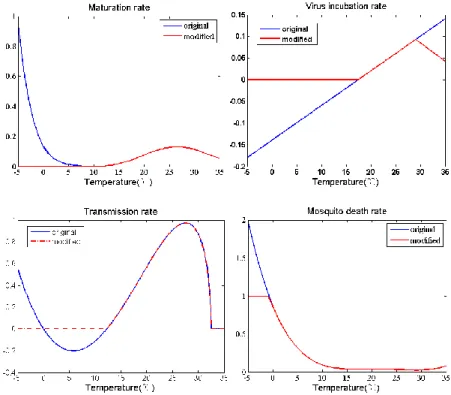
For example, define that 𝑃 are temperature-dependent parameters and that temperature 𝑥(𝑡) is a function of time 𝑡, then 𝑃 can be expressed by 𝑃 = 𝑃( 𝑥(𝑡)). The entomological parameters, including maturation rate, virus incubation rate, and mortality rate, are estimated using three fitting functions, which depend only on temperature [8,10]. So there are no experimental data on mosquitoes at winter temperatures, not even below 10°C. The red lines and the green line in Figure 3.6 show the values of modified parameters for the fitted function in the interval -5°C < 𝑥 <35°C.
Since the incubation rate of viruses has a linear function, it has a value of minus at less than 10°C and it is not reasonable to have a high value above 29°C. The egg-laying rate of mosquitoes 𝑏𝑣 is expressed as follows using the concept of moisture index, which is defined as the difference in precipitation and evaporation (mm) during the previous 7 days. The parameter 𝑏0 represents the basic egg laying rate, which is the value of multiplying the mosquito mortality rate by the total number of mosquito populations, in order of conservation of the total population.
The egg-laying rate in Figure 3.7 (e) increases around June and July during the rainy season.
Results and analysis
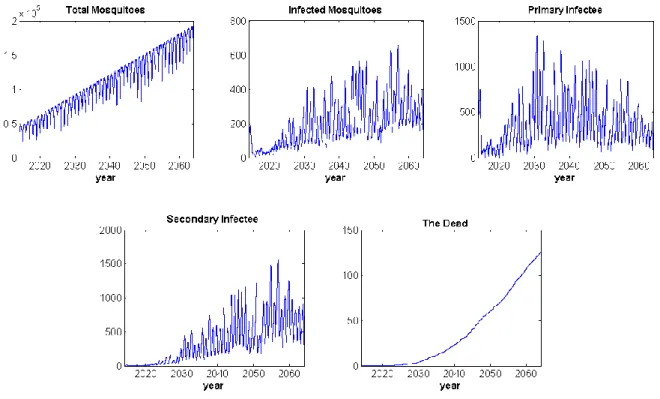
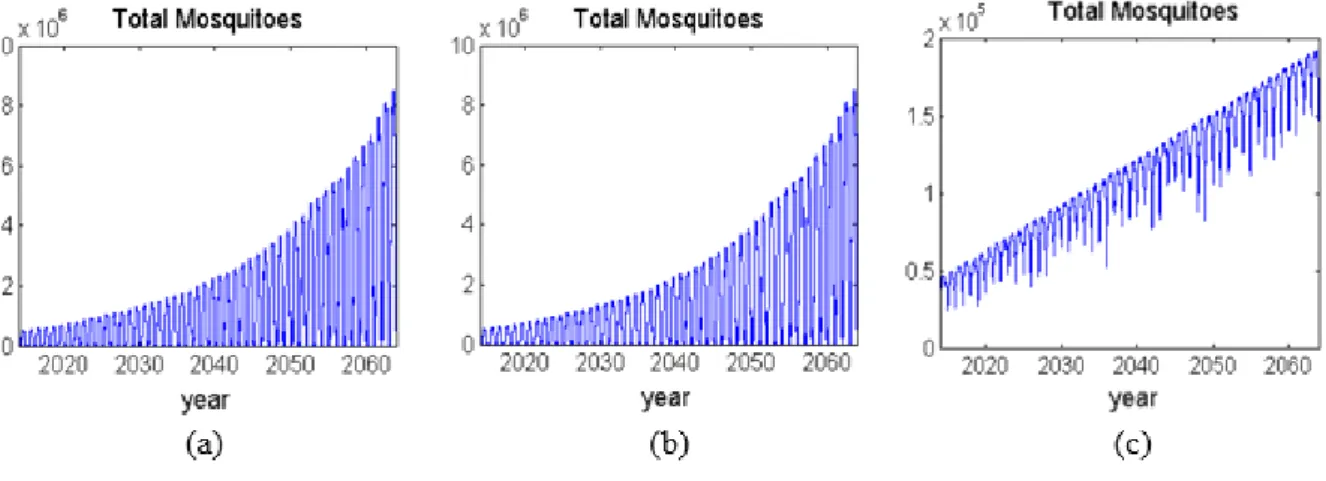
The following Figures 3.10 (a) and (b) present the results of simulations using four seasons of data for models of secondary infection with four serotypes and two strains, respectively. The total number of mosquitoes in the case of simulation results based on non-winter climate data shown in Figure 3.10 (c) increases rapidly than other simulation results. In the case of the last result, which is shown in Figure 3.11 (c) for using only summer data, the number of infected mosquitoes also tends to increase.
In Figure 3.12 (a) and (b), the number of primary patients for the two-strain model tends to decrease faster than the four-serotype model, since this model only considers two strains, so they develop immunity a little faster. After other major outbreaks, which can be seen in Figure 3.13 (a) and (b), a large number of patients have recovered by then and have immunity, so a small scale outbreak occurs next time. On the other hand, in the latest simulation results with summer data shown in Figure 3.13 (c), there is no dormant phase for disease occurrence.
As these results are accumulated for the number of deaths, it is shown that death from this disease occurs continuously.

Discussion and Future work
In general, the stochastic model could give more accurate results than the deterministic model with good noise representation. Otherwise, a stochastic model is often more appropriate than a deterministic model when the population size is relatively small. A stochastic model for dengue fever based on the direct Gillespie algorithm whose basic ideas are i) when does the next reaction occur ii) which reaction occurs after a calculated time interval tau.
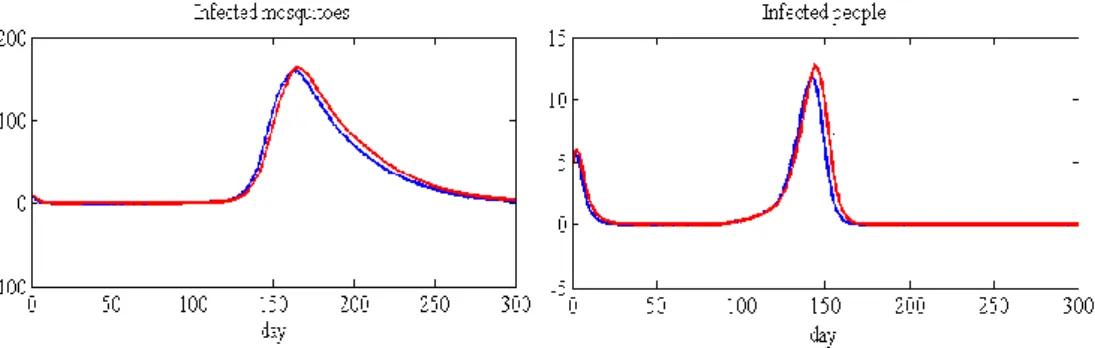
In the graphs shown in Fig 4.1, the blue line is the solution obtained by the deterministic methodology and the red line is the one obtained by the stochastic methodology. These values for the difference are shown in Table 4.1 The relatively small population and initial conditions give us a significant difference between the two models. This means that the stochastic characteristics of this disease are not reflected in this approach.
In fact, if the difference is relatively large, it can be known that the stochastic model is suitable for this disease.
Conclusion
Using this method, the probability of dengue extinction can also be estimated taking into account climatic factors. Since dengue fever has not erupted or naturalized in Korea so far, it is not clear whether the aspects of the dengue outbreak in Korea are similar to the results of this study. However, by examining the peak baseline of dengue patients, we can evaluate the simulation results of this prediction model suggested by this study.
Moreover, when we compare this model with actual outbreak cases and have the validity of the results of this study, we can apply it to the other areas where dengue fever is more likely to occur in Korea. Finally, due to the application of this mathematical model developed by this study, dengue fever patients were found most often in summer, between July and August, with high temperatures and relatively abundant precipitation. Interestingly, it was found that there are more patients over time, which may indicate the naturalization of this disease in Korea. Further studies should be continuously conducted on other types of mathematical models to prevent the outbreak of dengue fever and to identify and evaluate various national disaster strategies against pandemic diseases, and when the effect and cost of such a government counter-strategy is mathematically analyzed and investigated, we can more effectively prevent and control such epidemics as dengue fever.
Hii, Climate and dengue fever: early warning based on temperature and rainfall (Doctoral dissertation), Umeå University (2013).