The percentage distribution of items per unit H2 production cost by PEM water electrolysis for green H2 production with electricity generated from (a) solar PV, (b) onshore wind, and (c). Economic forecast analysis of green H2 production using electricity generated from (a) solar PV, (b) onshore wind, and (c) hydropower with 100% of H2 production from water electrolysis.
Introduction
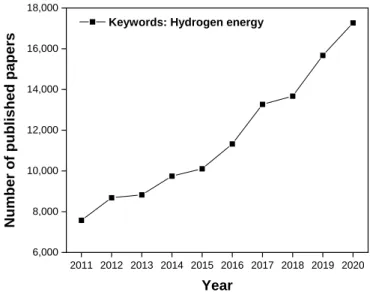
Why is green H 2 important?
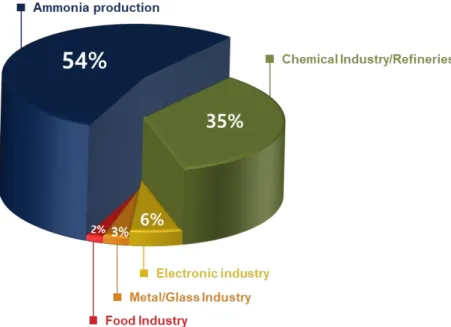
However, the majority of international H2 production methods are methane steam reforming (MSR), which is responsible for about 50% of one, as shown in the figure. Here, the four types of H2 are classified into methods and sources of H2 production and are distinguished by color as shown. in fig.
![Fig. 2. Global H 2 demand [6]](https://thumb-ap.123doks.com/thumbv2/123dokinfo/10493676.0/17.892.217.698.508.852/fig-2-global-h-2-demand-6.webp)
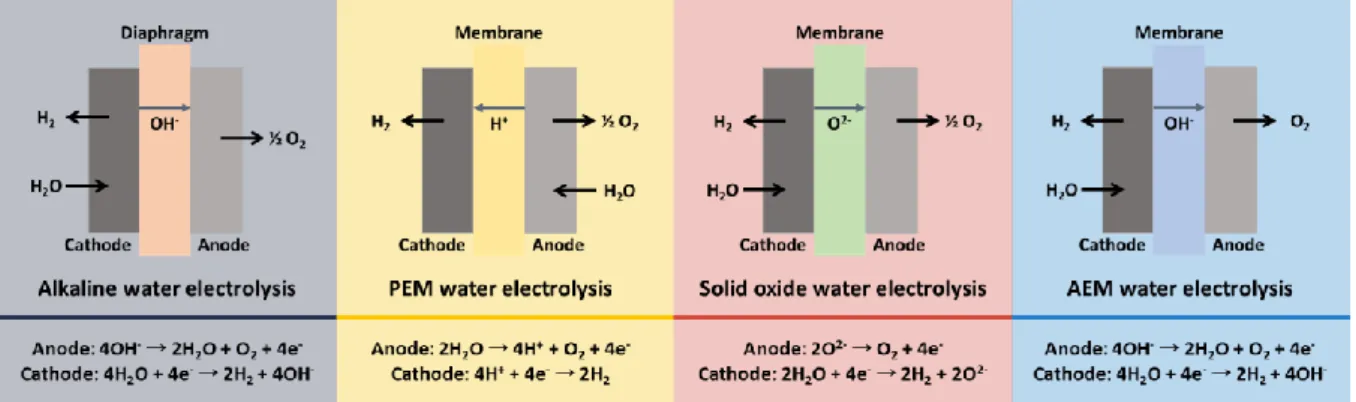
Water electrolysis type
PEM water electrolysis is the secondary technology matured with the use of IrO2 and black Pt for. In this paper, PEM water electrolysis is more suitable for green H2 production than other technologies, because this technology that uses non-sustainable electricity produced by renewable energy sources is covered.
![Table 1 Technical features for four water electrolysis types [10,11]](https://thumb-ap.123doks.com/thumbv2/123dokinfo/10493676.0/21.892.115.788.167.804/table-technical-features-water-electrolysis-types-10-11.webp)
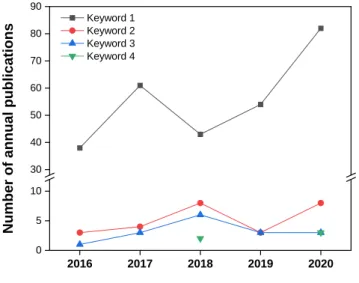
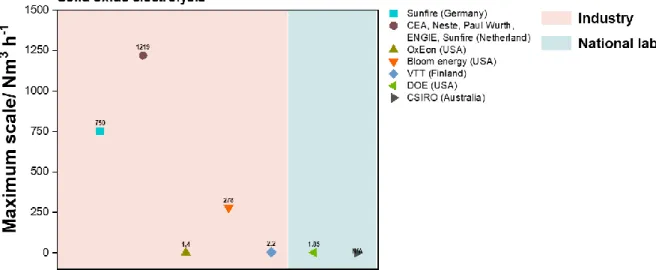
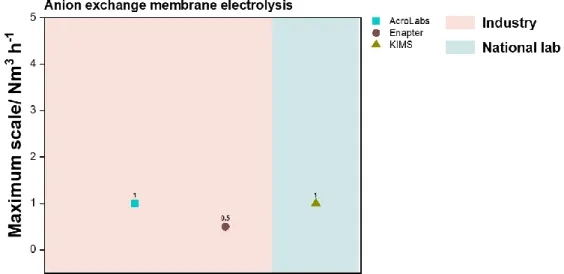
Literature survey on water electrolysis technology
Perform an economic and environmental assessment for PEM water electrolysis considering the replacement torque and different renewable energy sources. Therefore, PEM water electrolysis was chosen for green H2 production due to several inherent advantages of PEM water electrolysis and the potential for scale-up.
Renewable energy source
Through Fig.14, the levelized cost of electricity (LCOE) produced by renewable energy sources will be expected to decrease corresponding to the projected capacity increase. In this context, green H2 production including renewable energy storage is at the center of attention to achieve zero CO2 emission in the entire energy sector, as well as to understand the big problem of renewable energy.
Techno-economic and environmental assessment
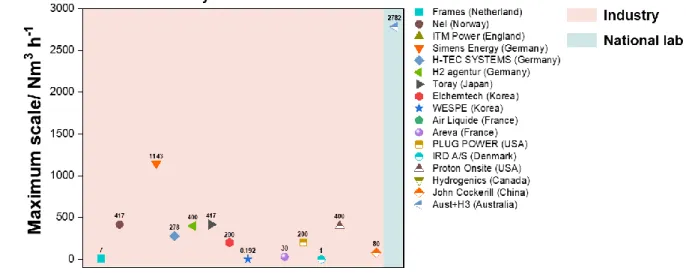
Hamacher, Life cycle assessment of hydrogen production from proton exchange membrane water electrolysis in future energy systems, Applied Energy. 17] https://www.jinglihydrogen.com/water-electrolyzer/water-electrolyzer-dq1000.html [18] http://www.verdellc.com/JProduct.asp. 20] http://www.teledynees.com/our-products/hydrogen-oxygen-generation-systems/titan-el [21] https://nexthydrogen.com/products/.
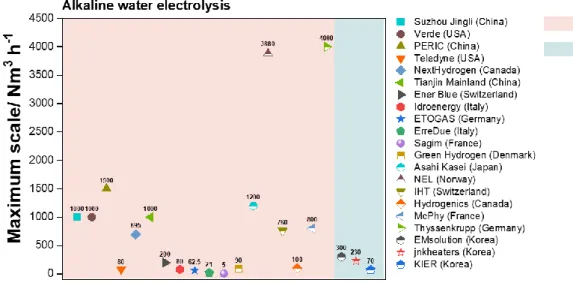
29] http://www.h2news.kr/news/article.html?no=8206 / https://www.internationales- verkehrswesen.de/worlds-largest-single-stack-alkaline-water-electrolysis-system/ . 31] http://www.iht.ch/technologie/electrolysis/industry/high-pressure-electrolysers.html [32] https://etipwind.eu/wp-content/uploads/A2-Hydrogenics_v2.pdf. 41] https://new.engineering.com/story/siemens-to-build-huge-green-hydrogen-production-facility-in- Germany.
47] https://www.businesswire.com/news/home en/Air-Liquide-Invests-in-the- World%E2%80%99s-Largest-Membrane-Based-Electrolyzer-to-Develop-Its-Carbon -Pa-Hidrogjen- Prodhim.
Techno-economic assessment
Process description
After the PEM water electrolysis system, H2 is produced from cathode fed into the separator to obtain high purity H2. From the process model, the effect of current density and selective area (i.e. technology development) on H2 production rate as well as the required energy was confirmed.
Economic analysis
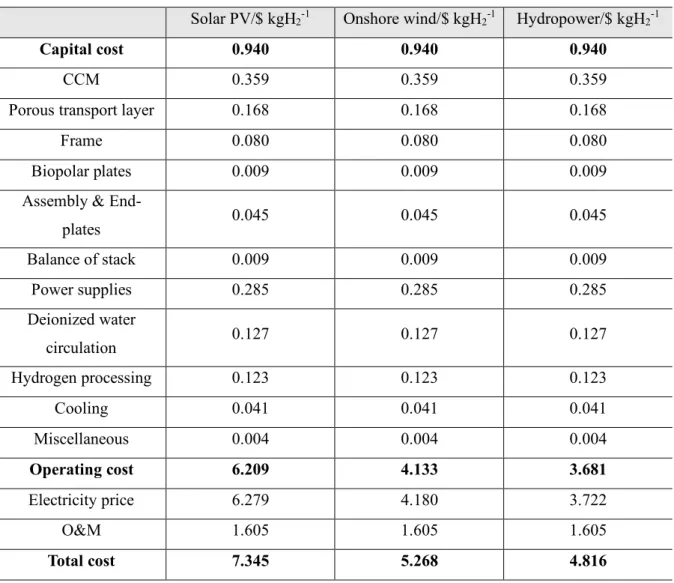
- Capital cost
- Operating cost
- Unit H 2 production cost
- Sensitivity analysis
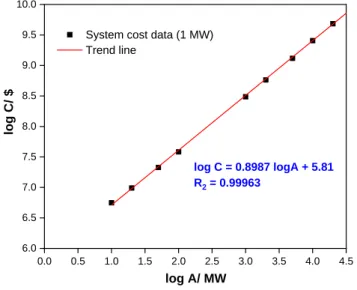
In this work, PEM water electrolysis systems with 10 MW capacity were considered for green H2 production at the current level. Operating costs are electricity price, which corresponds to the amount of electricity required for the PEM water electrolysis system, and operation and maintenance (O&M) costs. 18 presents the computational slope to obtain cost exponents for PEM water electrolysis systems with 1 MW capacity, through the trend line.
Here, the durability of 7 years and 10 years for PEM water electrolysis systems in the present and future, respectively, is considered. The change in PEM water electrolysis system costs over time was estimated with an inherent experience rate according to the increase in global H2 demand in the future (Equation 8–10). Although water electrolysis accounts for only 4% of the global H2 production method as shown in Fig.
Based on the capital and operating costs for green H2 production with a PEM water electrolysis system using electricity generated from solar PV, onshore wind, and hydropower, the unit cost of H2 production was calculated in Equation 15.
Life cycle assessment
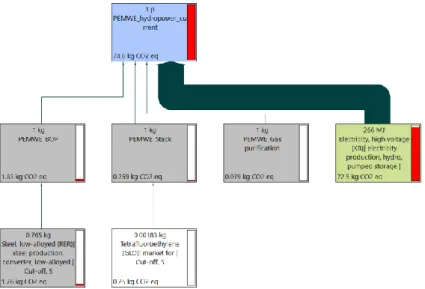
The second is life cycle inventory analysis to collect material input and output data for green H2 production by PEM water electrolysis system and environmental impact data through Ecoinvent 3 database, using SimaPro, which is one of the powerful life cycle assessment software tools . Here, the use of commercial software is recommended because it facilitates life cycle inventory analysis and helps to collect a lot of data necessary for obtaining the accurate life cycle assessment results. The third is life cycle impact assessment to translate the collected inventory data in step 2 into the selected environmental impacts by considering characterization factors based on each environmental impact category.
For life cycle impact assessment, there are two ways to derive characterization factors; midpoint and endpoint indicators. In particular, global warming, ozone depletion, and the formation of fine substances are selected as categories of environmental impacts because they are three impacts of quality level І, recommendations of the Joint Research Center [6]. The last is an explanation that summarizes the results of the life cycle inventory analysis and the life cycle inventory analysis.
In addition, it is possible to obtain the results of the environmental impact on the functional unit considering each characterization factor for the green production of H2 by the PEM WE system using each electricity based on renewable energy.
Analytic hierarchy process
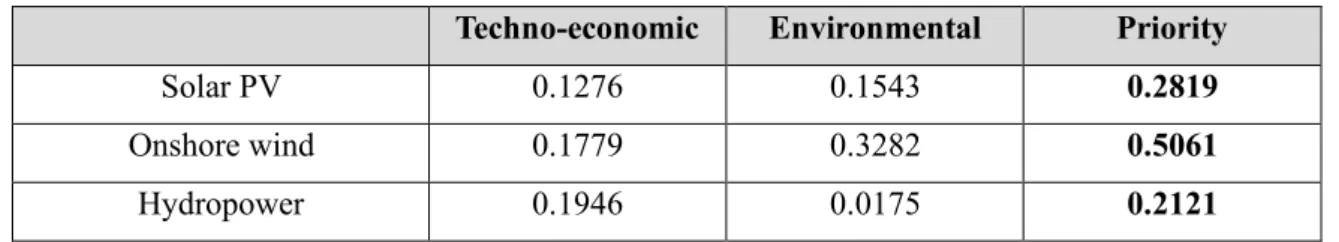
Here, higher priority means a more appropriate alternative for green H2 production in terms of techno-economic and environmental perspectives, simultaneously. Therefore, solar PV, onshore wind and hydropower were considered as alternatives, and unit H2 production cost (for techno-economic criteria) and CO2 emission for global warming (for environmental criteria) were considered with sub-criteria, with different weighted values of criteria under determination or uncertainty, to find the most suitable renewable energy source for green H2 production by PEM water. Satty, What is the Analytic Hierarchy Process?, Mathematical Models for Decision Support, Springer, Berlin, Heidelberg 1988.
Results and discussion
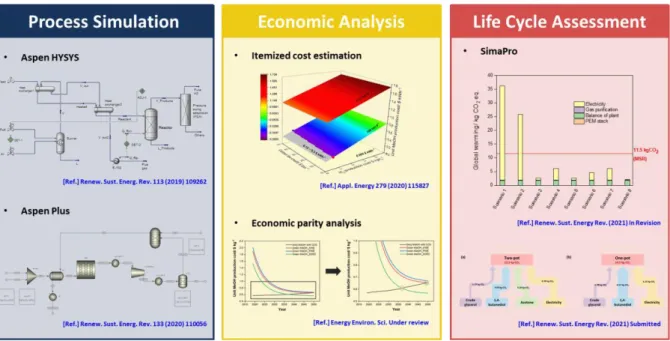
Process simulation
First, it can be clearly shown that current density has a greater influence on H2 production rates than active cell surface area, indicating that higher current density and active cell surface area can reduce the feasible H2 production cost per unit.
Economic analysis
Sensitivity analysis results on unit H2 production cost by PEM water electrolysis for green H2 production with electricity generated from (a) solar PV, (b) onshore wind, and (c) hydropower. Economic forecast analysis of green H2 production using electricity generated from (a) solar PV, (b) onshore wind, and (c) hydropower with 70% of H2 production from water electrolysis. Economic forecast analysis of green H2 production using electricity generated from (a) solar PV, (b) onshore wind, and (c) hydropower with 50% of H2 production from water electrolysis.
Economic forecast analysis of green H2 production using electricity generated from (a) solar PV, (b) onshore wind and (c) hydropower with 30% H2 production from water electrolysis. This means that a reduction in the cost of a PEM water electrolysis system has little effect on the unit cost of H2 production compared to a reduction in the price of electricity. In addition, an economic parity analysis of green H2 production by PEM water electrolysis using electricity generated from solar PV with 100% H2 production from water electrolysis was performed, and Fig.
Economic parity analysis of green H2 production using electricity generated from solar energy based on expected gray H2 production costs.
Life cycle assessment
34, around 2040, H2 parity will be reached when the level of PEM water electrolysis system technology is at the current level, due to the lower LCOE compared to now, although the cost of PEM water electrolysis system and energy required is higher. On the other hand, H2 parity may occur in about 2025 and 2024, for cases 2 and 3, respectively, if the PEM water electrolysis system technology is developed at the future level, which is covered in this work. Therefore, it can be concluded that green H2 will be fully exploited as the promising energy carrier in the future, in terms of the economic aspect, if the technology of PEM water electrolysis system is developed and the LCOE is lower due to the installed renewable energy capacity. and provide economic insights to support decision-making (such as the government's policy direction on the 'hydrogen economy').
Environmental impact of CO2 emission for green H2 production, in order of solar PV, onshore wind and hydropower, in the current level. Environmental impact of CO2 emission for green H2 production, in order of solar PV, onshore wind and hydropower, in future level. Through environmental assessment results in terms of CO2 emission, ozone depletion and particulate matter formation, the renewable energy source for electricity generation is the most.
Therefore, onshore wind and solar PV are more environmentally friendly and sustainable than hydropower from an environmental point of view, although hydropower is already recognized as the most powerful renewable energy source for electricity production in technical and economic terms, because of the bigger ones. the installed energy capacity of the hydro plant as well as the lowest LCOE at the current level.
Analytic hierarchy process
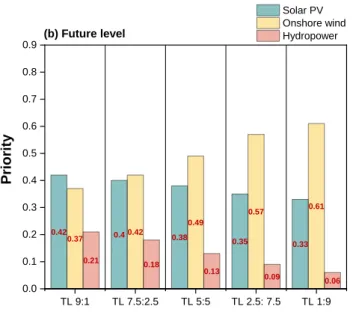
Analytical hierarchy process result for green H2 production with different weighted values of techno-economic and environmental criteria under determination at present and future level. 39 presents the AHP result for green H2 production with different weighted values of techno-economic and environmental criteria under uncertainty with distribution as shown in fig. The result of analytical hierarchy for green H2 production with different weighted values of techno-economic and environmental criteria under uncertainty based on 500 random scenarios i.
In addition, solar PV energy is the second best candidate for green H2 production in the future, due to the high solar PV cost-effectiveness, taking into account technical-economic and environmental impacts at the same time. In addition, onshore wind is a better renewable energy source for green H2 production with PEM water electrolysis system than solar PV due to higher CO2. Then, onshore wind is the best candidate as a renewable energy source for green H2 production by PEM water electrolysis, at present and future levels, in terms of economic and environmental aspects, while performing AHP with weighted values for techno-economic and environmental criteria under uncertainty .
However, the second best alternative for a renewable energy source for green H2 production needs to be changed depending on current and future levels as well as different weighted values of criteria.
Conclusion
![Fig. 3. International H 2 production methods [7]](https://thumb-ap.123doks.com/thumbv2/123dokinfo/10493676.0/18.892.235.677.134.425/fig-3-international-h-2-production-methods-7.webp)
![Fig. 13. Annual power capacity expansions on increases in renewables and non-renewables from 2001 to now [66]](https://thumb-ap.123doks.com/thumbv2/123dokinfo/10493676.0/28.892.235.629.431.730/fig-annual-power-capacity-expansions-increases-renewables-renewables.webp)
