This report will be about the Internet of Things (IoT) water quality monitoring system. In conclusion, an Internet of Things water quality monitoring system has been successfully designed and developed.
1 INTRODUCTION
Introduction to Internet of Things (IoT) Water Quality Monitoring System
The Importance of IoT Water Quality Monitoring System
Catch production reaches its peak of approx. 80 million tons in 1990, and aquaculture production supplies the additional fisheries to meet world demand. Besides that, the graph also shows that in 1990, catch production reached its peak and aquaculture production increased dramatically from 1990 to 2016.
Problem Statement
This type of monitoring systems requires the farmer to stay in the water farm and monitor the water parameters. With IoT, a farmer can monitor water quality anytime, anywhere with internet access.
Aims and Objectives
To date, many aquaculture monitoring systems have yet to be connected to the Internet. On top of that, by developing an Android Graphic User Interface (GUI) to display the processed data, it allows the farmer to view the collected data in real time and track back all the historical data for better understanding of their water farm.
Scope and Limitation of the Study
Additionally, running a fish farm can be expensive and require manpower to monitor and maintain the facilities.
Overview of Project
Introduction
The cloud server stores the data and can be analyzed and displayed through another device for the user. Both the microcontroller and the microprocessor development board have been used by various researchers around the world to collect the data and send it to the cloud.
IoT Based Water Quality Monitoring System Architecture
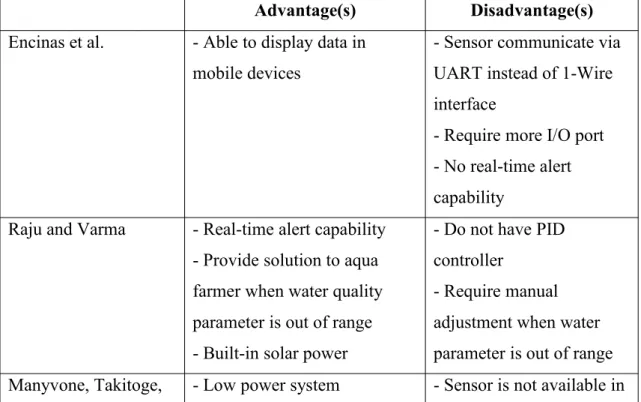
The IoT-based water quality monitoring system is the system that uses wireless technology to store the data captured by the sensors in a cloud server and user can monitor the system in real time. Raju and Varma - Real time alert capability - Provide solution to water farmer when water quality parameter is out of range - Integrated solar power.
Water Quality Parameters
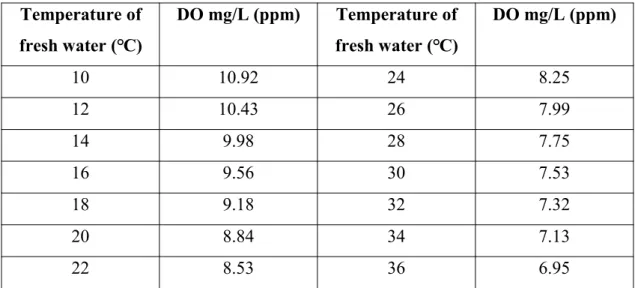
However, fish raised in an enclosed stagnant environment will experience a lack of DO in the water. In addition, the ammonia content in the water is also one of the most important parameters to be monitored.
Hardware
- Embedded Devices
- Data Transmission Protocol
- Temperature Sensor
- Turbidity Sensor
- Dissolved Oxygen Sensor
This sensor is able to measure negative pH value and has pH resolution of 0.01 pH. However, the main drawback is that this sensor is expensive. 2013) choose the pH sensor from the company called Phidgets to measure the pH value in water.
System Architecture Block Diagram
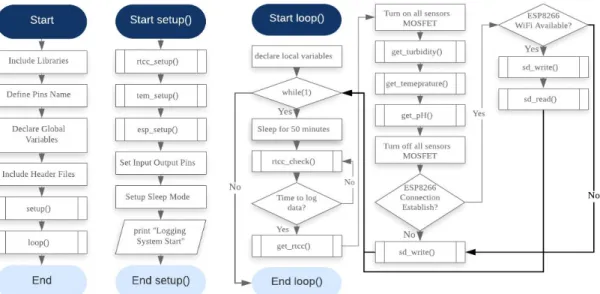
Water Quality Monitoring System Program Flow Chart
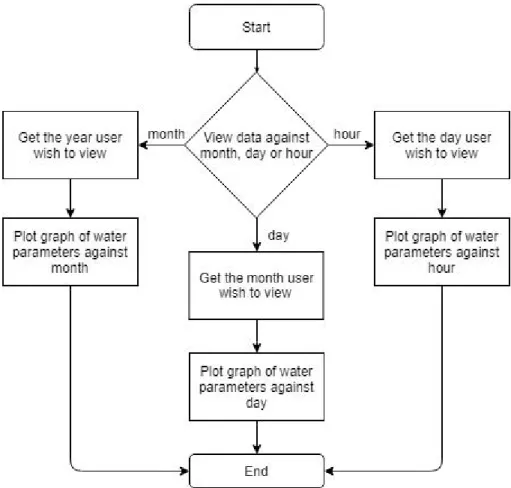
Water Quality Monitoring Android GUI Flow Chart
When the data is out of range, it will notify the user via notification window on the mobile phone. Based on Figure 3.5, when the user wants to check the water parameter at the current time or historical data, he/she can click on the mobile application.
Hardware .1 pH Sensor
- Temperature Sensor
- Turbidity Sensor
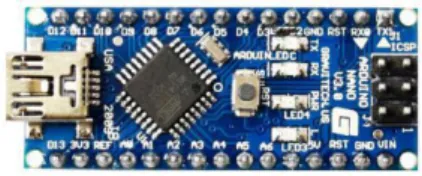
- Arduino Nano
- RTC and SD Card Shield
- ESP8266 Wi-Fi Module
In the background, the mobile app will check the data whenever new data is uploaded to the cloud. This module is used as a medium to upload data from the Arduino Nano to the cloud server.
Cloud Server
Apart from that, power via VINpin is only male to the female connector which is very loose. In the market, there are a variety of Wi-Fi modules that use ESP8266 chipset by Espressif company. This Wi-Fi module is widely used in IoT applications that use a microcontroller that does not have Wi-Fi support.
This is sufficient for the project as it only reads the data from the microcontroller through the UART pin and uploads the data through Wi-Fi.
IDE and Debugging Tool .1 Arduino IDE
- Proteus
- Android Studio
- Circuit Diagram and Pin Connection
- PCB Design
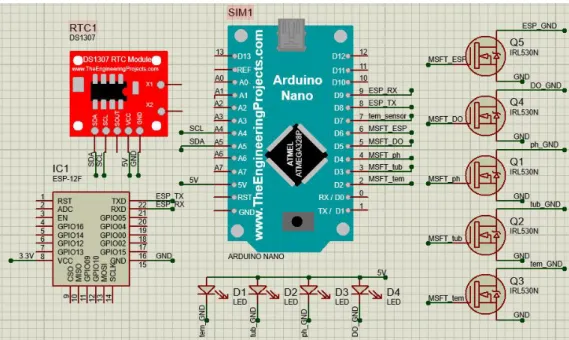
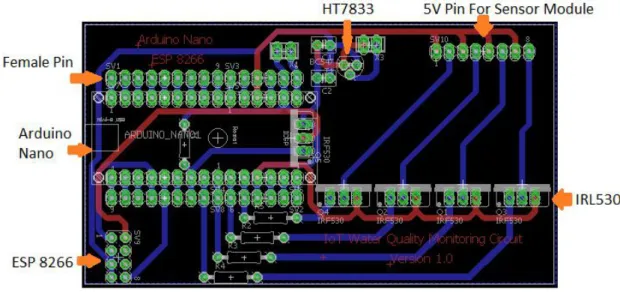
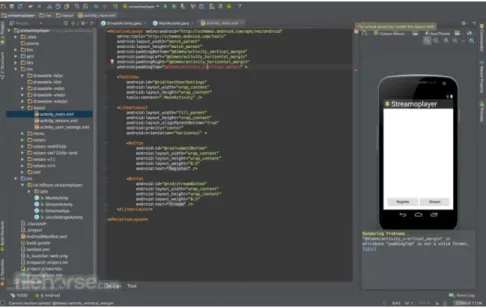
As shown in Figure 3.14, there is a simulated mobile in the IDE, the simulated mobile is used for debugging purposes. Based on Figure 4.1, ESP 8266 is replaced by ESP-12F and the whole sensor module is replaced by LED D1 to D4 as shown in Figure 4.1 for illustration. Based on Figure 4.1, the LEDs (sensor modules) for each sensor and ESP-01 are powered by IRL530N MOSFETs.
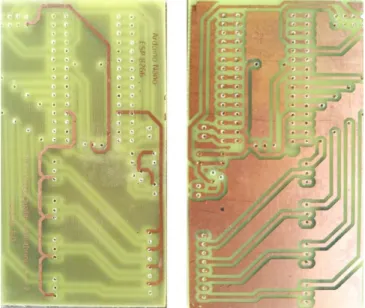
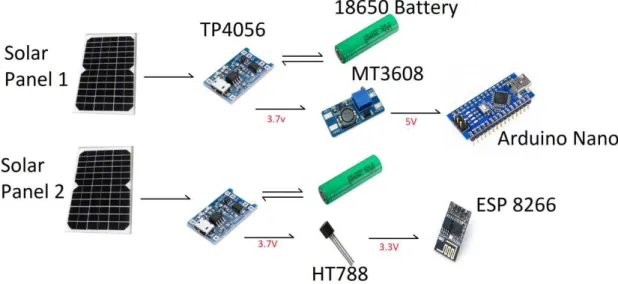
In addition, ESP8266 consumes a significant amount of power (about 300mA), which is much more than Arduino Nano and the sensor modules. In addition, the Arduino Nano is powered by a 3.7V 18650 battery through an MT3608 boost converter to boost the battery voltage. Based on Figure 4-3, the red line represents the top layer and the blue line represents the bottom layer.
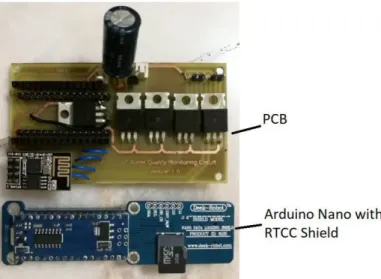
Next, Figure 4.4 below shows the top layer and bottom layer of the PCB design. Furthermore, Figure 4.5 shows the final result of the PCB with all the components soldered inside and the Arduino Nano shield placed next to the PCB.
Software Development .1 Arduino Nano
- ESP8266
- Firebase Functions
- Android Mobile Application
- Sensor Calibration
The sd_read() function is to read from the SD card and send the data to ESP8266. In addition, it is used for the firebase.upload() function to upload all data to the Firebase cloud. The Android mobile application has three pages. Figure 4.15 above shows the flowchart for the first page, the main page.
The last flowcharts shown in Figure 4.17 above are third-page flowcharts for the mobile application. The turbidity sensor is calibrated by adjusting the surface mounted potentiometer as shown in Figure 4.18 below. Based on the red box shown in Figure 4.18 above, it shows the potentiometer soldered into the sensor.
In addition, the output voltage of the turbidity sensor is read by connecting the turbidity sensor to the Arduino Nano. So, by looking at the graph in Figure 4-19, the output voltage of the turbidity sensor is adjusted to about 4.25 V in clear water, and the calculated value for NTU should be 0.
Project Prototype
- Electronics Mounting
- Solar Panel and Junction Box Mounting
- Data Storage
- Data Monitoring via Computer and Mobile Phone
- Real-Time Notification
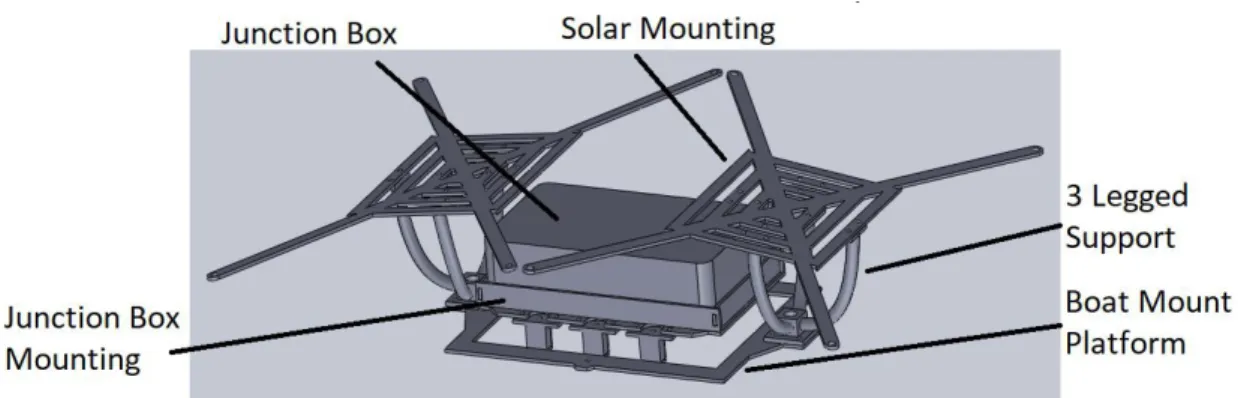
All dimensions are designed based on the size of the purchased boat so that it fits perfectly on top of the boat. Based on Figure 4.21, the junction box is designed to be mounted in the middle of the boat with both solar panels shading the mounting box to prevent sunlight from shining on the junction box which will cause heat build up inside the box. However, the 3-legged support shown in Figure 4.22 below is made of PLA material printed by 3D printer in the 3D printer lab.
To better secure the solar panel, a 10 mm aluminum shaft has also been added to the 3-leg support, as shown in Figure 4.22. Then the junction box is placed on top of the assembly and all sensors are placed in the sensor housing. Based on Figure 4-26, the nested loop is created to be easily extensible.
So the second method to monitor the water quality can be done by logging into Firebase to view in JSON format as shown in Figure 4.26 earlier. Based on Figure 4.27 above, the main page shows the latest information about the water quality parameters such as turbidity, temperature, pH and dissolved oxygen logged at a specific date and time.
Problem Encountered and Improvement During and After Field Test .1 First Location Field Test
- Additional Improvements
- Turbidity
- Temperature
By using the metal plate as the main structure of the housing, it adds a lot of weight to the front of the boat, causing the boat to sink in the front, as shown in Figure 4-32. To solve this problem, an extra float is added to the center of the boat, as shown in Figure 4-34. Based on Figure 4.35 above, the left image shows the prototype being deployed in the pond and the right image shows the solar panel placed on top of the roof.
To get a good amount of sunlight, the solar panel is removed from the boat and placed on top of the roof. During the first week, the water in the pond was quite dirty, where the bottom of the pond cannot be seen. This proves that the sensor requires more than 1 minute to capture the actual pH value of the water.
The turbidity or haze of the pond water depends on the beauty of the nearby river. In addition, Figure 4.43 below shows the color of the dam taken during the last field trip on 19 March 2020.

Conclusion
Limitation of The Prototype
The farm needs a stronger WiFi router that can cover a wider area if this system is placed in a larger farm and the prototype is far from the router. It is not able to make any future prediction for the water parameters recorded such as temperature, pH and turbidity. The aquaculture farmer cannot therefore predict what will happen to the water quality in the coming days.
The final limitation of this prototype is that the prototype can only monitor three kinds of water parameters, which is not enough for the fish farmer to better understand the water quality. Other sensors such as ammonia sensor, dissolved oxygen sensor, carbon dioxide sensor and conductivity sensor are equally important for water quality monitoring.
Recommendation For Future Work
Proceedings - 2017 International Seminar on Sensor, Instrumentation, Measurement and Metrology: Innovation for the Advancement and Competitiveness of the Nation, ISSIMM January, pp.146-149. Design and implementation of a distributed IoT system for water quality monitoring in aquaculture. Wireless and low-power water quality monitoring impact sensors for agricultural and aquaculture IoT applications.
ECTI-CON 2018 - 15th International Conference on Electrical Engineering/Electronics, Computers, Telecommunications and Information Technology, p.122–125. Design and implementation of a low-cost real-time drinking water quality monitoring system using Arduino. A water quality monitoring system using a Zigbee-based wireless sensor network. International Journal of Engineering and Technology, 9(10), pp.14–18.
Designing a Low-Cost Autonomous Water Quality Monitoring System. International Conference on Advances in Computing, Communication and Informatics (ICACCI), p. Design and deployment of wireless sensor networks for aquaculture monitoring and control based on virtual instruments. Automatic monitoring and control of shrimp aquaculture and dish fields based on integrated system and IoT. Proceedings of the International Conference on Inventive Computing and Informatics, ICICI 2017, (Icici), pp.1085–1089.
Wonderopolis, 2019. How do fish breathe underwater?[online] Available at: