There are several potential benefits of installing distributed generation units such as photovoltaic system. In addition, this paper analyzes the growth of photovoltaic systems that may attract the conflict of interests, economics and technical issues on penetration of photovoltaic system to the grid. By increasing the photovoltaic system in the grid over the years, the installation can provoke the power quality and operation issues.
Finally, it is concluded that energy flow optimization and analytical approach are used for analyzing the growth of photovoltaic systems to the grid. 44 28: Contingency mode with penetration of photovoltaic system 45 29: Part of optimization model for location and size of photovoltaic system 48.
The New Trend of Power System
2018) Moreover, this method evaluates the problem of location and the size of photovoltaic solar power system.
Problem Statement
Aims and Objectives
One hypothesis is the dispersion mode of the micro-grid energy grid system and the liberalized electricity market. The goal is to create a constitution with a competitive electricity market and a flexible "exchange" for the purchase and sale of electricity in different timeframes. Thus, the utilization factor capacity in the power grid system is easy to be managed by different competitors.
However, this is difficult to achieve with a micro-grid energy network system due to the opaque system of distributed generations and a unified power grid.
Outline of the Report
Photovoltaic System
On the other hand, it was introduced that a new innovation of photovoltaic system will bring benefit in terms of technical and economic factors.
Growth of Photovoltaic System
This article will discuss the current and future development of photovoltaic system in Malaysia to promote renewable energy sources such as solar energy in the future.
Utilization Factor of Photovoltaic System in Network
- Environmental Factor
- Economic Factor
- Power Quality Factor
- Optimal Utilization in Power Network System
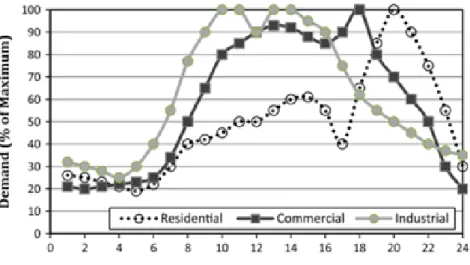
The new feature of two-way power flows in the network must be overcome by the penetration of photovoltaic system. The background for the increasing spread of solar systems can be challenges in the integration of solar systems in the electricity system. The installation of solar panels can be increased dramatically. traditional electricity production has turned into degradation.
As time goes by, large power generations and existing high voltage transmission lines will slowly be eliminated due to the proliferation of photovoltaic systems and other renewable generation systems. The goal of improving the efficiency and simplicity of implementation is to solve the optimal capacity and location of photovoltaic systems.
Summary
From the above overview, it can be seen that the genetic algorithm is a feedback loop function by providing an intelligent solution. Both discrete and continuous improvement parameters can be used (Mithulanantha, Oo, & Phu, 2004). In addition, the approach should achieve the provision of a stable value and tend to a better optimal value with fewer iterations, higher convergence speed, higher computational efficiency, and higher accuracy.
Methodology
Location to maximise reliability of power system
Optimization of power flow
The PV system must be released from the PQ bus and return to step 4 and select the next bus priority list.
Model allowable size of photovoltaic system
Flow chart
Introduction
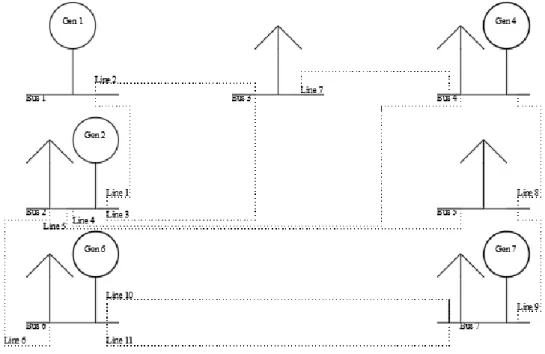
Case Information
Network equations and variables
Of the variables, only two variables are always specified and known before the study, while the remaining two variables are obtained at the end of the study. Where symbol I represents the equivalent node-injected current vector, Y is the access matrix and V is the bus voltage vector. Where Si refers to the net generation on rail i, g and d refer to the generated and demand values respectively.
Where k refers to a set of rails connected to bus i, the summation refers to the total power currents injected to the rails i. Equation for both the real and imaginary parts of (6); the following equations can be evaluated:.
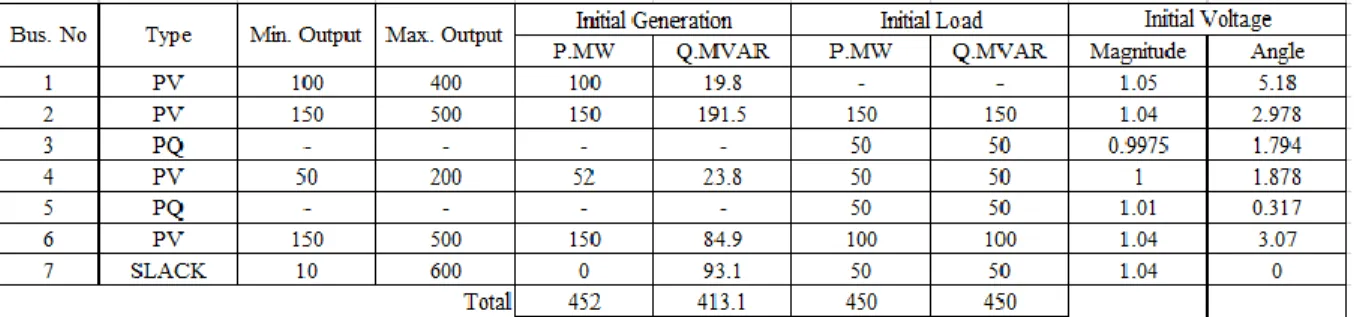
Bus specification
Optimization tool – AC optimal power flow
The cost function is only increased as a result of multiplying the fuel input by the fuel cost, the no-load cost, the minimum and maximum generation. There are several algorithms that can be used to solve the mathematical power system problem, such as the Gauss-Seidel method, the Newton-Raphason (NR) method and the Fast Decoupled (FDC) method and DC load flow analysis. The reason for choosing the Newton-Raphason (N-R) algorithm is that the merit of the operation is very fast convergence, as long as the initial prediction is very close to the solution.
This is because it can independently make a comparison between a natural and a renewable resource. The latest price of natural gas is according to Malaysia gas tariff and rates. The "L" tariff rate category is chosen because the estimated amount of production per day is approximately 28,865 MWh/day.
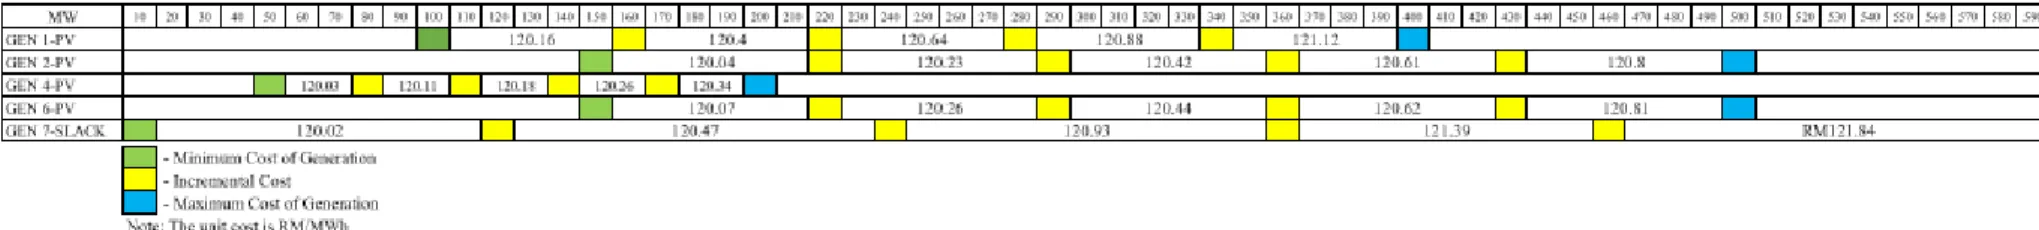
To use the optimal power flow method, the linear cost curve required that the cost function must be strictly increasing. The new fuel price is based on the current gas tariff, which is estimated at RM120.20/MWh. The original incremental gap remains the same and the linear piece cost curve is based on RM120.20/MWh based on different generators.
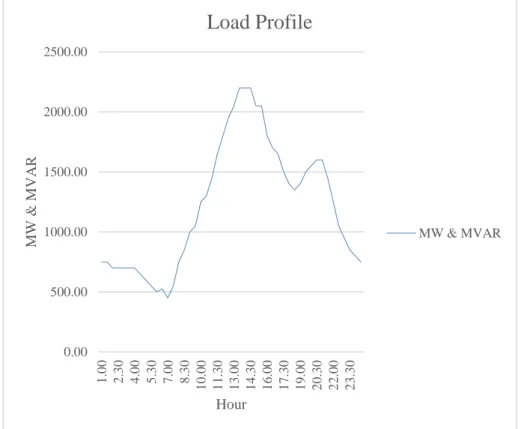
The function of optimal power flow is to select a lower rate based on demand. The project must specify a minimum of 450 MW and thus the maximum power in the network is set to 2200 MW, and then the load curve is designed according to the required minimum and maximum power. The piecewise linear cost curve function determined the cost, for example, Gen 1-PV, the minimum output as 100MW, the cost is about RM120.16/MWh.
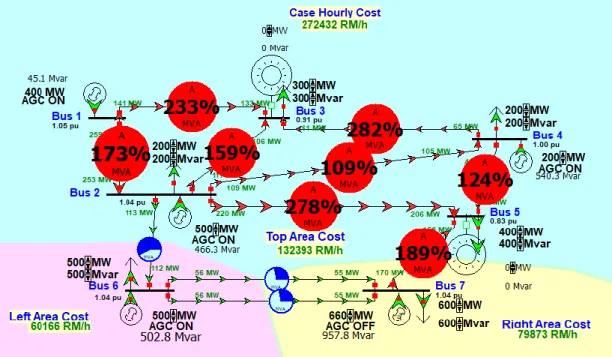
Simulation on 7 buses without photovoltaic system
Line losses
Next, the limitation of line reached the peak, except two from line 6-7 and the line appeared congestion when the load demand reached 2200MW and 2200MVAR. The utilization factor of the network will also remain the space and safety mode for contingency if any of the lines are open. In this case, N-1 way of transmission line is violated because the environmental factor is not a better solution for this.
An expected solution to solve this congestion is to place distributed generation close to the load on PQ bus 3 and 5 (Hong, T., & Burke, J.
Voltage Constraints
LOAD PROFILE vs Voltage p.u
LOAD PROFILE vs Voltage p.u
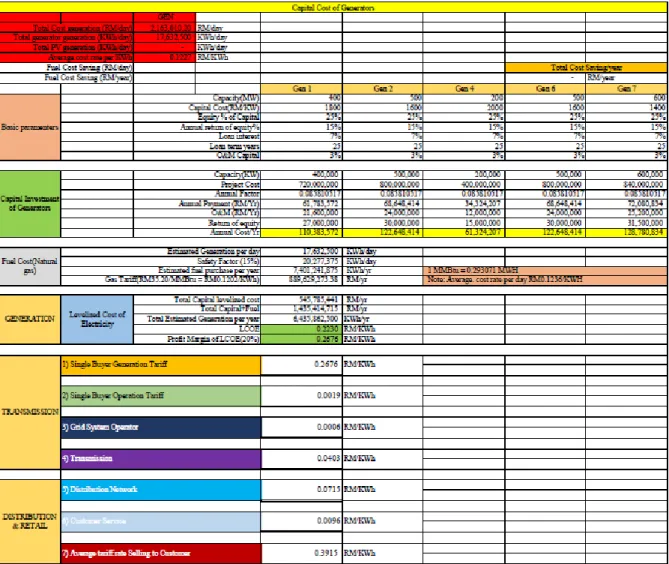
Levelized Cost of Electricity – Generators
A limitation of this section is the cost of capital due to uncertain reference data. The base tariff regulation is in accordance with the Incentive Regulation (IBR) published by the Energy Commissioner. Incentive-based regulation consists of three main mechanisms such as generation, transmission and distribution, and retail.
This mechanism is intended to manage the single buyer generation tariff, the single buyer operating tariff, the network system operators and the transmission in the electricity network. The maximum capacity of generators has the lowest cost of capital and the minimum capacity conversely has the highest cost of capital due to competitive advantage. The items such as single buyer operating rate, network operator, transportation, distribution network, and customer service remain the same as following the average rate of IBR entities RP.
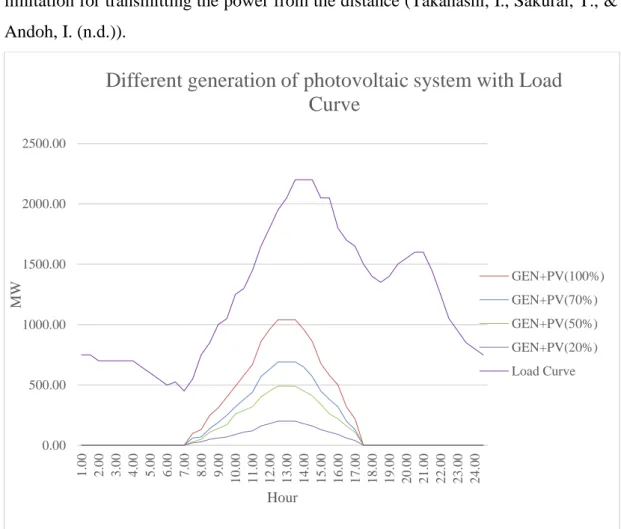
Refer to figure 17 and objective, the actual average tariff rate sold to customer is approximately RM 0.3915/KWh. The average tariff rate sold to customers is set for base rate to compare with the penetration of photovoltaic systems (Takahashi, I., Sakurai, T., & Andoh, I. On the other hand, CO2 emissions will increase if the demand for freight increases.
The voltage drop is significant if the load demand increases, especially the reactive inductive effect. The peak of load resulted in excessive line throttling and the network appeared uncertain in relation to the contingency mode. The expansion of the transmission line is no longer a good option for new route due to environmental factors.
Simulation on 7 busses with penetration of photovoltaic system
- Line losses with penetration of photovoltaic system
- Enhancement of voltage constraints
- Levelized Cost of Electricity – Photovoltaic System
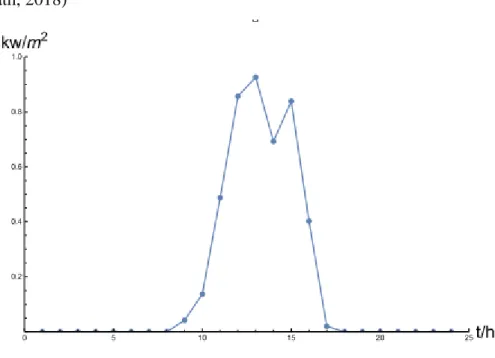
The peak generation of photovoltaic system and load curve happens to meet the intercept point during 12:30. The individual estimated generation of photovoltaic system PV 1 at PQ bus 3 and PV 2 at PQ bus 5. In order to improve the voltage profile, the maximum capacity of photovoltaic system in PQ bus 3 and bus 5 is 470MW and.
The next figure will show the total production costs with different capacities of solar panels. The result shows that GEN+PV(100%) is the lowest loss among solar plant capacity (Hong, T., & Burke, J. The average cost per KWh decreases while the capacity of solar plant increases.
Therefore, the average cost rate will decrease when the PV system capacity reaches 1040 MW. The figure below shows the savings in fuel costs with the penetration of a photovoltaic system into the grid. From the figure, it can be seen that the increased capacity of the PV system will logistically increase the fuel cost savings per day.
The basic LCOE parameter is assumed as well as the capital cost (RM/W) of the photovoltaic system. The LCOE result shows that a linear decrease in the capital cost of the photovoltaic system will also decrease the LCOE rate. 𝑃𝑒𝑟𝑐𝑒𝑛𝑡𝑎𝑔𝑒 % = Σ Subsurface Photovoltaic System Generation per day Σ Subsurface PV Generator Generation per day.
Carbon Balance
Contingency manner – Enhancement of congestion
Assessment of utilization factor in network
Conclusions
However, the cost of natural gas and the capital costs of generators and photovoltaic systems are a constraint due to currency fluctuations and a lack of interest in installation capital. Modeling the allowable size and capacity of the photovoltaic system is key to contributing the benefits of the above simulation. The limitations of this simulation are the data of the load curve, the price of natural gas, the simulation without using an energy mix and the data of the photovoltaic system.
Recommendations for future work
The value is based on the assumption that to match the competitive market price. Technologies research: The modern energy system is introduced that a non-traditional energy flow can change the power flow. The research and development of the modern power grid system will pay attention to the relevant requirements such as protection, control and instrumentation system.
An overview of the applied optimization techniques for the integration of distributed production from renewable energy sources. Optimal scheduling of distributed generation in a grid-tied microgrid via a minimum incremental cost approach' 8(3). RESEARCH PARTS IMPLEMENTATION OF CURRENT CONTROL TECHNIQUES IN ON-GRID SOLAR PHOTOVOLTAIC SYSTEMS FOR IMPROVING THE QUALITY OF ELECTRICAL ENERGY Author.
Probabilistic duck curve in high PV penetration power system: concept, modeling and empirical analysis in China. Integrated energy supply and demand planning in microgrids under uncertainty: A robust multi-objective optimization approach. A cost-effective and reliable energy management of a microgrid using intelligent demand response program.