Studies in mathematical models used in industry are very rare as people, mostly engineers are not aware of the importance of having accurate and reliable mathematical models. However, engineers need to understand the quality of the results, to be accurate, rather than correct [1]. Eykhoff (1974) generally defined a mathematical model as 'a representation of the essential aspects of an existing system (or a system to be constructed) which presents knowledge of that system in useful form' [3] .
A mathematical model of a process is a system of equations whose solution, given specific input data, is representative of the process's response to corresponding sets of inputs [4]. In industry, the engineers may use more than one model to do the analysis, as most of the systems are complicated and require accurate results. To simplify the method of reliability analysis, the easiest way is to evaluate the variance of the scores.
In a probability study, the variance is a measure of the spread or distribution of a set of scores;. Through this project, a mathematical model from the PID controller will be used for the analysis of reliability. The PID controller was chosen as it is basically widely used in most industrial processes; it has been used successfully for over 50 years and is used by more than 95% of factory processes.
It is a robust and easy-to-understand algorithm that can provide excellent control performance regardless of the various dynamic characteristics of the process plant [12].
![Figure 1.1 [10] below shows a block diagram of combination of proportional, integral and derivative modes in the process plant which represent the PID controller in general](https://thumb-ap.123doks.com/thumbv2/azpdforg/10256782.0/7.918.177.784.716.994/figure-diagram-combination-proportional-integral-derivative-represent-controller.webp)
RESULTS AND DISCUSSION
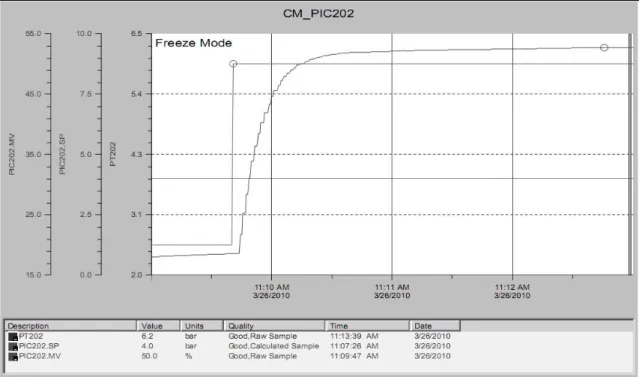
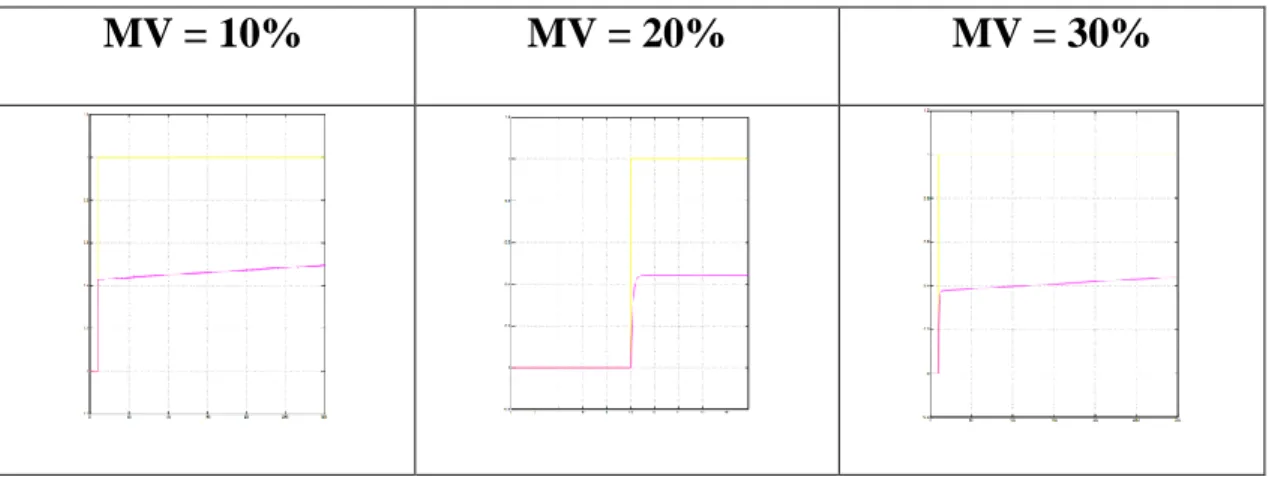
Process Reaction Curve of PID Pressure Control
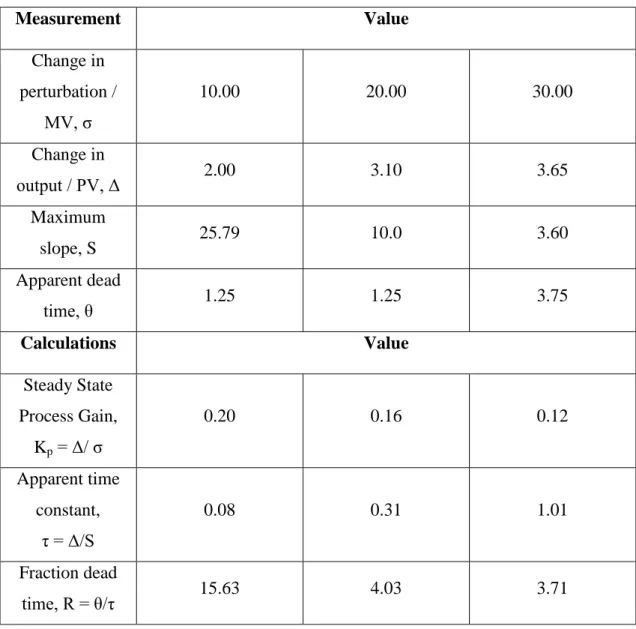
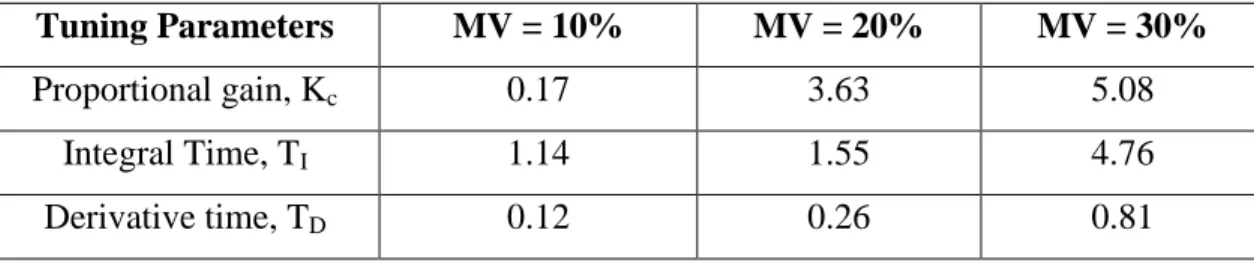
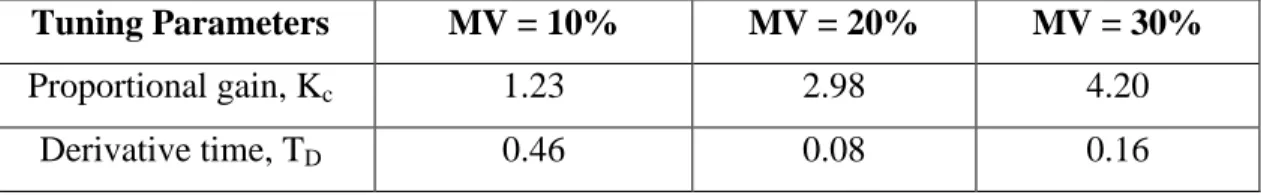
Based on the data in the table, PID pressure controller parameters can be identified using the Cohen-Coon Open Loop correlations (see Appendix C) for each experiment, MV = 10% to MV = 30%. All these parameter values have been used in the PID pressure control installation and the actual response has been recorded.
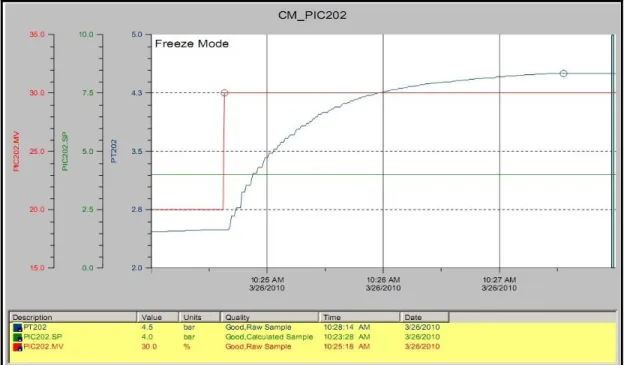
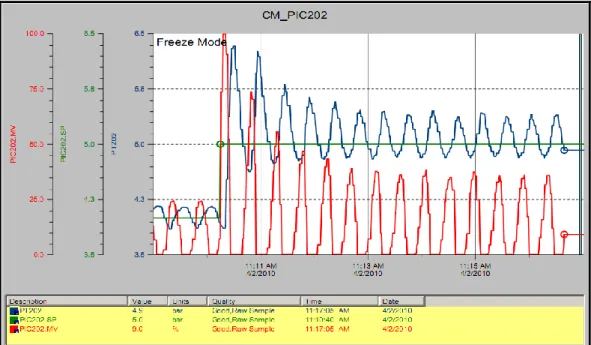
Actual Response of PID Pressure Control
Referring to the methodology of this project, this actual response from PID Pressure Control will be compared to a simulation response from Matlab Simulink.
Simulation Response of PID Pressure Control
Since all the simulation response of PID controller is obtained for PID pressure control, a comparison between actual and simulation response will be done. In this experiment, four types of PID control modes were selected which are PID control mode, P-only control mode, P+I control mode and P+D control mode. From the experiment, a comparison was made between actual and simulation responses of PID control mode (refer topic 4.4.1 and 4.5.1) and the reliability coefficients for each testing are as in table 4.10;.
In this experiment, the maximum output exceedance was calculated to find the reliability coefficient for each test run. Based on the actual and simulated response, the output shows that the overshoot occurred only in the actual response, as there are errors caused by multiple factors. From the calculation, we can conclude that the mathematical model of the PID control mode is reliable with 82% true and 18% error attribution.
From the experiment, a comparison was made between real and simulation responses of P-only control mode (refer topic 4.4.2 and 4.5.2) and the reliability coefficient for each testing is as in table 4.11;. In this experiment, only P control mode was used and the maximum overshoot of the output was recorded. From the calculation, we can conclude that the mathematical model of PID control mode is reliable with 85% true and 15% attributable to error.
From the experiment, a comparison was made between real and simulated responses of the P+I control mode (see Topics 4.4.3 and 4.5.3) and the confidence coefficient for each test is as shown in Table 4.12; Based on Table 4.12, it is clearly shown that the P+I control mode is not reliable, as all three test results show a reliability coefficient of less than 0.8. Based on the mathematical model, Integral Action allows the P+I control mode to eliminate the offset, which is a major weakness of a P-only controller.
Thus, the PI control mode must provide a balance of complexity and capability in PID pressure control. From the calculation, we can conclude that the mathematical model of PID control mode is not reliable with 69% true and 31% attributed to error. From the experiment, a comparison is made between the actual and simulated responses of the P+I control mode (refer to topic 4.4.4 and 4.5.4) and the reliability coefficient for each test is as in Table 4.13;.
Based on Table 4.15, P+D control mode produces a small value of maximum overshoot which gives high reliability coefficient. From the calculation, we can conclude that the mathematical model of PID control mode is not reliable with 88% true and 12% attributed to error.
CONCLUSION AND RECOMMENDATION
Conclusion
Recommendation
However, the author anticipates that the results of this project's analysis could help control engineers make decisions about implementing a PID controller in their process plant. It is also recommended for future researchers that the response for all four different modes be studied under different parameter variations. Since the PID mathematical model has been used for more than fifty years, it is important that the mathematical model is thoroughly investigated before making a reliability decision.
Further investigation of the mathematical model of the PID controller is recommended for future work, determining the specific definition of input variables, as well as the design of the algorithm of input variables with respect to the desired output in their project.
APPENDICES