CHAPTER 5 FINDINGS CHAPTER 5: FINDINGS
5.1 Overview
The findings of the data analysis on the impact of the i-Tajweed game and the research are investigated in this research. The evaluation was conducted with two groups of people: students who were game users and experts from two fields: computer science (multimedia) and Quran (Tajweed). Following the introduction, the findings are provided, which comprise the result of the normality test, an inferential analysis, and the results of an evaluation of sustainability elements in game design. Then comes the experimental approach, which incorporates two groups: a control group exposed to Youtube and a treatment group subjected to the i-Tajweed game. Next, hypothesis testings are done to see how the i-Tajweed game affects students' motivation and achievement. Finally, the chapter concludes with a chapter summary.
5.2 Demographic of the Respondents
This section presents the demographic of the respondents involved in this research.
5.2.1 Gender for Control Group
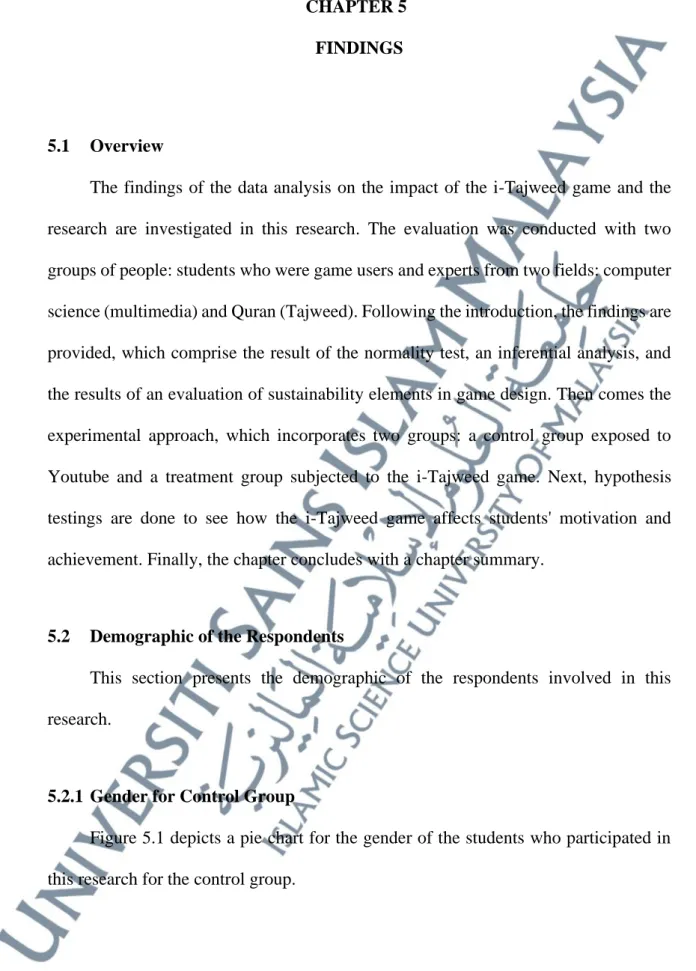
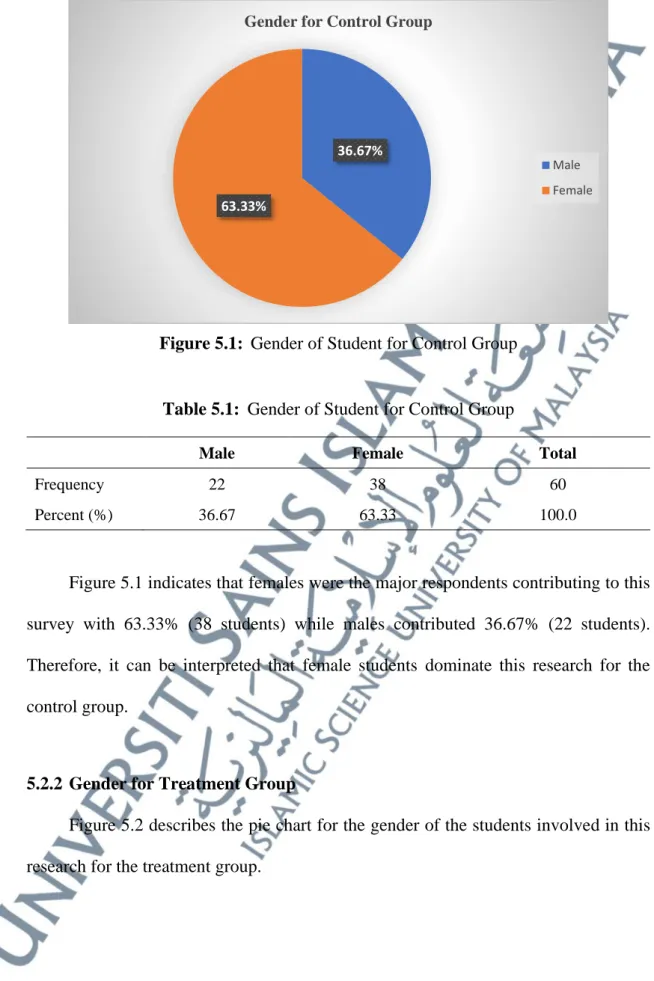
Figure 5.1 depicts a pie chart for the gender of the students who participated in this research for the control group.
Figure 5.1: Gender of Student for Control Group
Table 5.1: Gender of Student for Control Group
Male Female Total
Frequency 22 38 60
Percent (%) 36.67 63.33 100.0
Figure 5.1 indicates that females were the major respondents contributing to this survey with 63.33% (38 students) while males contributed 36.67% (22 students).
Therefore, it can be interpreted that female students dominate this research for the control group.
5.2.2 Gender for Treatment Group
Figure 5.2 describes the pie chart for the gender of the students involved in this research for the treatment group.
36.67%
63.33%
Gender for Control Group
Male Female
Figure 5.2: Gender of Student for Treatment Group
Table 5.2: Gender of Student for Treatment Group
Male Female Total
Frequency 21 39 60
Percent (%) 35.00 65.00 100.0
From Table 5.2, it can be said that females were the major respondents contributing to this survey with 65.00% (39 students) while males contributed 35.00%
(21 students). Therefore, it can be interpreted that female students dominate this research for the treatment group.
5.3 Student`s Achievement in Learning Tajweed
This section explains the score of students' achievement in pre and post-test between control and treatment groups.
36%
64%
Gender for Treatment Group
Male Female
5.3.1 Student`s Achievement in Learning Tajweed for Control Group
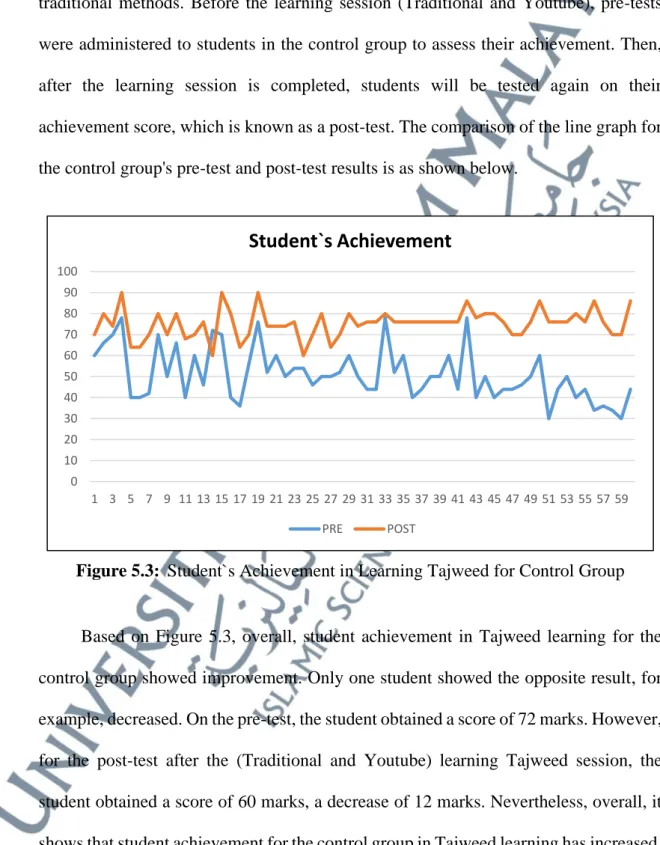
Figure 5.3 depicts a line graph of the control group's student achievement in Tajweed learning. This control group's learning sessions were conducted using traditional methods. Before the learning session (Traditional and Youtube), pre-tests were administered to students in the control group to assess their achievement. Then, after the learning session is completed, students will be tested again on their achievement score, which is known as a post-test. The comparison of the line graph for the control group's pre-test and post-test results is as shown below.
Figure 5.3: Student`s Achievement in Learning Tajweed for Control Group
Based on Figure 5.3, overall, student achievement in Tajweed learning for the control group showed improvement. Only one student showed the opposite result, for example, decreased. On the pre-test, the student obtained a score of 72 marks. However, for the post-test after the (Traditional and Youtube) learning Tajweed session, the student obtained a score of 60 marks, a decrease of 12 marks. Nevertheless, overall, it shows that student achievement for the control group in Tajweed learning has increased.
0 10 20 30 40 50 60 70 80 90 100
1 3 5 7 9 11 13 15 17 19 21 23 25 27 29 31 33 35 37 39 41 43 45 47 49 51 53 55 57 59
Student`s Achievement
PRE POST
5.3.2 Student`s Achievement in Learning Tajweed for Treatment Group
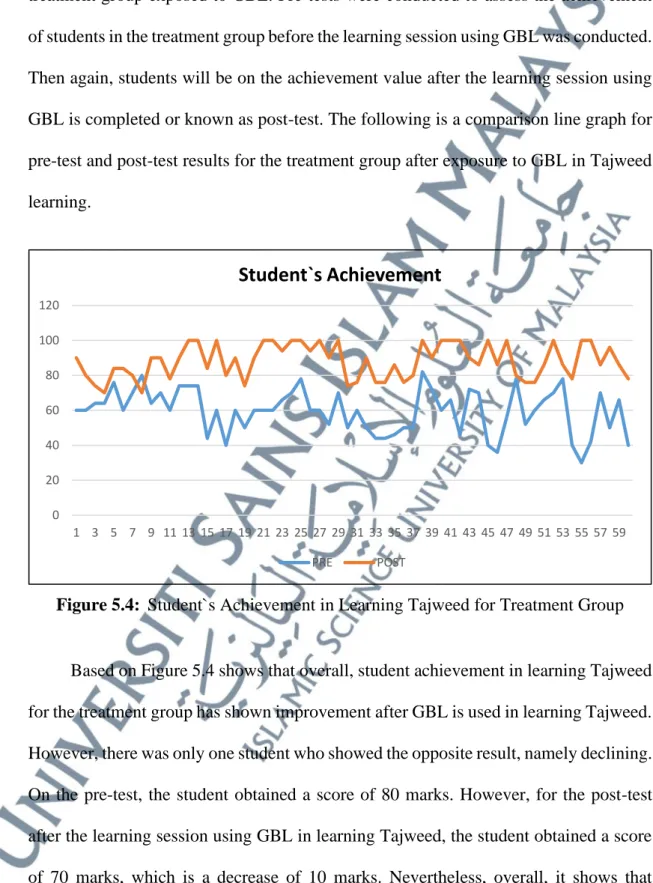
Figure 5.4 is a line graph of student achievement in learning Tajweed for the treatment group exposed to GBL. Pre-tests were conducted to assess the achievement of students in the treatment group before the learning session using GBL was conducted.
Then again, students will be on the achievement value after the learning session using GBL is completed or known as post-test. The following is a comparison line graph for pre-test and post-test results for the treatment group after exposure to GBL in Tajweed learning.
Figure 5.4: Student`s Achievement in Learning Tajweed for Treatment Group
Based on Figure 5.4 shows that overall, student achievement in learning Tajweed for the treatment group has shown improvement after GBL is used in learning Tajweed.
However, there was only one student who showed the opposite result, namely declining.
On the pre-test, the student obtained a score of 80 marks. However, for the post-test after the learning session using GBL in learning Tajweed, the student obtained a score of 70 marks, which is a decrease of 10 marks. Nevertheless, overall, it shows that
0 20 40 60 80 100 120
1 3 5 7 9 11 13 15 17 19 21 23 25 27 29 31 33 35 37 39 41 43 45 47 49 51 53 55 57 59
Student`s Achievement
PRE POST
student achievement for the treatment group in learning Tajweed has increased, especially after the use of GBL.
5.3.3 Total Gender
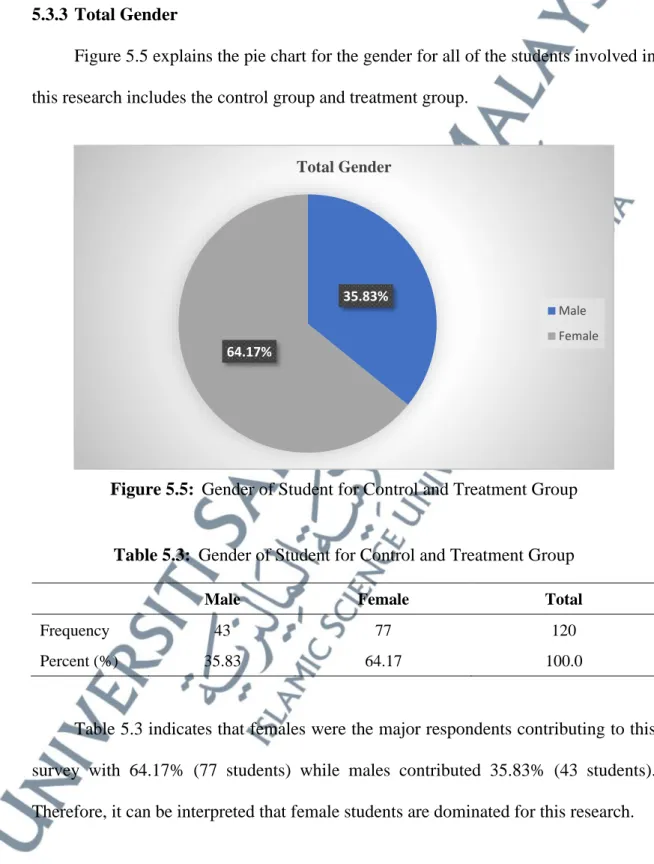
Figure 5.5 explains the pie chart for the gender for all of the students involved in this research includes the control group and treatment group.
Figure 5.5: Gender of Student for Control and Treatment Group
Table 5.3: Gender of Student for Control and Treatment Group
Male Female Total
Frequency 43 77 120
Percent (%) 35.83 64.17 100.0
Table 5.3 indicates that females were the major respondents contributing to this survey with 64.17% (77 students) while males contributed 35.83% (43 students).
Therefore, it can be interpreted that female students are dominated for this research.
35.83%
64.17%
Total Gender
Male Female
5.3.4 Comparison of Student`s Achievement in Learning Tajweed between Control Group and Treatment Group
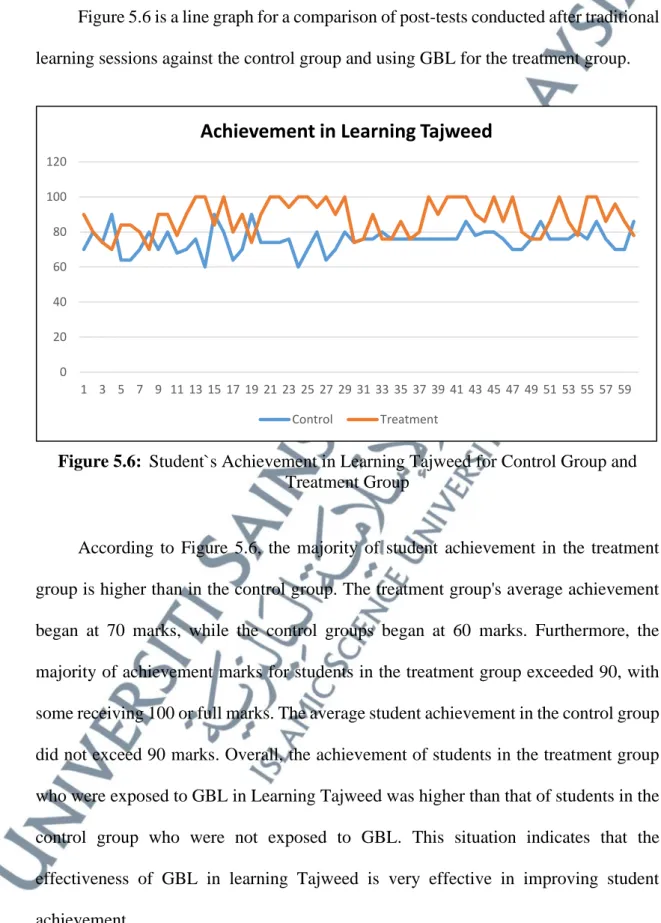
Figure 5.6 is a line graph for a comparison of post-tests conducted after traditional learning sessions against the control group and using GBL for the treatment group.
Figure 5.6: Student`s Achievement in Learning Tajweed for Control Group and Treatment Group
According to Figure 5.6, the majority of student achievement in the treatment group is higher than in the control group. The treatment group's average achievement began at 70 marks, while the control groups began at 60 marks. Furthermore, the majority of achievement marks for students in the treatment group exceeded 90, with some receiving 100 or full marks. The average student achievement in the control group did not exceed 90 marks. Overall, the achievement of students in the treatment group who were exposed to GBL in Learning Tajweed was higher than that of students in the control group who were not exposed to GBL. This situation indicates that the effectiveness of GBL in learning Tajweed is very effective in improving student achievement.
0 20 40 60 80 100 120
1 3 5 7 9 11 13 15 17 19 21 23 25 27 29 31 33 35 37 39 41 43 45 47 49 51 53 55 57 59
Achievement in Learning Tajweed
Control Treatment
5.4 The Findings for Experimental Design
Pre-test and post-test were used to perform a quasi-experimental using the control and treatment groups. First, it was used to gather the necessary data, and participants were managed to complete the questionnaire. The pre-test was conducted after the respondents were randomly allocated to the treatment group (i-Tajweed) and the control group (YouTube). The treatment group was given the i-Tajweed game, whereas the control group was given a standard teaching technique and access to YouTube. Pupils in both groups completed the Tajweed test before (pre-test) and after (post-test) intervention (post-test). After the pre-test, participants in the treatment group were instructed to play the game for one hour. Then, one short after completing the game, the respondents were asked to answer the questionnaire (post-test). The results of the descriptive analysis are discussed in the next section.
5.4.1 Descriptive Analysis
Descriptive analysis was used for the purpose of the researcher to analyse the research sample mainly related to the demographics of the respondents. This analysis is conducted to obtain output results in the form of frequency, percentage, mean distribution, and standard deviation. Using this analysis can describe the information simply and clearly related to the socio-demographics of the respondents consisting of gender. In this investigation, the descriptive analysis is utilised to determine the mean value and standard deviation (SD) for the aspects of sustainability as well as the aspects of motivation. The mean score interpretation table utilised in this research is shown in Table 5.4.
Table 5.4: The Interpretation of Mean Score
Mean Score Interpretation of Mean Score
1.00 - 2.00 Low
2.01 - 3.00 Medium low
3.01 - 4.00 Medium high
4.01 - 5.00 Height
Source: Nunnally & Bernstein, (1994) 5.4.1.1 Descriptive Analysis of Mean Values of Sustainability and Motivation
Aspects for the Control group
1. Sustainability Aspects
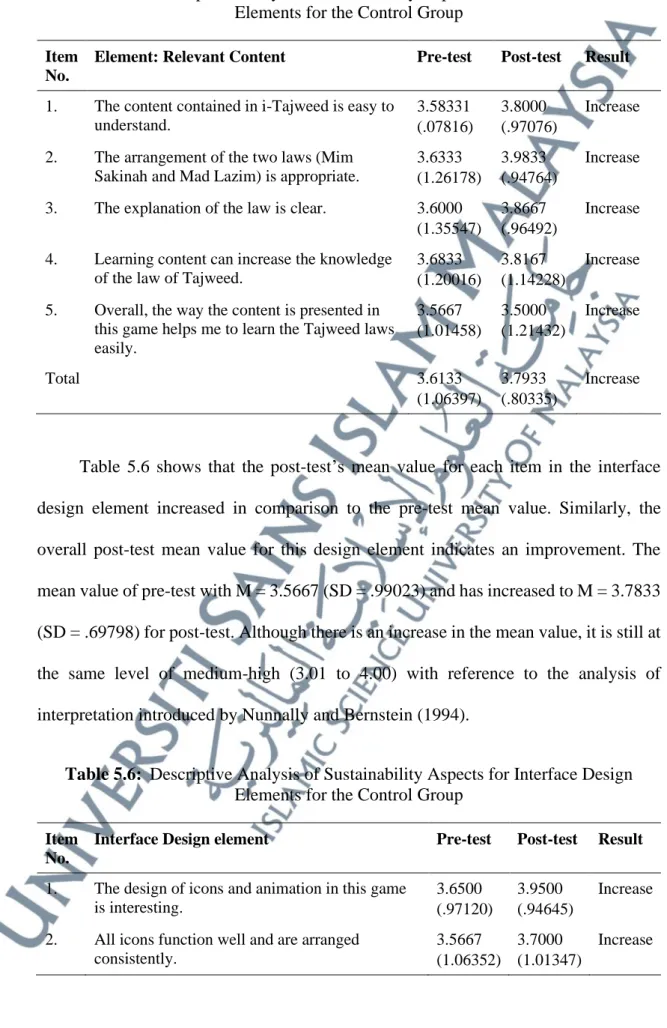
The mean pre and post-test values of the relevant content elements for the control group are portrayed in Table 5.5. The mean value of each item in this relevant content element after the post-test in comparison to the pre-test, as displayed in Table 5.5.
Overall, the content element's mean value increased from M = 3.6133 (SD = 1.06397) in the pre-test to M = 3.7933 (SD =.80335) in the post-test. However, according to Nunnally and Bernstein (1994), the mean value has increased, but it is still at the same medium high level (3.01 to 4.00).
Table 5.5: Descriptive Analysis of Sustanability Aspects for Relevant Content Elements for the Control Group
Item No.
Element: Relevant Content Pre-test Post-test Result
1. The content contained in i-Tajweed is easy to understand.
3.58331 (.07816)
3.8000 (.97076)
Increase 2. The arrangement of the two laws (Mim
Sakinah and Mad Lazim) is appropriate.
3.6333 (1.26178)
3.9833 (.94764)
Increase 3. The explanation of the law is clear. 3.6000
(1.35547)
3.8667 (.96492)
Increase 4. Learning content can increase the knowledge
of the law of Tajweed.
3.6833 (1.20016)
3.8167 (1.14228)
Increase 5. Overall, the way the content is presented in
this game helps me to learn the Tajweed laws easily.
3.5667 (1.01458)
3.5000 (1.21432)
Increase
Total 3.6133
(1.06397)
3.7933 (.80335)
Increase
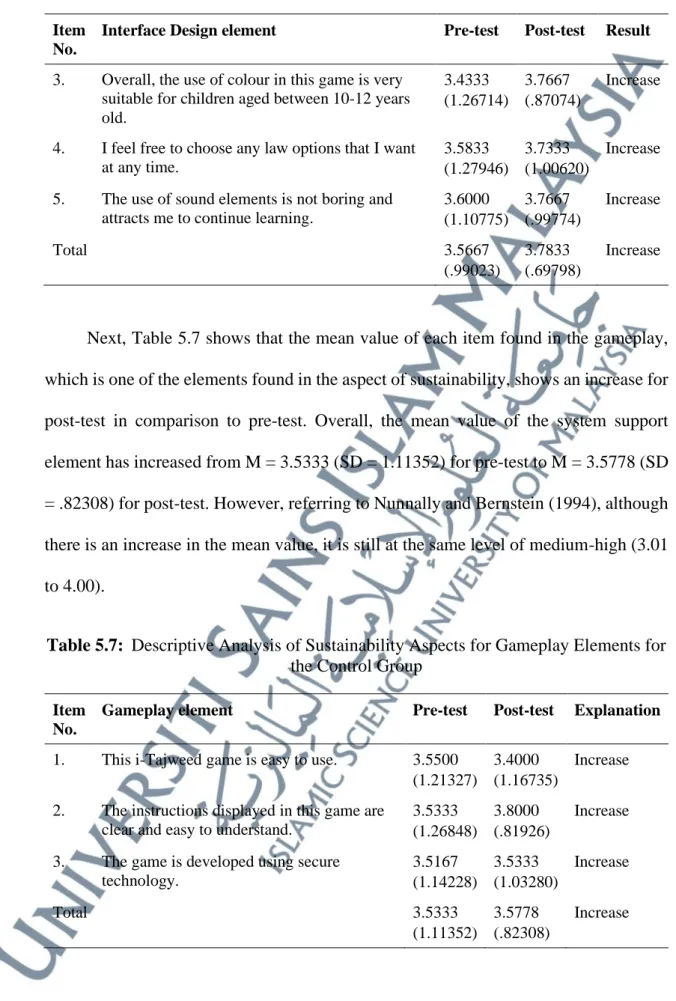
Table 5.6 shows that the post-test’s mean value for each item in the interface design element increased in comparison to the pre-test mean value. Similarly, the overall post-test mean value for this design element indicates an improvement. The mean value of pre-test with M = 3.5667 (SD = .99023) and has increased to M = 3.7833 (SD = .69798) for post-test. Although there is an increase in the mean value, it is still at the same level of medium-high (3.01 to 4.00) with reference to the analysis of interpretation introduced by Nunnally and Bernstein (1994).
Table 5.6: Descriptive Analysis of Sustainability Aspects for Interface Design Elements for the Control Group
Item No.
Interface Design element Pre-test Post-test Result
1. The design of icons and animation in this game is interesting.
3.6500 (.97120)
3.9500 (.94645)
Increase 2. All icons function well and are arranged
consistently.
3.5667 (1.06352)
3.7000 (1.01347)
Increase
Item No.
Interface Design element Pre-test Post-test Result
3. Overall, the use of colour in this game is very suitable for children aged between 10-12 years old.
3.4333 (1.26714)
3.7667 (.87074)
Increase
4. I feel free to choose any law options that I want at any time.
3.5833 (1.27946)
3.7333 (1.00620)
Increase 5. The use of sound elements is not boring and
attracts me to continue learning.
3.6000 (1.10775)
3.7667 (.99774)
Increase
Total 3.5667
(.99023)
3.7833 (.69798)
Increase
Next, Table 5.7 shows that the mean value of each item found in the gameplay, which is one of the elements found in the aspect of sustainability, shows an increase for post-test in comparison to pre-test. Overall, the mean value of the system support element has increased from M = 3.5333 (SD = 1.11352) for pre-test to M = 3.5778 (SD
= .82308) for post-test. However, referring to Nunnally and Bernstein (1994), although there is an increase in the mean value, it is still at the same level of medium-high (3.01 to 4.00).
Table 5.7: Descriptive Analysis of Sustainability Aspects for Gameplay Elements for the Control Group
Item No.
Gameplay element Pre-test Post-test Explanation
1. This i-Tajweed game is easy to use. 3.5500 (1.21327)
3.4000 (1.16735)
Increase 2. The instructions displayed in this game are
clear and easy to understand.
3.5333 (1.26848)
3.8000 (.81926)
Increase 3. The game is developed using secure
technology.
3.5167 (1.14228)
3.5333 (1.03280)
Increase
Total 3.5333
(1.11352)
3.5778 (.82308)
Increase
The mean values for post-test and pre-test usability components are shown in Table 5.8. According to the table, the mean value of the post-test for each item identified in the usability element increases when compared to the mean value of the pre-test.
Similarly, the total mean value of the post-test for this usability factor indicates an increase, with the mean value of pre-test being M = 3.4556 (SD =.97418) and post-test being M = 3.7889 (SD =.77622). However, according to Nunnally and Bernstein (1994), the mean value has increased, but it is still at the same medium high level (3.01 to 4.00).
Table 5.8: Descriptive Analysis of Sustainability Aspects for Usability Elements for the Control Group
Item No.
Usability element Pre-test Post-test Explanation
1. I find it easy to press icons because they are arranged consistently.
3.4000 (1.22405)
3.8333 (1.01124)
Increase 2. The display on the menu bar makes it easy
for me to use the game.
3.4000 (.99490)
3.6667 (.98577)
Increase 3. I understand more about how to play
because the instructions given at the beginning of the display are clear.
3.5667 (1.15519)
3.8667 (.99943)
Increase
Overall usability element 3.4556
(.97418)
3.7889 (.77622)
Increase
For the next element, the reward element (Table 5.9), it was found that the mean value of each item under this element showed an increase for the post-test compared to the pre-test. The overall mean pre-test value for this element is M = 3.7608 (SD = 1.04889) and has increased to M = 3.8100 (SD = .72479) for post-test. However, referring to Nunnally and Bernstein (1994), although there is an increase in the mean value, it is still at the same level of medium-high (3.01 to 4.00).
Table 5.9: Descriptive Analysis of Sustainability Aspects for Reward Elements for the Control Group
Item No.
Reward Pre-test Post-test Explanation
1. I work hard to get the highest score. 3.6000 (1.22405)
3.6500 (1.02221)
Increase 2. While playing, I strive to understand
Tajweed law to get the highest score.
3.6500 (1.11728)
3.7667 (.99774)
Increase 3. The reward found in this game increases my
motivation to learn Tajweed.
4.1186 (1.26061)
3.9667 (.99092)
Increase 4. I feel more focused on the game because i
want to achieve the highest score.
3.9500 (1.22716)
3.7333 (1.17699)
Increase 5. The higher the score obtained implies a
clearer of me to understand the Tajweed laws.
3.4833 (1.24181)
3.8333 (1.10724)
Increase
Total 3.7608
(1.04889)
3.8100 (.72479)
Increase
Finally, for the control group, there is a table (Table 5.10) with the mean values of pre-test and post-test for sustainability features. Generally, the mean value of this aspect of sustainability is increasing, according to the outcomes of the descriptive analysis of the mean value. The mean value for pre-test was M = 3.5859 (SD = .97040) and increased to M = 3.7507 (SD = .66386) for post-test. Although there is an increase in the mean value, it is still at the same level of medium-high (3.01 to 4.00) with reference to the analysis of interpretation introduced by Nunnally and Bernstein (1994).
Table 5.10: Descriptive Analysis of Sustainability Aspects for the Control Group Item
No.
Pre-test Post-test Result
1. Relevant content 3.6133
(1.06397)
3.7933 (.80335)
Increase
2. Interface design 3.5667
(.99023)
3.7833 (.69798)
Increase
3. Gameplay 3.5333
(1.11352)
3.5778 (.82308)
Increase
Item No.
Pre-test Post-test Result
4. Usability 3.4556
(.97418)
3.7889 (.77622)
Increase
5. Reward 3.7608
(1.04889)
3.8100 (.72479)
Increase
Total 3.5859
(.97040)
3.7507 (.66386)
Increase
2. Motivation Aspect
Table 5.11 shows the mean values of the post-test and pre-test for motivation aspects for the control group. Based on Table 5.11, it is found that the mean value of each item found in this aspect of motivation shows an increase for post-test in comparison to pre-test. In general, the mean value for motivation has increased from M
= 3.6396 (SD = 1.04433) for pre-test to M = 3.6937 (SD = .61815) for post-test.
However, referring to Nunnally and Bernstein (1994), although there is an increase in the mean value, it is still at the same level of medium-high (3.01 to 4.00)
Table 5.11: Descriptive Analysis of Sustainability Aspects for Design Elements for the Control Group
Item No.
Motivation aspect Pre-test Post-test Result
1. I am very happy to continue learning Tajweed while using this game.
3.8333 (1.39207)
3.6000 (1.16735)
Increasing 2. I feel very confident in using i-Tajweed. 3.8000
(1.13197)
3.9167 (.86928)
Increasing 3. By using this game, my motivation to
understand tajweed laws increases.
3.7500 (1.25718)
3.7833 (.82527)
Increasing 4. The motivational words given are
appropriate and can motivate me to keep playing using i-Tajweed.
3.4333 (1.16977)
3.6833 (.96536)
Increasing
5. I easily understand the content contained in i-Tajweed.
3.6167 (1.18023)
3.6000 (.90573)
Increasing
Item No.
Motivation aspect Pre-test Post-test Result
6. After using the i-Tajweed game, i can understand the laws of Mim Sakinah and Mad Lazim clearly.
3.5833 (1.19734)
3.5833 (.94406)
Increasing
7. Tajweed tips provided can help me understand Tajweed laws.
3.5833 (1.16868)
3.6167 (.90370)
Increasing 8. Overall, i-Tajweed helps me increase their
motivation to learn Tajweed.
3.5167 (1.12734)
3.7667 (.81025)
Increasing
Overall Motivational Aspect 3.6396
(1.04433)
3.6937 (.61815)
Increasing
5.4.1.2 Descriptive Analysis of Mean Values of Sustainability and Motivation Aspects for Treatment Group (TG) Tested with GBL in Tajweed Learning
1. Sustainability aspects
Table 5.12 portrays the mean post-test and pre-test values of the content elements for the treatment group that exposed to GBL in Tajweed learning. Based on this, it is found that the mean value of each item found in this content element shows an increase for post-test in comparison to pre-test. In general, the mean value of the content element has increased from M = 3.7167 (SD = .71525) for pre-test to M = 4.1800 (SD = .74260) for post-test. Referring to the interpretive analysis by Nunnally and Bernstein (1994), the mean value for this content element has increased from medium to high level after the use of GBL in Tajweed learning.
Table 5.12: Descriptive Analysis of Sustainability Aspects for Relevant Content Elements for the Treatment Group
Item No.
Relevant content element Pre - test Post - test
Explanation
1. The content contained in i-Tajweed is easy to understand.
3.6667 (.79547)
4.0000 (.84372)
Increasing 2. The arrangement of the two laws (Mim
Sakinah and Mad Lazim) is relevant.
3.7667 (1.01458)
4.2167 (.88474)
Increasing 3. The way the law is explained is clear. 3.8167
(.96536)
4.3833 (.86537)
Increasing 4. Learning content can increase the knowledge
of Tajweed laws.
3.7833 (1.12131)
4.2333 (.90884)
Increasing 5. Overall, the content delivery method in this
game helps students learn the Tajweed laws easily.
3.5500 (.89110)
4.0667 (.89947)
Increasing
Total 3.7167
(.71525)
4.1800 (.74260)
Increasing
For the next element as illustrated in Table 5.13, the interface design element, it was found that the mean value of each item under this element showed an increase for post-test in comparison to pre-test. The total mean value of pre-test for this element is M = 3.7200 (SD = .77346), which is at a moderately high level and has increased to M
= 4.2433 (SD= .77424) for post-test, which has increased to a level that high refers to the interpretive analysis by Nunnally and Bernstein (1994).
Table 5.13: Descriptive Analysis of Sustainability Aspects for Interface Design Elements for the Treatment Group
Item No.
Interface Design Element Pre - test Post - test
Explanation
1. All icons function well and are arranged consistently.
3.6000 (1.07672)
4.2833 (.86537)
Increase 2. Overall, the use of colour in this game is
very suitable for children aged between 10- 12 years old.
3.7333 (1.02290)
4.2333 (.94540)
Increase
3. I am free to choose any law options they 3.8000 4.2833 Increase
Item No.
Interface Design Element Pre - test Post - test
Explanation
4. The use of sound elements are not boring and attracts me to continue learning.
3.8000 (1.07040)
4.3333 (.87656)
Increase 5. All icons function well and are arranged
consistently.
3.6667 (1.00282)
4.0833 (1.09377)
Increase
Total 3.7200
(.77346)
4.2433 (.77424)
Increase
The following is Table 5.14, which illustrates the mean values for the post-test and pre-test for system support elements. Referring to the table, it is found that the mean value of post-test for each item found in the supporting elements of this system there is a rise in the mean value of post-test in comparison to the pre-test mean value. Similarly, the overall mean value of the post-test for this element portrays that there is a rise where the pre-test mean value is M = 3.7000 (SD = .85415) and has increased to M = 4.2889 (SD= .81063) for post-test. This increase in mean value indicates that after the use of GBL in Tajweed learning, the mean value for the support elements of this system has increased from a moderately high level to a high level.
Table 5.14: Descriptive Analysis of Sustainability Aspects for Gameplay Elements for the Treatment Group
Item No.
Gameplay Pre-test Post-
test
Explanation
1. This i-Tajweed game is easy to use. 3.5833 (.99646)
4.3333 (.93277)
Increase 2. The instructions displayed in this game are
clear and easy to understand.
3.8500 (.97120)
4.4167 (.88857)
Increase 3. The game is developed using secure
technology.
3.6667 (1.08404)
4.1167 (.92226)
Increase
Total 3.7000
(.85415)
4.2889 (.81063)
Increase
Furthermore, Table 5.15 found that the mean value of each item found in the usability element, which is one of the elements found in the aspect of sustainability, showed an increase for post-test in comparison to pre-test. Generally, the mean value of the usability element has increased from a moderately high level with a value of M
= 3.6778 (SD = .90607) for pre-test to a high level with a value of M = 4.2222 (SD = .83399) for post-test.
Table 5.15: Descriptive Analysis of Sustainability Aspects for Usability Elements for the Treatment Group
Item No.
Usability element Pre-test Post-test Explanation
1. I find it easy to press buttons/icons because they are arranged consistently.
3.6167 (.97584)
4.2833 (.88474)
Increase 2. The display on the menu bar makes it easy
for me to use the game.
3.7333 (1.08716)
4.2167 (1.10610)
Increase 3. I understand more about how to play
because the instructions given at the beginning of the display are clear.
3.6833 (1.03321)
4.1667 (.88618)
Increase
Total 3.6778
(.90607)
4.2222 (.83399)
Increase
For the next element as illustrated in Table 5.16, the reward element, it was found that the mean value of each item under this element showed an increase for the post-test in comparison to the pre-test. The total mean value of the pre-test for this element is M
= 3.76076 (SD = .91278), which is at a moderately high level. However, after the use of GBL in Tajweed learning, the mean value has increased to M = 4.4000 (SD = .66486) for the post-test, which has increased to a high level.
Table 5.16: Descriptive Analysis of Sustainability Aspects for Reward Elements for Treatment Groups
Item No.
Reward element Pre-test Post-
test
Explanation
1. I work hard to get the highest score. 3.6167 (1.10610)
4.4167 (.86928)
Increase 2. While playing, i strive to understand Tajweed
law to get the highest score.
3.7167 (.99305)
4.2833 (.95831)
Increase 3. The reward system found in this game
increases my motivation y to learn Tajweed.
3.7667 (1.06352)
4.5000 (.67648)
Increase 4. I feel more focused on the game because they
want to achieve the highest score.
3.7667 (1.15519)
4.4667 (.79119)
Increase 5. The higher the score obtained implies a
clearer of student to understand the Tajweed laws.
3.6667 (.93277)
4.3333 (.77387)
Increase
Total 3.7067
(.91278)
4.4000 (.66486)
Increase
Finally, there is a table (5.17) for the mean values of the post-test and pre-test for the total sustainability aspect for the treatment group. Overall, the findings of the descriptive analysis of the mean value indicate that the mean value of this aspect of sustainability occurs an increase. The mean value for the pre-test is M = 3.7042 (SD = .76953), which is at a moderately high level. This mean value has increased to M = 4.2669 (SD = .71373) for the post-test that is after the use of GBL in learning Tajweed, and it is at a high level.
Table 5.17: Descriptive Analysis of Aspects of Sustainability for the Treatment Group
Item No.
Pre-test Post- test
Explanation
1. Relevant content 3.7167
(.71525)
4.1800 (.74260)
Increase
2. Interface design 3.7200
(.77346)
4.2433 (.77424)
Increase
3. Gameplay 3.7000 4.2889 Increase
Item No.
Pre-test Post- test
Explanation
(.85415) (.81063)
4. Usability 3.6778
(.90607)
4.2222 (.83399)
Increase
5. Reward 3.7067
(.91278)
4.4000 (.66486)
Increase
Total 3.7042
(.76953)
4.2669 (.71373)
Increase
2. Motivation aspects
Table 5.18 shows the mean values of the post-test and pre-test for motivational aspects for the treatment group exposed to GBL in Tajweed learning. Based on this, it is found that the mean value for each item found in this aspect of motivation shows an increase for the post-test in comparison to the pre-test. In general, the mean value for motivation has increased from M = 3.6396 (SP = 1.04433) for pre-test to M = 3.6937 (SP = .61815) for post-test. The mean value acquired for the pre-test indicates that it is relatively high, while the mean value acquired for the post-test indicates high. This indicates that after the use of GBL in Tajweed learning, the motivation level of the students has increased from medium-high to high.
Table 5.18: Descriptive Analysis of Motivational Aspects for Treatment Groups Item
No.
Motivation aspect Pre - test Post -
test
Explanation
1. I am very happy to continue learning Tajweed while using this game.
3.7167 (1.10610)
4.4833 (.77002)
Increase 2. I feel very confident in using i-Tajweed. 3.8000
(1.00507)
4.4167 (.78744)
Increase 3. By using this game, my motivation to
understand tajweed laws increases.
3.9167 (.92593)
4.4667 (.67565)
Increase
Item No.
Motivation aspect Pre - test Post -
test
Explanation
4. The motivational words given are appropriate and can motivate me to keep playing using i- Tajweed.
3.7667 (.87074)
4.4667 (.76947)
Increase
5. I easily understand the content contained in i- Tajweed.
3.5833 (1.13931)
4.3667 (.78041)
Increase 6. After using the i-Tajweed game, i can
understand the laws of Mim Sakinah and Mad Lazim clearly.
3.9000 (.87721)
4.3833 (.73857)
Increase
7. Tajweed tips provided can help me understand Tajweed laws.
3.8500 (.97120)
4.4500 (.67460)
Increase 8. Overall, i-Tajweed helps me increase their
motivation to learn Tajweed.
3.7500 (.87576)
4.4667 (.65008)
Increase
Total 3.7854
(.76541)
4.4375 (.59058)
Increase
5.5 Result for Normality Test
The data is filtered and examined for normal distributions and statistical assumptions for normal distributions as the last stage in the process of filtering the data before being analysed to test hypotheses (Tabachnick & Fidell, 2007). To determine if the data distribution was normal or skewed, normality tests were used. The normality test is critical because irregular data causes data analysis to be less reliable, resulting in incorrect conclusions. For all items, descriptive analysis was utilised to examine the normal distribution of data (normality of data) used in this research. Because Skewness and Kurtosis values of +/- 2 were obtained, the results of this analysis show that all of the data in this research are normally distributed (Tabachnick & Fidell, 2007). The result of the normality test for both groups was explained in the next subsection.
5.5.1 Normality for Sustainability Elements and Motivation for Control Group and Treatment Group (Pre - Test)
Table 5.19: Skewness and Kurtosis Values for Sustainability aspects (Pre -Test) Total Control Group Treatment Group
Value of Skewness
Value of Kurtosis
Value of Skewness
Value of Kurtosis
Sustainability Elements 60 -1.054 1.336 -.952 1.740
Relevant Content 60 -1.096 .808 -.939 1.359
Interface Design 60 -.942 1.061 -.605 .563
Gameplay 60 -.817 .051 -.590 .786
Usability 60 -.650 .584 -.810 1.165
Reward 60 -1.126 1.210 -.898 1.057
Table 5.19 shows the Skewness and Kurtosis value on the pre-test of the questionnaire on the sustainability aspect for the control and treatment groups. Based on the table as a whole, the value of Skewness and Kurtosis for the sustainability aspect of each group is between -2 to 2. Referring to Tabachnick and Fidell (2007), the value of Skewness and Kurtosis obtained is between -2 to 2, indicating that the distribution of data obtained is normal. Then this data can be used for hypothesis testing and can also be used for inferential analysis.
Table 5.20: Skewness and Kurtosis Values for Motivation Aspects (Pre-test) Total Control Group Treatment Group
Value of Skewness
Value of Kurtosis
Value of Skewness
Value of Kurtosis
Motivation aspect 60 -.925 .842 -.914 1.395
The pre-test values of the questionnaire for motivation elements for the control and treatment groups are shown in Table 5.20. According to the findings of the
normality test, the values of Skewness and Kurtosis obtained are between -2 and 2. This demonstrates that the data gathered has a normal distribution and may be utilised for hypothesis testing and inferential analysis. Table 5.20 shows the Skewness and Kurtosis pre-test values of the questionnaire for sustainability aspects for the control and treatment groups that were exposed to GBL in Tajweed learning. The results of the normality analysis that has been conducted found that the values of Skewness and Kurtosis obtained are between -2 to 2. This shows that the distribution of data obtained is normal and can be used for hypothesis testing and can be used for inferential analysis.
5.5.2 Normality for Sustainability Aspects of Motivation for Control Group and Treatment Group (Post Test)
Table 5.21: Skewness and Kurtosis Values for Sustainability aspects (Post Test) Total Control Group Treatment Group
Value of Skewness
Value of Kurtosis
Value of Skewness
Value of Kurtosis Sustainability elements 60 .211 -1.175 -1.348 .912
Relevant Content 60 -.135 -.747 -1.147 .978
Interface Design 60 .050 -1.070 -1.307 1.018
Gameplay 60 .290 -1.041 -1.258 .486
Usability 60 .146 -1.352 -1.064 .140
Reward 60 .038 -1.309 -1.389 .981
The post-test Skewness and Kurtosis values for the items discovered in the sustainability aspects for the control and treatment groups are shown in Table 5.21. The value of Skewness and Kurtosis for the sustainability element of each group is between -2 and 2 based on the table as a whole. According to Tabachnick and Fidell (2007), the obtained Skewness and Kurtosis values range from -2 to 2, indicating that the data
distribution is normal. This information can then be utilised for hypothesis testing and inferential analysis.
Table 5.22: Skewness and Kurtosis Values for Motivation Aspects (Post Test) Total Control Group Treatment Group
Value of Skewness
Value of Kurtosis
Value of Skewness
Value of Kurtosis
Motivation Aspect 60 .479 -.649 -.945 .002
Table 5.22 shows the post-test Skewness and Kurtosis values for sustainability elements of the questionnaire for the control and treatment groups. According to the findings of the normality test, the values of Skewness and Kurtosis obtained range from -2 to 2. This demonstrates that the data gathered has a normal distribution and may be utilised for hypothesis testing and inferential analysis.
5.6 Inferential Analysis
The inference analysis used in this research was t-test analysis as well as Pearson correlation analysis. These analyses are used for the purpose of answering the research hypotheses that have been formed at the beginning of Chapter 1. The selection of this analysis must be accurate in order to provide accurate results and be able to achieve the goals and objectives of the research.
5.6.1 t-Test analysis
This research employs inference analysis, which is a t-test, in addition to descriptive analysis. The three types of t-tests are independent sample t-test, paired sample t-test, and single-sample t-test. Nevertheless, in this investigation, an independent t-test was performed to evaluate the mean value of post-test pupil
accomplishment between the control and treatment groups of Tajweed learners who were exposed to GBL.
The achievement hypotheses assume the following:
The following are the hypotheses derived from achieving the objectives of the research:
Hypothesis 1:
There is a significant difference in students' achievement between the control group and the treatment group after using GBL in learning Tajweed.
Hypothesis 2:
There is a significant relationship between sustainability elements and students`
achievement among the students in the treatment group after using GBL in learning Tajweed.
Hypothesis 3:
There is a significant relationship between students` motivation and students`
achievement in the treatment group after using GBL in learning Tajweed.
5.6.1.1 Hypothesis Testing 1
H1: There is a significant difference in students' achievement between the control group and the treatment group after using GBL in learning Tajweed.
Table 5.23 shows the mean post-test value for the control group, which is M = 75.3333 (SD = 6.75646). Meanwhile, the post-test value for the treatment group that used GBL in Tajweed learning was M = 80.7667 (SD = 11.39189). This value indicates that the average post-test result score for the treatment group exposed to GBL in Tajweed learning is higher than the average score for the control group.
Table 5.23: Post -Test Descriptive Analysis for Control and Treatment Groups
Group N Min Standard deviation
Control 60 75.3333 6.75646
Treatment 60 80.7667 11.39189
Based on Table 5.24, it is found that the value of the Levene test is .000, which is smaller than .05 (p <.05). Thus, this indicates that the population variance for this research is unbalanced. Then the independent sample t-test value used is the t-value for the variance assumed to be unequal.
Table 5.24: t-Test for Mean Post - Test comparison for Control and Treatment Groups
Levene Test Independent sample T-test
F Sig. t df Sig. (2-tailed)
The assumed variances are the same
18.762 .000 -3.178 118 .002
The assumed variances are not the same
-3.178 95.937 .002
The results of the independent sample t-test analysis showed that the t value = 3.178, df = 95.937 and the significance level = .002, which is smaller than .05 (p <.05).
The results of the independent sample t-test showed that t (95.937) = 3.178, p <.05. The results where the p-value is less than .05 shows that there is a significant difference in the mean post-test between the control and treatment groups. Hence, we accept the hypothesis Ho1: There is a significant difference in students' achievement between the control and treatment groups after using GBL in learning Tajweed. This implies that there is a significant difference in the effectiveness of the post-test for students who use GBL in learning Tajweed compared to the control group. Thus, this indicates that the
total post-test scores obtained by the students of the treatment group were higher than the students of the control group.
5.6.2 Correlation Analysis
Correlation analysis was performed to look at the correlation between two or more variables. To measure the strength of the variables studied in this research, McBurney (2001) proposed an interpretation of the values of the correlation coefficients as mentioned in Table 5.25.
Table 5.25: Interpretation of Pearson Correlation Coefficients by McBurney (2001) Value of Correlation Coefficient (r) Interpretation
0.81 and above Strong correlation
0.61 – 0.80 A moderately strong correlation
0.41 – 0.60 Moderate correlation
0.21 – 0.40 Moderately weak correlation
Below 0.20 Weak correlation
Source: McBurney, (2001).
5.6.2.1 Hypothesis Testing 2
H2: There is a significant relationship between sustainability elements and students` achievement among the students in the treatment group after using GBL in learning Tajweed.
Table 5.26 depicts that there is a substantial connection between aspects of sustainability with student achievement where the significant value obtained is sig. = .018, which is smaller than the sig value. = .05 (p <.05). While the value of the correlation coefficient (r) for the aspect of sustainability with student achievement is .305, which shows that there is a moderately weak correlation according to McBurney (2001) and positively related. The variance r2 = 0.093 shows that 9.3% of the variance
in the aspect of sustainability has a relationship with student achievement. In contrast, 90.7% of other changes in the dependent variables may be due to other factors. Overall, the findings indicate that there is a significant relationship between aspects of sustainability with student achievement after GBL exposure in Tajweed learning. Thus, by accepting Ho2: There is a significant relationship between sustainability elements and students` achievement among the students in the treatment group after using GBL in learning.
Table 5.26: Pearson Correlation Analysis to Determine the Correlation Between Aspects of Sustainability and Student Achievement
Independent Variables N Dependent Variable: Students Performance
Correlation coefficient
(r)
Variance (r2)
Significance (2-tailed)
Sustainability Aspects 60 .305** .093 .018
** Correlation is significant at the 0.01 level (2-tailed).
5.6.2.2 Hypothesis Testing 3
Ho3: There is a significant relationship between students` motivation and students` achievement in the treatment group after using GBL in learning Tajweed.
Based on Table 5.27, the findings show that there is a significant relationship between aspects of motivation with student achievement, with a significant value obtained being sig. = .016, which is smaller than the sig value. = .05 (p <.05). While the value of the correlation coefficient (r) for the aspect of motivation with student achievement is .310, which shows that there is a moderately weak correlation according to McBurney (2001) and positively related. The variance r2 = 0.096 showed that 9.6%
In comparison, 90.4% of other changes in the dependent variables may be due to other factors. Overall, the findings indicate that there is a significant relationship between aspects of motivation with student achievement after the use of GBL in Tajweed learning. Thus, by accepting Ho3: There is a significant relationship between students`
motivation and students` achievement in the treatment group after using GBL in learning Tajweed.
Table 5.27: Pearson Correlation Analysis to See the Relationship Between Aspects of Motivation and Student Achievement
Independent Variables N Dependent Variables: Students Performance
Correlation coefficients
(r)
Variance (r2)
Significance (2-tailed)
Motivational Aspect 60 .310** .096 .016
** Correlation is significant at the 0.01 level (2-tailed).
5.6.2.3 Summary of Hypothesis Testing in the Research
Table 5.28 is a summary of the findings of the research based on the hypotheses that have been constructed in Chapter 1.
Table 5.28: Summary of Research Hypothesis Testing Findings
Bil. Hypothesis Findings
1 H1: There is a significant difference in students' achievement between the control group and the treatment group after using GBL in learning Tajweed.
Accept H1. The significance value = .002 (p
<.05). Thus, there was a significant difference in student achievement between the control and treatment groups disclosed to GBL in Tajweed learning
2 H2: There is a significant relationship between sustainability elements and students` achievement among the students in the treatment group after using GBL in learning.
Accept H2. The value of sig. = .018 (p <.05).
Thus, there is a significant relationship between aspects of sustainability with student achievement after the use of GBL in Tajweed learning.
3 H3: There is a significant relationship between students` motivation and students` achievement in the treatment
Accept H3. The value of sig. = .016 (p <.05).
Thus, there is a significant relationship between aspects of motivation and student
Bil. Hypothesis Findings group after using GBL in learning
Tajweed.
achievement after the use of GBL in Tajweed learning.
This section explains the profile of the expert. Expert in this research involved three different fields that are expert in IT, Tajweed, and instruments as stated in Table 5.29.
Table 5.29:Expert Profile
Item Average Percentage
Gender Male
Female
0 8
0%
100%
Age 30-40
40-50
4 4
50%
50%
Year of experience Less than 5 years More than 5 years
0 8
0%
100%
5.7 Experts` Evaluation on i-Tajweed Game
The expert evaluation form was designed in detail to ensure the game can achieve the learning objective. The multidisciplinary nature of the processes in developing game that combine sound, art, control systems, multimedia elements, and human factors, also makes the software game development practice different from traditional software development (Aleem et al., 2016). The following subsection shows the comment from experts toward the i-Tajweed game.
Expert 1: Good, i-Tajweed enable us to encourage students` motivation to focus on learning. Students enjoy the reward system (score) after they finish playing the game.
For improvement, maybe we can add audio elements and reinforcement.
Expert 2: Interactive game and the game interact with the user in learning and easy to understand with the provided note. Therefore, users can refer to the note before
they play the game. However, the game could slow down the speed of the boy character.
My suggestion is you can increase the speed for the high level or stage.
Expert 3: Very interesting, eye-catching, and motivating. Especially the relevant supportive encouragement. It looks very well-made. Trophy structure can be improved to give longer achievement goals and satisfaction. Overall, very good apps.
5.7.1 The Validity Value of the Questionnaire
This section explains the expert validation of the game. Table 5.30 shows the validity value of sustainability and motivation aspect.
Table 5.30: The validity value of the Questionnaire for Sustainability Aspects according to Sub-Elements based on evaluation by three expert panels
Relevant content
No. Item Percentage Result
1 The content contained in i-Tajweed is easy to understand.
86.67 Received 2 The arrangement of the two laws (Mim Sakinah
and Mad Lazim) is appropriate.
86.67 Received 3 The explanation of the law is clear. 66.67 Received 4 Learning content can increase the knowledge of the
law of Tajweed.
80.00 Received 5 Overall, the way the content is presented in this
game helps students learn the Tajweed laws easily.
80.00 Received Interface design
No. Item Percentage Result
1 All buttons/icons function well and are arranged consistently
80.00 Received 2 Pupils are free to choose any law options they want
at any time.
66.67 Received 3 Overall, the use of colour in this game is very
suitable for children aged between 10-12 years old.
86.67 Received 4 The use of sound elements is not boring and
attracts students to continue learning.
86.67 Received
Relevant content 5 All icons function well and are arranged
consistently.
80.00 Received
Gameplay
No. Item Percentage Result
1 This i-Tajweed game is easy to use. 86.67 Received
2 The instructions displayed in this game are clear and easy to understand.
80.00 Received 3 The game is developed using secure technology. 86.67 Received
Usability
No. Item Percentage Result
1 Pupils find it easy to press buttons/icons because they are arranged consistently.
86.67 Received 2 The display on the menu bar makes it easy for
students to use the game.
80.00 Received 3 Pupils understand more about how to play because
the instructions given at the beginning of the display are clear.
80.00 Received
Reward
No. Item Percentage Result
1 Pupils work hard to get the highest score. 86.67 Received 2 While playing, students strive to understand
Tajweed law to get the highest score.
86.67 Received 3 The reward system found in this game increases the
motivation of students to learn Tajweed.
80.00 Received 4 Pupils are more focused on the game because they
want to achieve the highest score.
86.67 Received 5 The higher the score obtained implies a clearer
student's understanding of the Tajweed laws.
86.67 Received
Based on Table 5.30, it was found that all the items found under each sub-element for the aspect of sustainability obtained a content validity score of more than 80%. All these items were accepted by experts. High scores indicate that the level of validity of