APPENDIX F: Programming in Python Part 6: Determine the optimal tilt and orientation of the solar panel for the total maximum received solar energy. Number of days, angle X and time equation 141 APPENDIX D: Programming in Python Part 4: Determine the solar energy.
General Introduction
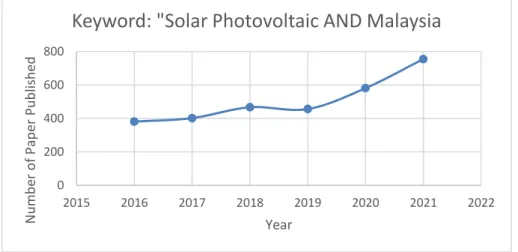
Since solar energy is abundant, it is recommended to explore the benefit and opportunity for the development of solar photovoltaic technology, which is a safer option for the environment. Based on the title "Solar Photovoltaic AND Malaysia", the number of paper produced is increased every year (2016 to 2021), which means that the development and research on solar energy is still ongoing and improved every year.
Importance of the Study
Problem Statement
Aims and Objectives
Scope and Limitation of the Study
Each study is based on estimates and no reference documents were provided to support the simulated results for environmental and economic impact respectively.
Contribution of the Study
Outline of the Report
Gantt Chart
Introduction
As shown in Figure 2.1, the Solcast © time zone format is in Coordinated Universal Time (UTC) format. Coordinated Universal Time (UTC) or can be reformulated as Greenwich Mean Time (GMT), where the time zone of this location defaults to 0 longitude.
Literature Review on Fixed Tilted Angle
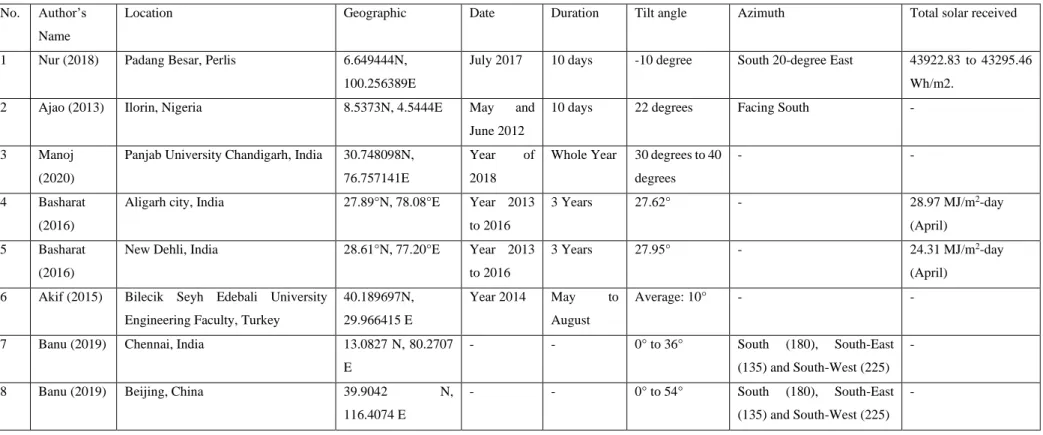
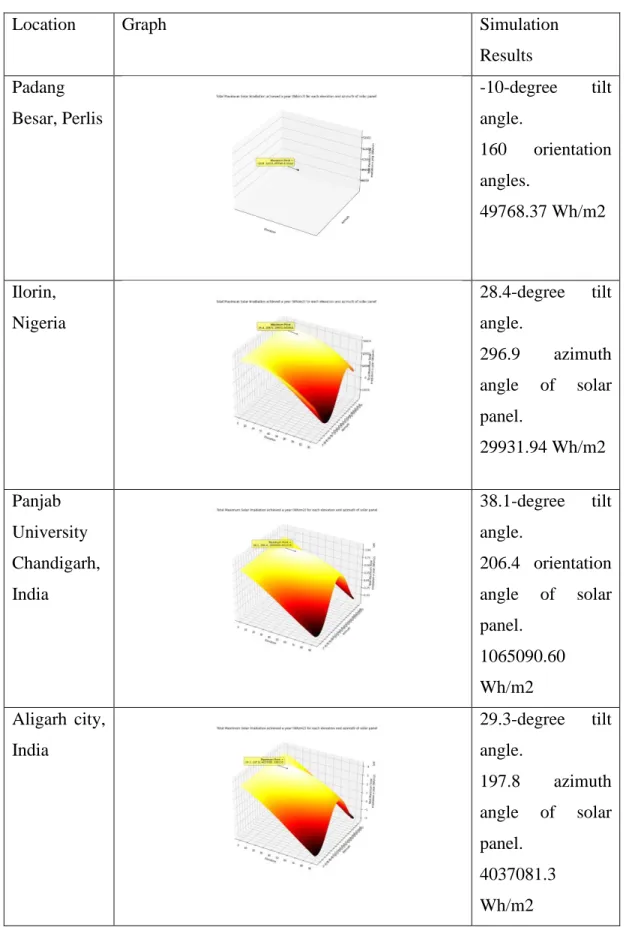
A comparison between a horizontal surface and an inclination angle of the PV panel corresponding to the declination angle of the location. Research conducted by Yunus (2019), with the optimal fixed tilt angle throughout monthly, seasonally and annually.
Method for Determine Cosine Effect Formula for 3D Modelling
In summary, the author determined that the optimum tilt and orientation of the solar panel is -10 degrees and South 20 degrees East in July 2017. A solar panel set up by Ajao (2013), in Nigeria to determine the optimum tilt angle of the solar panel.
Types of Solar Panels in the Market
A comparison in Chapter 4 will be shown to validate and determine whether this design is reliable while performing the accuracy of this design. This is because the results generated are based on theoretical results, so a comparison between theoretical and field results is recommended to further increase the reliability of the results.
Literature Review on Deforestation for Solar Photovoltaic
Reliability of Global Forest Watch
Presence of Carbon Dioxide due to Absent of Forest
Amount of Energy Generation in a year
Calculation of CO2 avoidance
Economic Impact
- Interest Rate and Inflation Rate
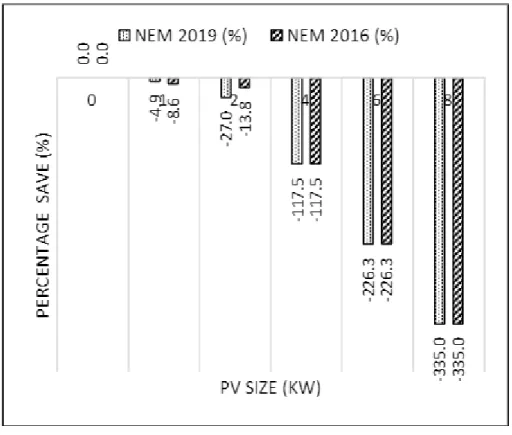
- Feed in Tariff and Net Metering System
- Rates Credit for Electricity Produced
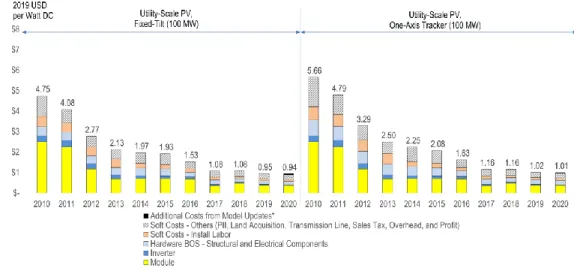
- Investment Cost on Solar PV
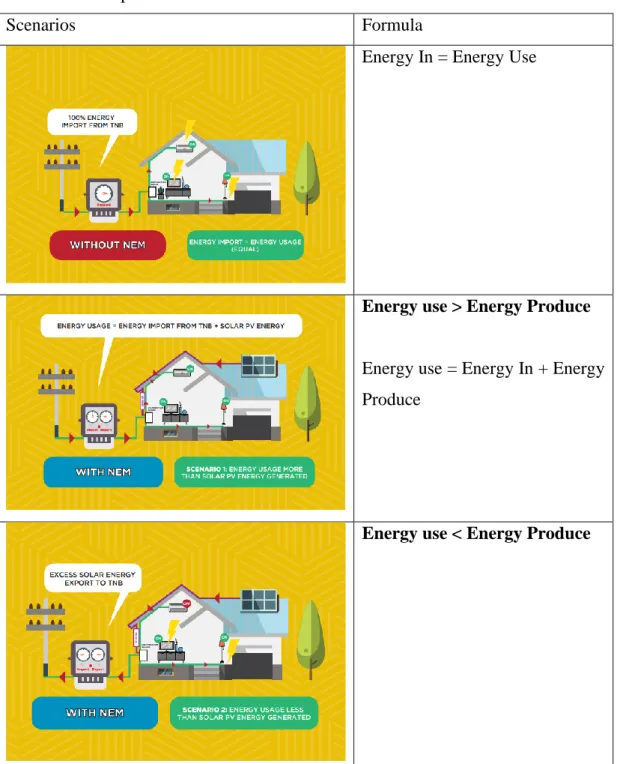
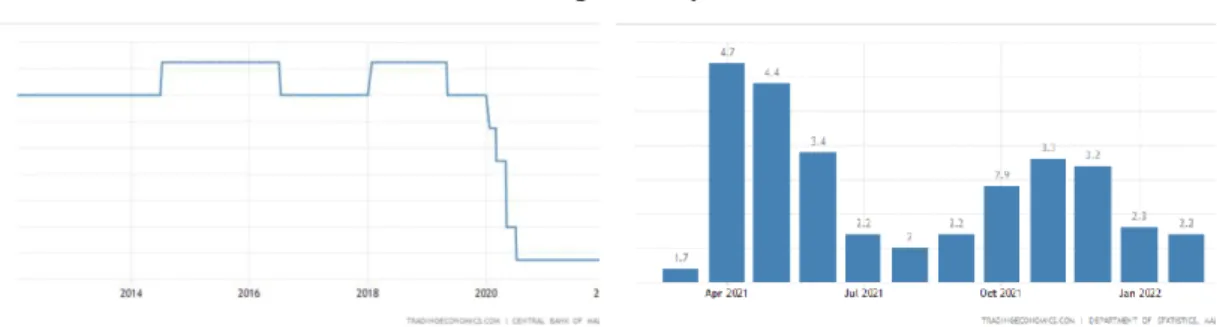
Based on the statistics obtained from TradingEconomics (2022), states that the fuel inflation rate is estimated to be around 2.3% in January 2022. In this project, the Net Metering System will be used for the analysis of economic impact on the solar farm in Malaysia.
Summary
As for the software cost, the installation labor price per watt sums up with planning, shipping and labor costs included. Finally, the annual report was reviewed for the investment cost of the solar farm to estimate the payback period, which can be obtained from the literature review.
Introduction
Metrological Data
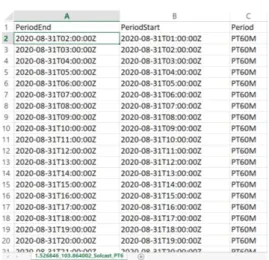
In this project, the metrological data chosen is Solcast© where this company not only provides a reliable and accurate solar radiation data, but also does not require an advance payment to use the service provided by Solcast.
Software
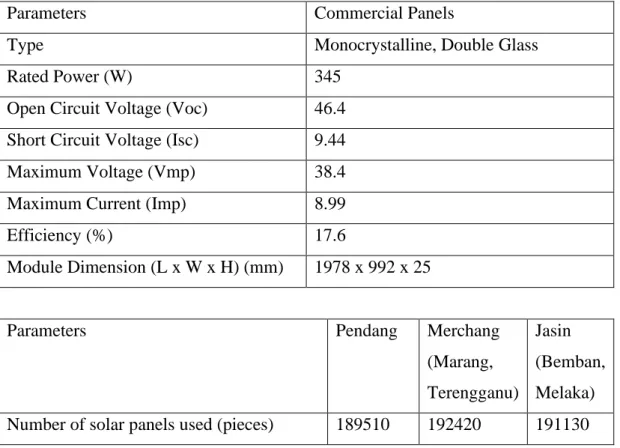
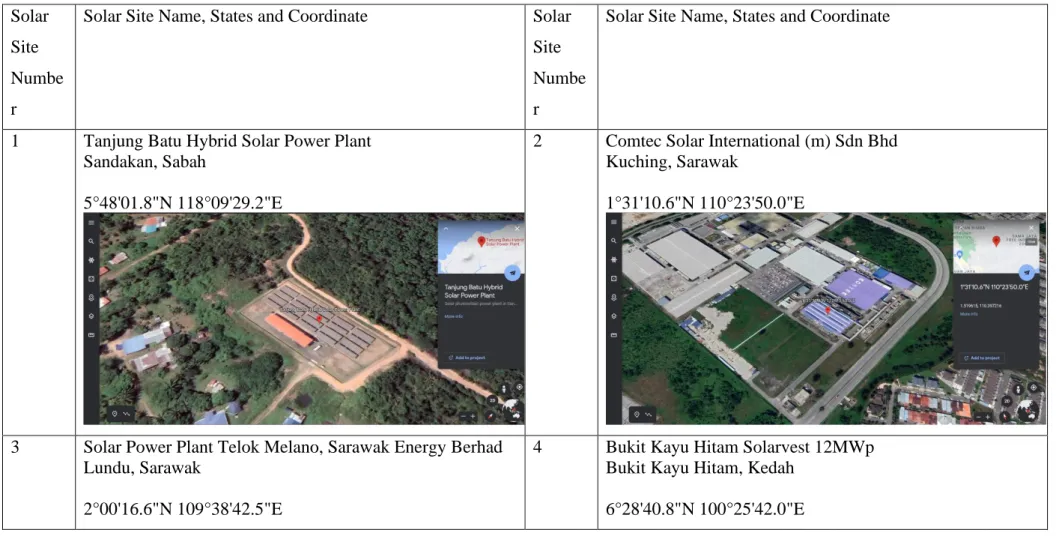
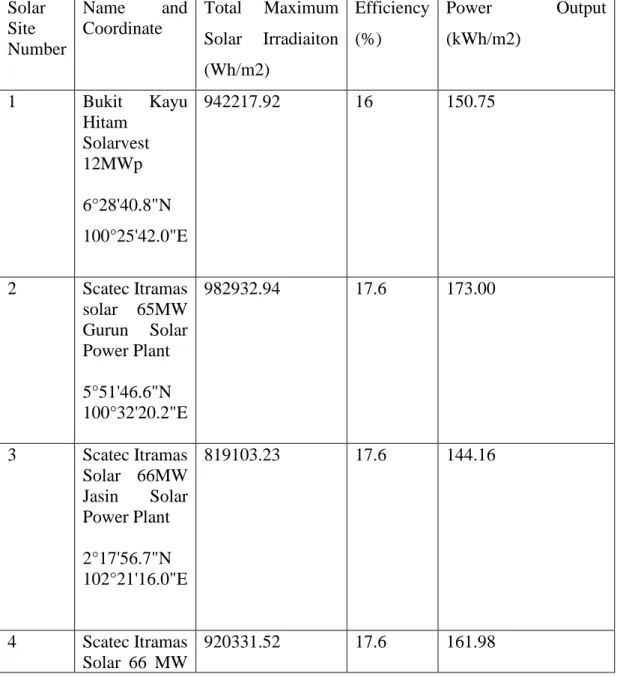
Solar Sites
In addition to the above table, the area for each of the solar sites is also estimated using the "Google Maps Area Calculator Tools", retrieved from Daftlogic (2022). Based on Table 3.3, each of the solar parks may appear to be an unfinished project, showing that only half of the solar park has been completed. Hence, assuming this solar power site is under construction, a study is being conducted on the impact of the deforestation for a large solar farm in Malaysia.
List of Formulas
- Declination angle
- Hour angle
- Equation of time (EOT)
- Solar Time
- Altitude angle
- Azimuth angle
- Zenith Angle
- Daily Solar Irradiation
- Annual Solar Irradiation
- Cosine effect
- Cosine loss experienced by the solar panel
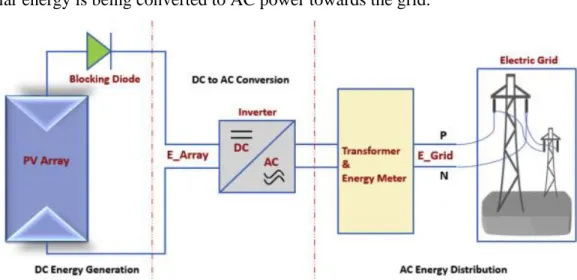
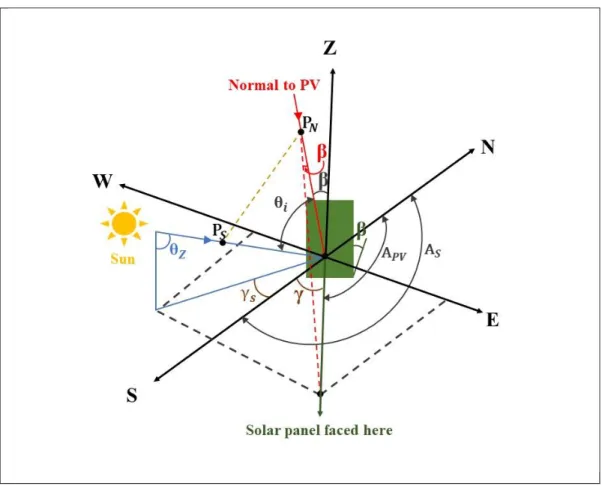
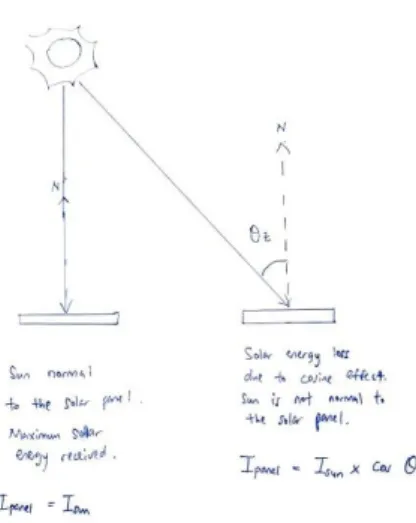
The solar panel is capable of converting incident sunlight into electrical energy for electrical applications connected to the panel. Where 𝐼𝑜,ℎ is the solar radiation received by the solar panel, 𝐼𝑜 is the incident sunlight to the solar panel, 𝜃𝑧 is the zenith angle of the solar position. Therefore, to receive the maximum solar radiation on the solar panel, the solar panel must be tilted according to the position of the sun.
Manual Steps for Downloading Data from Solcast©
The flowchart can be divided into 2 sections, namely the manual steps and the programming steps. Once the latitude and longitude are determined, the value can be entered into the Solcast Database website for downloading the raw data of the received solar energy at the determined locations. There are different types of data that can be obtained where the important parameters of the raw data are Dhi, Dni, Ebh and Ghi.

Determination of Number of Days, Angle X and Equation of Time (EOT)
Next, with the number of days and angle x in degree form, the value can be substituted into the other formula, which is the Equation of Time (EOT) in minutes form, as well as converting the EOT into hours for easier calculation. The local latitude and local longitude can be extracted from the filename of the CSV. With the given standard longitude and local longitude, the solar time for each date time can be determined by the formula.
Determine Sun Position
Then the position of the sun for each date/time in the data can be determined with the parameters number of days, inclination angle, hour_angle, elevation angle, zenith angle and azimuth angle. Therefore, if the elevation angle is less than zero, meaning that the sun is no longer present at the location (night), it is assigned as zero.
Determine Optimum Tilt and Orientation Angle for Solar Panel
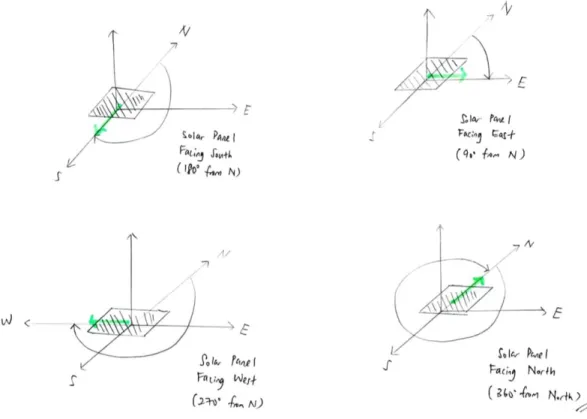
The sun collected on the surface of the solar panel is calculated for the whole year and will be summed up as the total sun received on the surface of the solar panel based on the given setting. The tilt angle range is set from 0 to 90 degrees, where 0 degrees indicates that the solar panel lies flat on the horizontal surface of the earth, while 90 degrees indicates that the solar panel is vertical or perpendicular to the surface of the earth. The obtained value of the tilt table and orientation angle will be displayed in a graph.
Amount of Energy Generation in a Year
Presence of Carbon Dioxide due to Absent of Forest
Calculation of CO2 avoidance
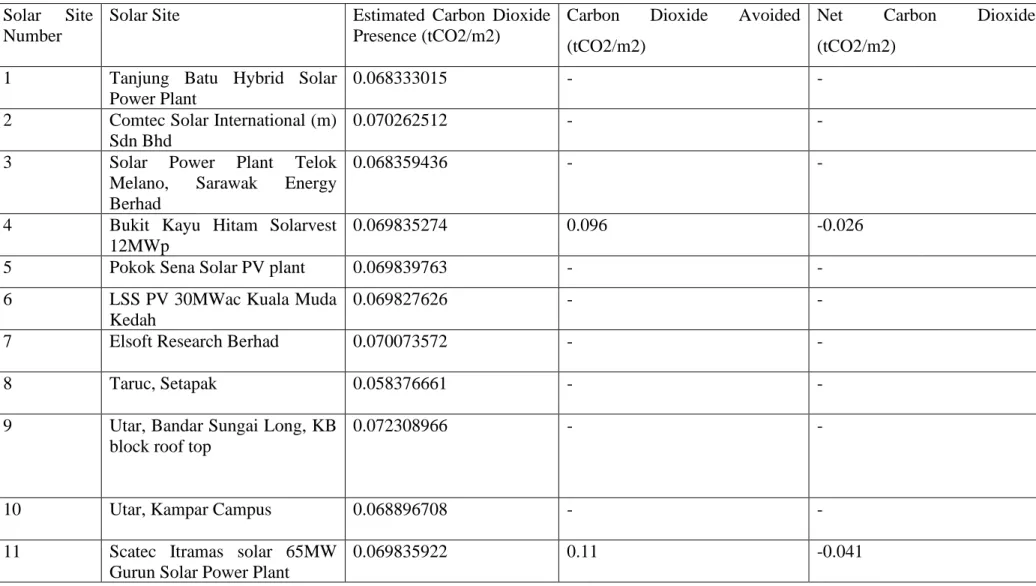
So, for example, to determine the net carbon dioxide in Bukit Kayu Hitam, by substituting the value of CO2 presence by deforestation and CO2 avoided. In summary, for Bukit Kayu Hitam the net carbon dioxide in a year is about −0.0265 tCO2/m2, the negative sign of the value indicates that the amount of carbon dioxide present in the environment due to the deforestation can be recouped by installation of solar panels within one year. If the sign of the value is positive, which means that within a year, the carbon dioxide avoided by the installation of solar panels cannot cover up the carbon dioxide emissions due to deforestation.
Economic Impact
Based on Bukit Kayu Hitam's assessment, with an annual income of RM at an initial investment cost of about RM, the project took 15.26 years to recover the investment cost. When the project reaches operation more than 15.26 years, the project can generate profit.
Summary
Finally, the investment, annual income and payback period will be estimated and tabulated in Chapter 4: RESULTS AND DISCUSSION.
Introduction
Compilation of GHI for Each Solar Sites
Ranking of Solar Sites
Maximum Total Solar Irradiation (Wh/m2) with Optimum Tilt and Orientation Angle
Comparison with On-site results
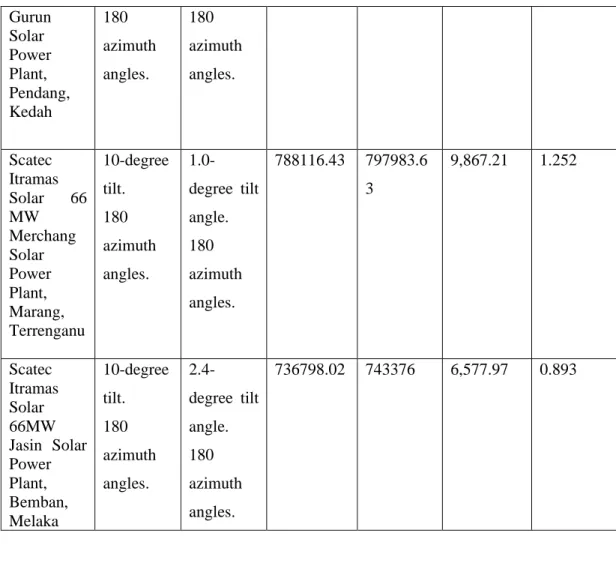
869669.16 Wh/m2 Since the thesis has specified the azimuth angle, the simulation will determine the optimal tilt angle by determining the specified angle. 797983.63 Wh/m2 The simulation determines the optimal tilt angle by recording the specified azimuth angle. 743376 Wh/m2 The thesis provided the azimuth angle and will determine the optimal tilt angle by recording the azimuth angle.
Accuracy of Simulation
Comparison of GHI received with on-site results
By calculating the solar radiation received in one year, the differences are 960.6 Wh/m2, which is equal to 0.9 solar hours of maximum amount. The solar location in Pendang, Kedah is the optimal simulated angle of 6.7 degrees and 180 degrees, with a computer-received solar irradiance of 1478.7 Wh/m2, which is equivalent to 1.4 hours of maximum sunshine. The difference in solar radiation received is 9867.21 Wh/m2, which is equal to 9.8 peak hours of sunshine, with an approximate percentage difference of 1.252%.
Presence of Carbon Dioxide due to Deforestation
For a sunny location in Bukit Kayu Hitam, the optimal simulated angle is 7.3 degrees and 180 degrees. As for Marang's Sun City, Terrengan, the simulated degree is 1.0 tilt angle and 180 azimuth angles. The differences in solar irradiance between the simulated angle and the given angle is 6577.97 Wh/m2, which is equivalent to 6.5 solar hours of peak load, with a percentage difference of 0.893%.
Amount of Energy Generation in a Year
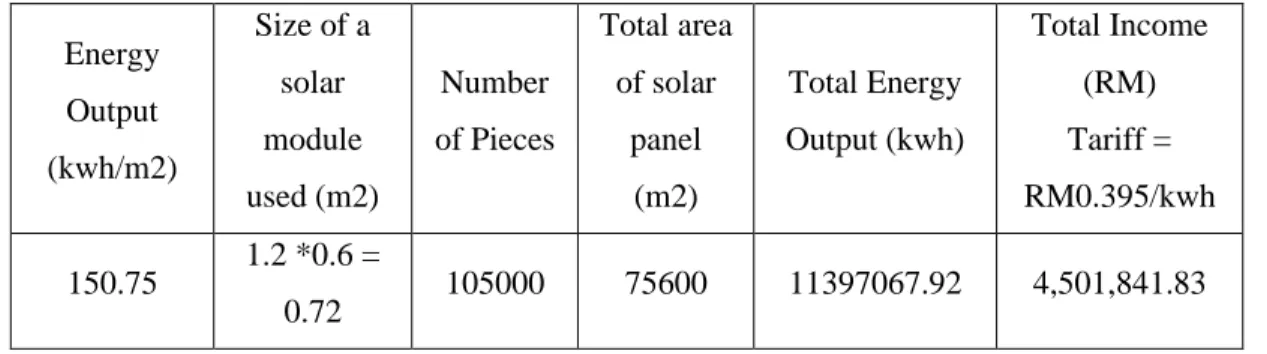
In addition, the power generation also depends on the local climate of the locations, the optimal tilt and azimuth angle. Therefore, Table 4.9 shows each of the solar sites with the estimated CO2 emissions avoided annually, based on the equivalent in Chapter 2. However, for this case study of power generation in a year, the estimate will be made based on the information from the solar panel company.
Calculation of CO2 avoidance
According to the net carbon dioxide calculation, the solar installations with supplied parameters have a comparable value between carbon dioxide emission and carbon dioxide reduction, resulting in a negative net carbon dioxide in a year. One of the reasons that affect the net carbon dioxide is due to the local climate of the solar installations, where the lower the solar radiation, the lower the power. The higher the efficiency of the solar panel, the higher the energy conversion from solar energy to electricity, so the higher the CO2 avoidance in a year.
Economic Impact
Special Case Study on Interest Rate
In this section, assume that a higher interest rate of approximately 6% is imposed on the payback period value, while maintaining an inflation rate of 2.3%. Therefore, comparing the low interest rate and the high interest rate, the payback period for 4 solar sites is shown in Table 4.13. Based on the comparison between the high interest rate and the low interest rate of the country, this will affect the payback period of the invested solar plant.
Summary
Therefore, one of the limitations of the solar park is that the payback period is related to the economy of the country. In summary, to install and build a solar park effectively, with a low payback period, the main parameters to consider are the solar radiation received at the specific location. In addition, since the rate is low, the efficiency of the solar panel used is also important, because the higher the efficiency, the higher the electricity generated, so the higher the income.
Conclusions
Recommendations for future work
Beskikbaar by:
Python Programming Part 9: Estimate the Economic Impact of the Simulation