It is hereby certified that ______Chee Man Hang ID No: __18ACB03448 ) has completed this final year project/dissertation/dissertation* entitled “_Crime Rate Prediction Using Machine Learning_” under the supervision of __ Dr Chang Jing Jing (supervisor) of the Department of ____Information, Information Technology and Technology. I declare that this report entitled “Crime Rate Prediction Using Machine Learning” is my own work, except as cited in the references. I would like to express my sincere gratitude to my final year project supervisor, Chang Jing Jing, for her patience and guidance in helping me complete this crime rate prediction project.
INTRODUCTION
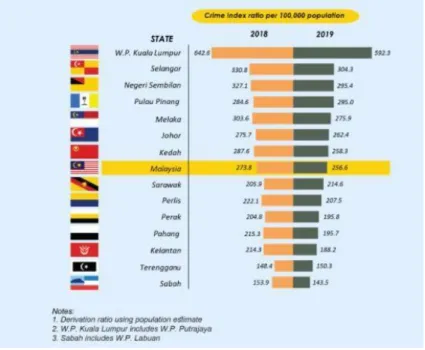
- Brief overview of crime and its effect on a country
- Problem Statement and motivation
- Project Scope and Project Objectives
- Impact, significance and contribution
- Report Organization
Thus, through the implementation of this system, the police can patrol the highest risk areas with preventive patrol, effectively reducing the crime rate and catching more criminals. The advantage of implementing this project is that it can help the police with the analysis of crime hotspots and where crime may occur. This project will produce a type of hotspot mapping for the police to enable them to predict areas and time of the crime with crime type.
LITERATURE REVIEW
Crime rate prediction in the urban environment using social factors
- Brief overview
- Strengths
- Weaknesses
- Recommendation
- Brief overview
- Strengths
- Weaknesses
- Recommendation
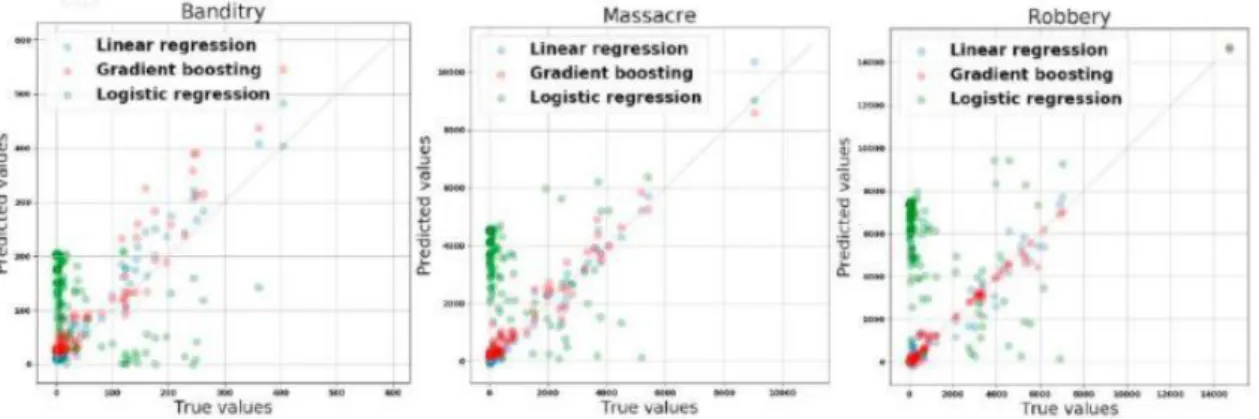
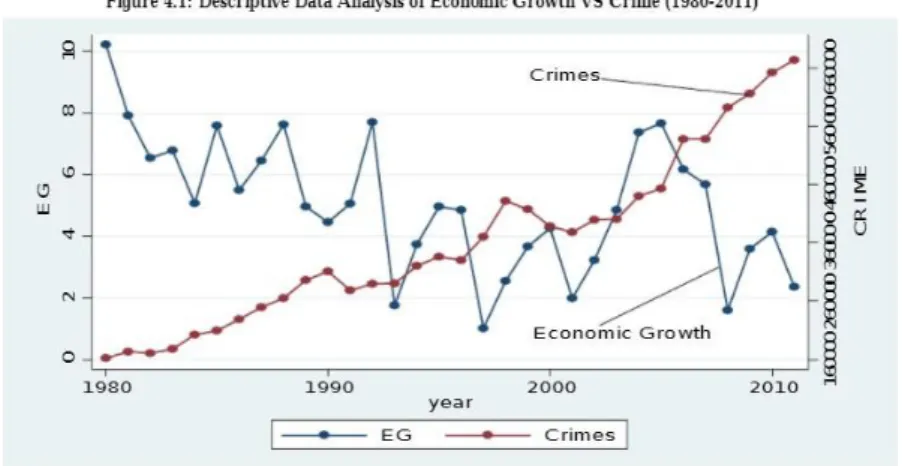
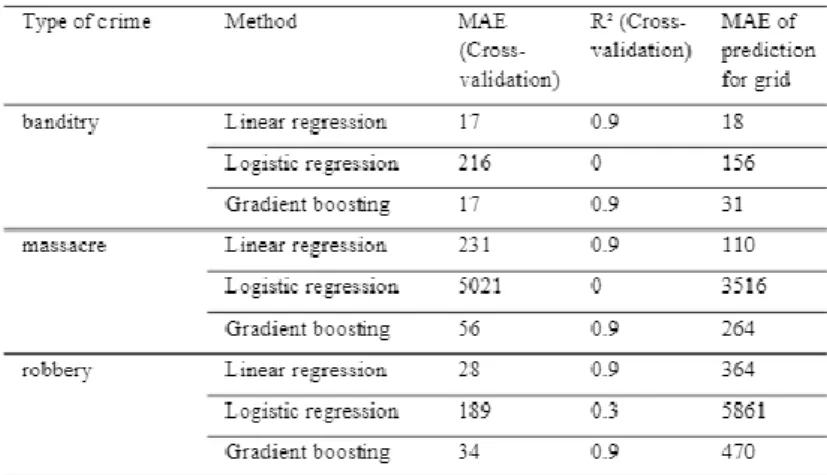
Another strength of the paper is that they indicate that other newspapers pay little attention to the selection of factors that influence crime. For the weakness of this paper, the linear regression models were found to have produced a negative value as observed in the table below for each of the factors. Before the limitations, it turned out that the accuracy of the paper could be higher.
Crime prediction through urban metrics and statistical learning
- Brief Overview
- Strengths
- Weaknesses and Limitations
- Recommendations
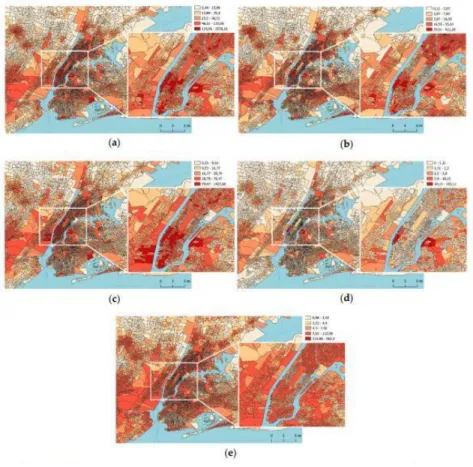
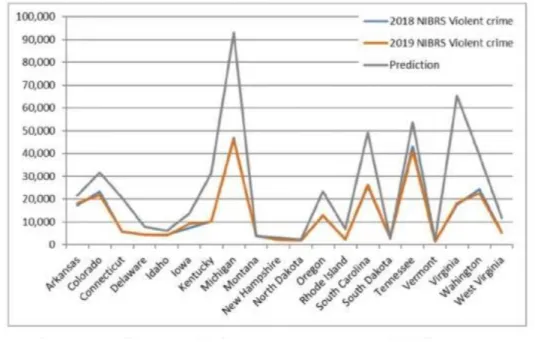
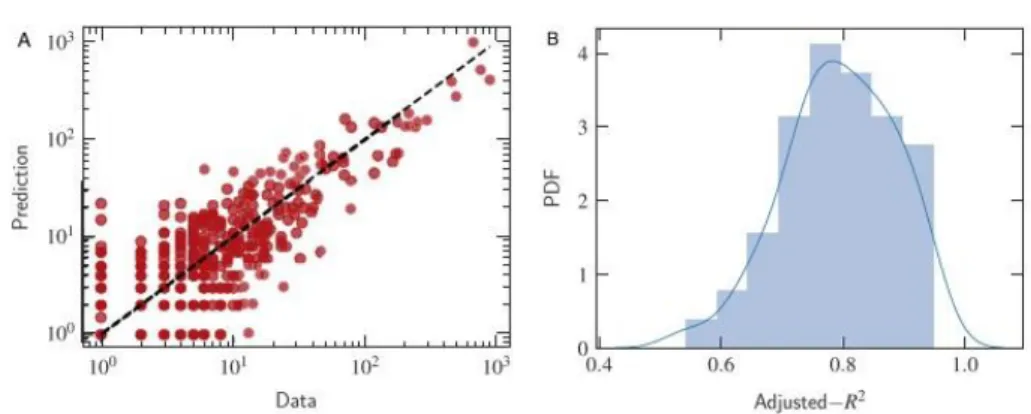
The first figure shows the empirical data versus the random forest forecast used for the realization of the algorithm. Among other things, they found that the random forest algorithm required little data preparation when performing regression. For the limitation of this paper, it was found that they used only one model which was the random forest model.
SYSTEM METHODOLOGY/APPROACH
- Use Case Diagram
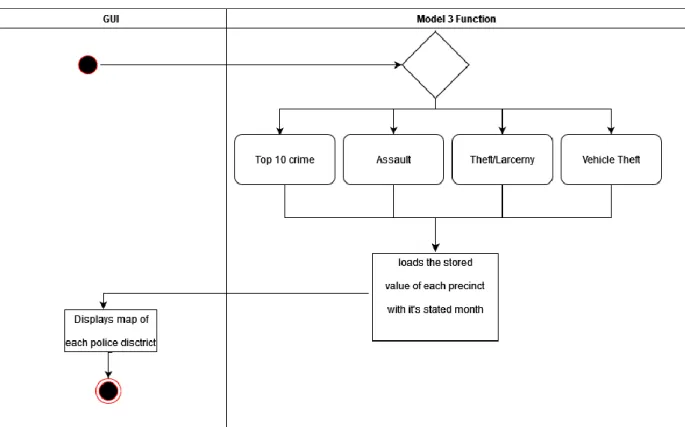
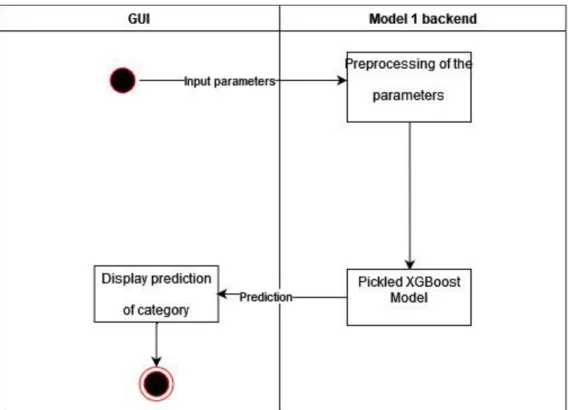
- Activity Diagram
- Crime Category Classifier
- Crime Rate Classifier
- Crime Map Density
- Exploratory Crime Dataset Analysis
- Block Diagram
- Category Classification Model Block Diagram
- Crime Rate Classification Model Block Diagram
- Crime Forecast Block Diagram
- System Architecture Diagram
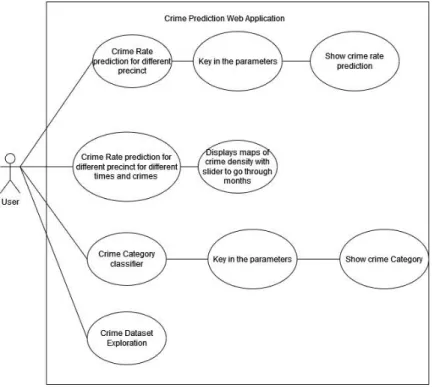
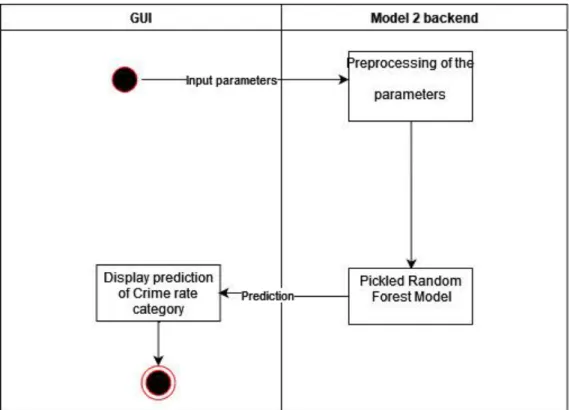
The web application will then proceed to display the predicted category of three crime rates which are "high crime rate", "medium crime rate" and "low crime rate". The model will then be tuned with RandomSearchcv to increase its model accuracy. This will then be fed into a web application that will allow users to research each subsequent month's crime rate from the data set.
METHODS/TECHNOLOGIES INVOLVED
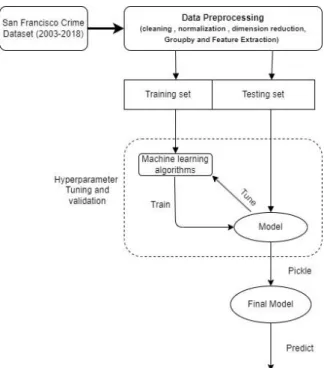
- Methodology
- Classification Pipeline for Model 1
- Classification Pipeline for Model 2
- ARIMA Pipeline for Model 3
- Technology Used
- Laptop Specifications
- Software
- User requirements
- Non-Functional Requirements
- System performance
- Verification plans
- System design
- Crime Category Prediction
- Crime Rate Classification
- Crime Rate Prediction With SARIMAX
- Timeline
In this project, the crime rate classification system is developed using XGBoostRandom Forest and Decision Tree Algorithm. The SARIMAX model is then trained and tested to see how well it predicts the crime rate. The user should be able to analyze the crime density in the city police district based on crime category.
User should be able to analyze hotspot based on time zone of the day and see the crime rate. The system allows users to observe the crime density at different locations in the city. The system should also be able to show the density of the crime rate properly so that the police can know where to be placed easily.
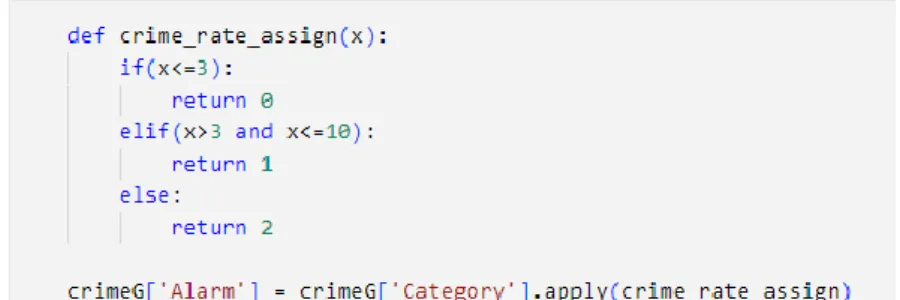
The count will then be divided into 3 categories to be predicted which are "high crime rate", "medium crime rate" and "low crime rate". The Y characteristics will be the crime rate category derived from the crime count, I decided to use the top 10 crime categories. An autocorrelation test is then performed to check for seasonality of the data set based on the lag that is most apparent.
I will then use the .predict function from SARIMAX with the optimal parameters to predict up to one year of crime from the dataset.
SYSTEM IMPLEMENTATION AND EVALUATION
System Implementation for Model 1 Crime Category Classification
Since there are too many categories to reliably predict, I have decided to predict the top 33 which are "THEFT/THEFT", "ASSAULT", "VEHICLE THEFT" and. I chose 2 models to train the models, namely XGBoost and Random Forest. NAPID' and 'VEHICLE THEFT' seem to have a lot of false negatives as they keep coming up in the first column of 'THEFT/THEFT'.
However, in the case of "THEFT/THEFT" and "DRUGS/NARCOTICS" it was able to classify those categories quite well. The Decision Tree classifier seems to perform the worst here as they continued to classify more than half of the "ASSAULT" and "VEHICLE THEFT" records as. For the XGBoost classifier the training and test set is good as it managed to achieve a 67 percent for both macro average and weighted average.
However, as shown below, the models could not classify 1 “ATTACK” and “Vehicle Theft” very well, as the recall and f1 scores are not very high for both the training and testing sets. For the Random Forest Classifier, both the training and test sets underperform XGBoost, scoring only around 62 percent for both macro averages. Similar to XGboost, it could not classify 1 “ATTACK” and 2 “VEHICLE THEFT” very well, and the recall and f1 scores for “ATTACK” are very low, around 0.40 and 0.49 for the training set and 0.31 and 0.38 for the test set. VEHICLE LANDSCAPE” very well as the recall and f1 scores for “ATTACK” are extremely low at around 0.09 and 0.15 for both the training and testing sets.
The pull and f1 score of "VEHICLE THEFT" while better than "ASSAULT" is also very low at around 0.19 and 0.26 for the training set and test set.
System Implementation for Model 2 Crime Hotspot Classification
The upper and lower bounds of the category score are then used to derive the categories to predict what is "high crime rate" and "low crime rate". Low crime rate” is classified as if the crime counts were below 4 during the time. High crime rate was classified when there were more than 10 charges of crime at the given time.
I chose 3 models to train the model namely XGBoost, Random Forest and Decision Tree. First, the XGBoost, Random Forest, and Decision Tree models performed decently on the given dataset. All log losses were decent and none exceeded 1. The best performer in this category is the XGBoost Classifier.
In terms of the Confusion matrix, all three models were unable to classify low and high crime rate well as they seem to classify it as medium crime rate quite often with the decision tree being the worst of all. Although XGBoost did best with the least number of false positives in the high and low crime category. However, the attraction for the high crime category seems to perform the worst at 0.48 although the f1 score remains good.
For Random Forest, while the accuracy of the low and high crime rate category is slightly higher compared to XGBoost, the recall is the worst in the recall for high and low crime rate.
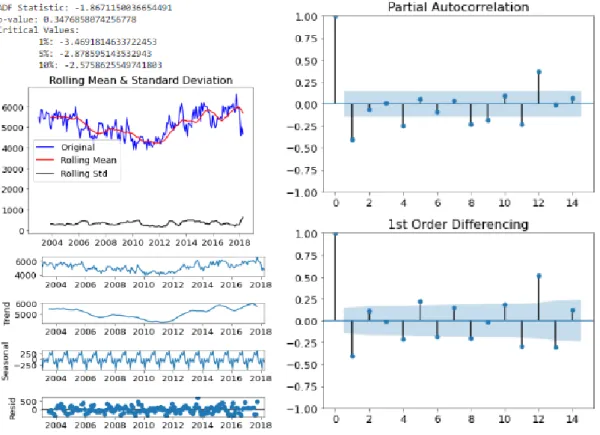
Time Series Forecasting Model SARIMAX
Then the last month is removed from the dataset as it is lower than all the other months as shown above. Next, the Dickey-Fuller test is performed to obtain the ADF statistic, the P-value, and the critical value. For seasonality, I chose 12 as that was the lag observed from the autocorrelation test.
Then to make sure I chose the best hyperparameters I use the auto_arima function which helps determine the best pdq PDQ values. First, to create a map to predict crime statistics for each month, I first downloaded a geojson file from https://data.sfgov.org/Public-Safety/Current-Police-Districts/wkhw-cjsf to get the geometry for each police district. Then I used a function that would select all rows that have the policy circle and put it into a data frame.
This then groups all the unique police districts and dates which will then be made into a frequency count as above. The model is then trained and used to predict the next year's monthly statistics for the police districts. This concatenated output is then used in the chloropleth_mapbox function to form a map of the statistics with a monthly slider.
These outputs are then saved as an html which will then be used in the web application.
Exploratory Dataset Analysis
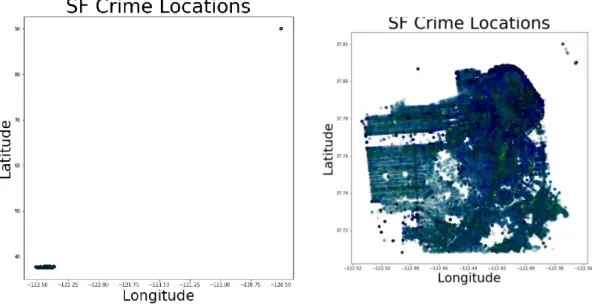
The category column is changed to count of values to be visualized as either a histogram or a pie chart. The figures above show the implementation of the visualizations for the map based on the time entered. The concatenated date and time is then used to match the slider input from the user, which is the hour, year, and month.
This then produces a map with all the points on the map, as shown in Figure 5.4.6.
Implementation issue and challenges
SYSTEM EVALUATION AND DISCUSSION
System Testing
- System Testing for Model 1 Crime Category Classification
- System Testing for Model 2 Crime Rate Classification
- System Testing for SARIMAX page
- System Testing for Exploratory dataset analysis page
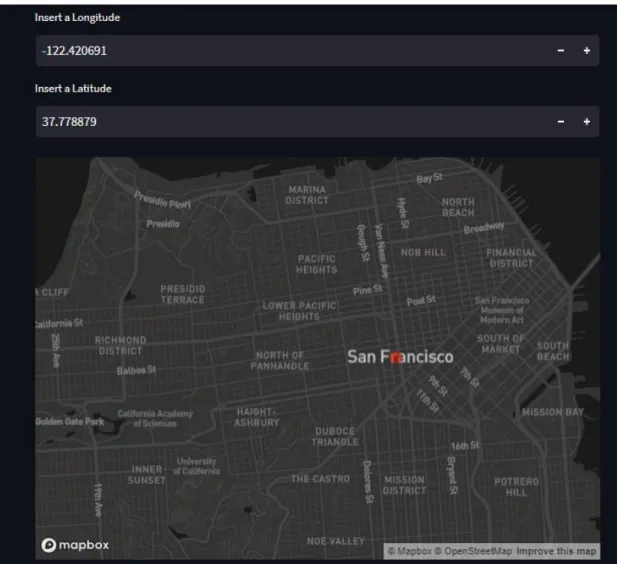
The user can enter the longitude and latitude and check that the points on the map are correct. The user can choose between 4 maps for different types of crimes as seen in the titles. The user can drag up to the months to see the projected statistics for each month for each district.
The user can hover over a county and get the predicted crime rate for that month. On this page, the user can choose between two types of visualization to visualize a category in a dataset. The user can also enter the year, month and hour of the day to explore crime density by hour, month and year.
Objectives Evaluation
CONCLUSION
Project review
Novelties and Contributions
Future Work
Ali/publication/275019421_Crime_and_Economic_Growth_in_Developing_Countrie s_Evidence_from_Pakistan/links/552e67070cf2acd38cb93de5/Crime-and-Economic-Growth-in-Developing-Countries-Evidence-from-Pakistan.pdf. Hidayat, »Razmerje med kriminalom in gospodarsko rastjo v Indoneziji: KNE Social Sciences,« KNE Publishing, 2019. Ingilevich/publication/327901578_Crime_rate_prediction_in_the_urban_environment_using_social_factors/links/5dd848d8458515dc2f4589ce/Crime-rate-pred iction-in-the-urban-environment-using-social-factors.pdf.
Created a new model for crime rate prediction classification - Added Decision Tree Model to the mix. Hyperparameter tuning and finding what else to use to evaluate models -Use SARIMAX for extra crime rate prediction. Program / Course BACHELOR OF COMPUTER SCIENCE (HONOURS) Title of Final Year Project Crime rate prediction using machine learning.
Note Supervisor/candidate(s) are required to deliver a soft copy of the full set of the originality report to the faculty/department. Based on the above findings, I hereby declare that I am satisfied with the originality of the final project report submitted by my students as mentioned above. Form Title: Supervisor's Comments on Originality Report Generated by Turnitin for Final Project Report Submission (for undergraduate programs).
All references in bibliography are cited in the thesis, especially in the literature review chapter.