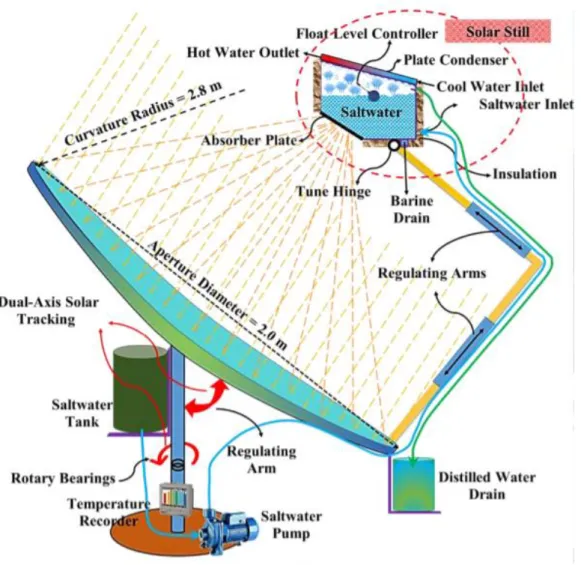
Further studies are being conducted to identify the effect of Phase Change Material (PCM) used as energy storage of the designed passive solar installation. 25 2.5 Difference between FRL and conventional lens 28 2.6 Schematic diagram of the conventional solar still and PCM.
General Introduction
It needs to be further improved to meet the required productivity (Dawoud and Al Mulla, 2012; Shatat et al., 2016). PCM has been used as a combination of other enhancement methods for its high compatibility (Kabeel et al., 2018a; Yousef et al., 2019).
Importance of Study
Problem Statement
However, the work related to the combination of PCM and FRL based CSP on passive solar energy is still rarely reported in the available Journal database. The productivity of solar still with different configurations was investigated to determine the effect of FRL, PCM and both together on passive solar stills.
Aim and Objectives
In passive solar stills, the PCM is used as a stationary heat storage tank attached to the pool. Developed a portable passive solar desalination system coupled with Fresnel lens and phase change material.
Scope and Limitation of the Study
To study the performance of Fresnel lens and phase change material in solar desalination under tropical climate. Parameters such as ambient temperature, wind speed, cloud movements can still cause minor influences on the accuracy of the result.
Contribution of Study
Outline of the Report
Introduction
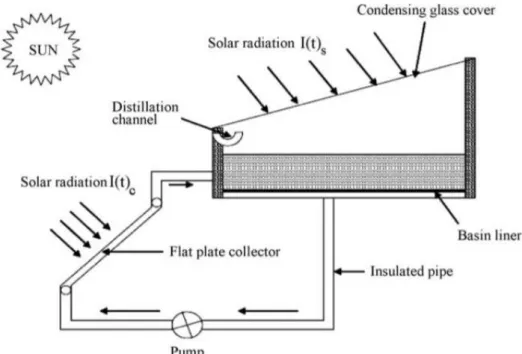
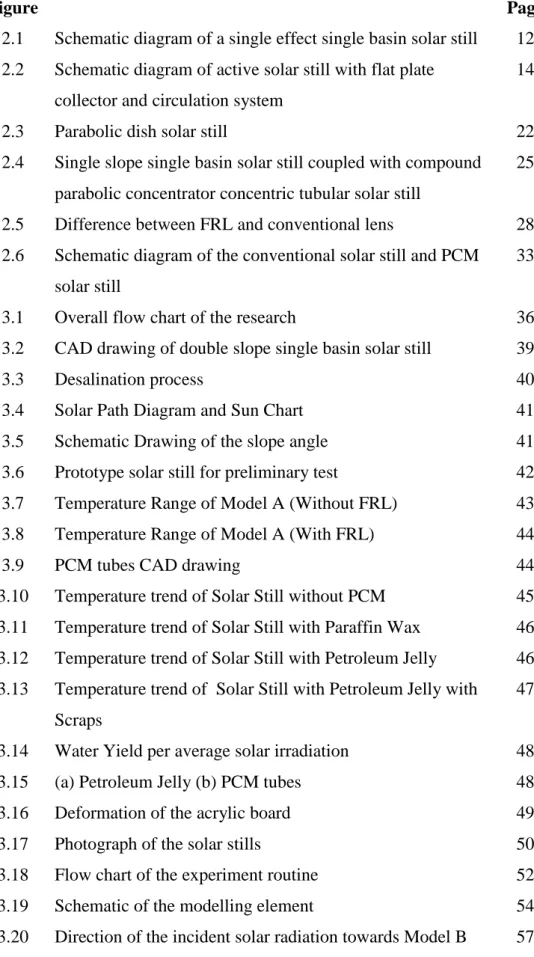
Solar Desalination
- Indirect Solar Desalination
- Direct Solar Desalination
- Active Solar Still
- Multi-Effect Desalination (MED)
The heat is transferred from wastewater to the solar power through a heat exchanger and circulation system (Sampathkumar et al., 2010). Regenerative active solar still increases the water yield output by increasing the condensation rate of the sunscreen (Sampathkumar et al., 2010).
Variable Affecting the Performance of Solar Still
Free Surface Area
The surface area of the water exposed to the air, also known as the free surface area, determines the evaporation rate of the solar thermal system (Samuel et al., 2016). The Wick solar still was developed to achieve a significantly high free surface area of feed water through capillary action (Samuel et al., 2016).
Slope Related Parameters
The temperature difference between the feed water and the slope cover is directly proportional to the condensation rate of the solar cell (Morad et al., 2017). The tilt angle of the transparent is optimal when it is closed to the latitude angle of the experimental area (Khalifa, 2011; El-Samadony et al., 2016).
Climate Condition
Numerous studies have been done to identify the ideal tilt angle for different types of solar stations. Thus, the optimal angle of inclination of the sun should follow the latitude of the research location.
Existing Approaches to Improve Performance of Passive Solar Still
- Wick Type Solar Still
- Finned Type Solar Still
- Solar Reflector
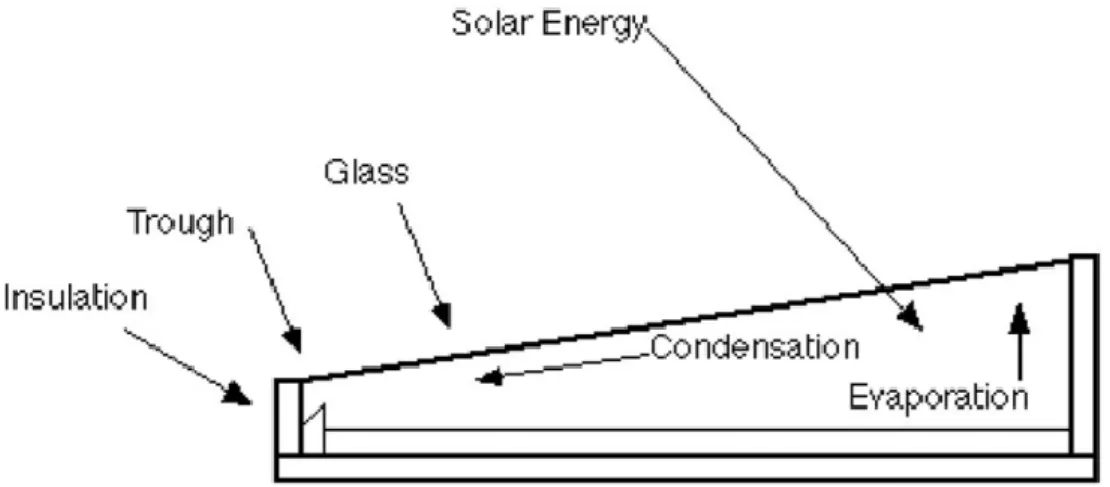
- Solar Dish Concentrator
- Parabolic Trough Concentrator (PTC)
- The Weakness of Conventional CSP
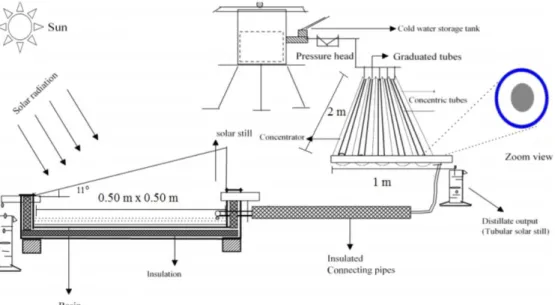
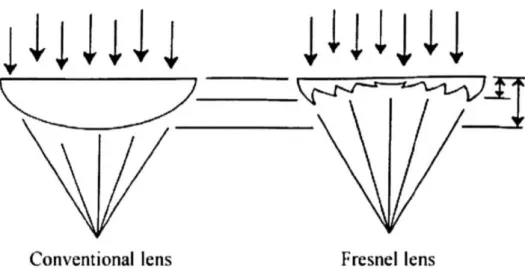
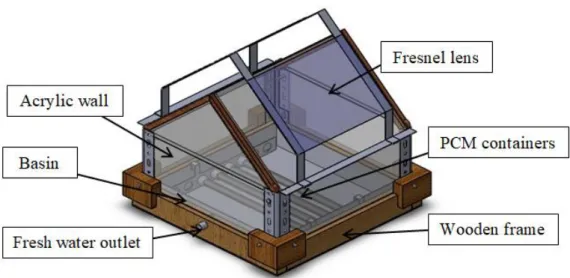
- Fresnel Lens (FRL)
Mirrors are placed on the inner walls (back and sides) of the modified solar energy boiler. The solstice basin was at the focus of a huge parabolic dish.
Thermal Energy Storage (TES)
Performance of PCM Solar Still
The solar power with PCM is found to be 67.18% higher than conventional solar power in terms of productivity. The water yield of the conventional pyramid and modified pyramid equipment is 3.5 L/m2 day and 6.6 L/m2 day respectively, which the modified still has 87.4% improvement in water productivity.
Summary
The point focus Fresnel lens was chosen to be used as the collector of the solar array. Organic PCM paraffin wax was chosen to be used as TES for solar cell due to its high thermal storage capacity contributed to its sensible and latent heat storage.
Introduction
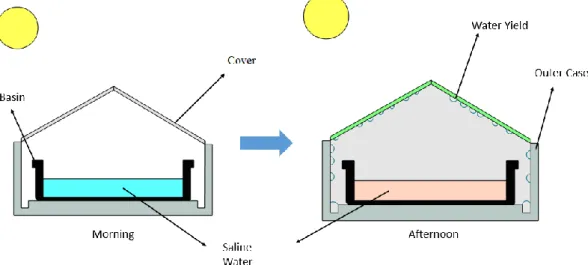
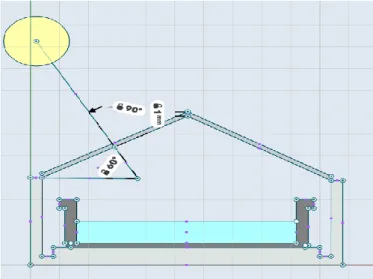
FRL Solar Still Double Spee Single Basin Passive Solar Still connected only to Fresnel lens. A key factor in the design of an inclined solar device is the angle of inclination of the transparent cover. The slope angle of passive solar energy still determines the solar energy received by the absorber (loss due to slope reflectivity).
Preliminary Test
PCM Selection
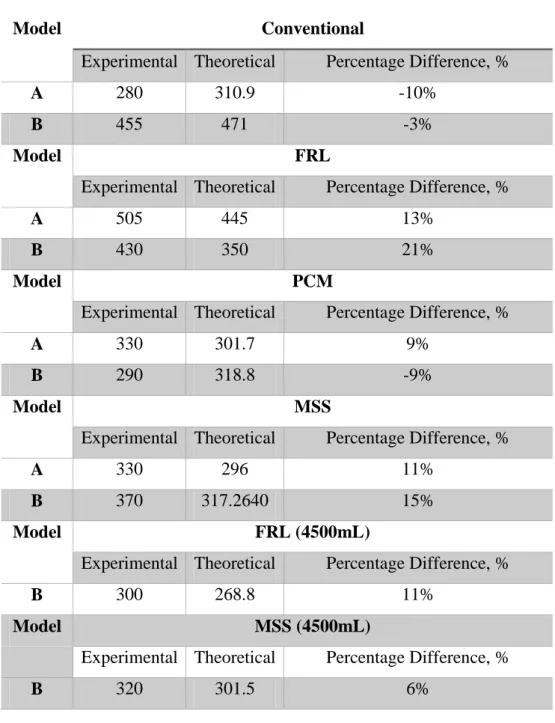
According to the results of previous research, with the same solar still setup, petroleum jelly (paraffin wax with a low melting point) with a melting point of 37 ˚C mixed with aluminum scrap has the highest improvement compared to paraffin wax with a melting point of 58 ˚C (Bahar et al ., 2019). The paraffin wax used in the experiment has a melting point of 58 ˚C, while petroleum jelly has a melting point of 37 ˚C. With regard to water yield per average solar irradiance Figure 3.14 shows that the sun still associated with Vaseline has the highest increase of 47.9%.
Experimental Procedures
The glass material of the slope in both solar has been replaced with glass instead of acrylic. The water yield was collected in a container attached to the outlet of the solar power supply. It should be noted that conducting the above experiments on different days will not affect the purpose of the experiment (Abujazar, et al., 2018).
Theoretical Calculation
The elevation angle used in the calculation was obtained using the sun path diagram in Figure 3.4. Using Model B as an example, the area of solar flux falling on it can be calculated using the example in Appendix B. Referring to the method of Moffat, uncertainty analysis was carried out to determine the uncertainty in productivity and efficiency of the sunscreens (Moffat, 1988).
Introduction
Therefore, in this study, the productivity and efficiency of distillers are included in the comparison. A comparison of water yield alone would not provide a clear picture of the influence of FRL and PCM, as the experiments were conducted on different days. Solar productivity and efficiency still take into account the amount of solar energy received, so comparing these parameters can provide an accurate performance result on a daily basis.
Conventional Solar Still
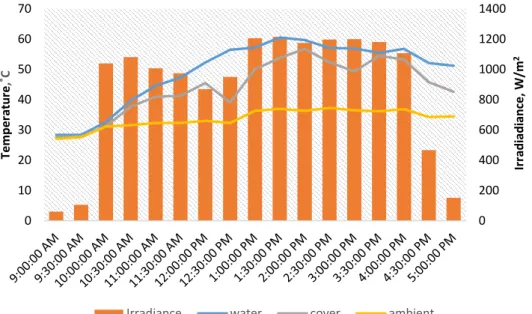
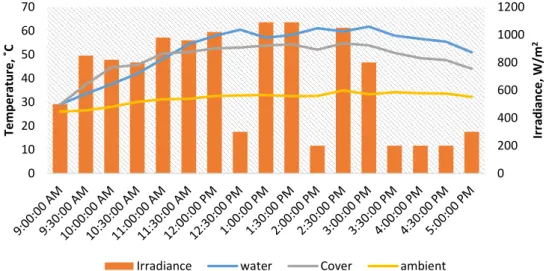
The first graph illustrated the temperature and solar irradiance of the desalination system over time for Model A, while the second graph illustrated the same set of data for Model B. It can be noted that solar irradiance has a direct influence on water temperature and on the water temperature. temperature of the glass cover. The productivity and efficiency obtained in conventional Models A and B were used as a reference for other experiments to identify the improvement and effect of the change.
Fresnel Lens Solar Still
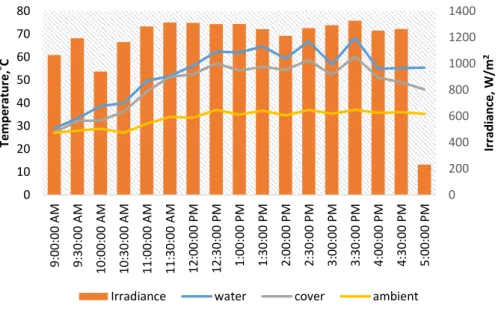
Figures 4.4 and 4.5 show the desalination system temperature versus FRL time of Model A and Model B throughout the experiment. On the other hand, it can be observed that the water temperature in both solar stills with the presented FRL fluctuates significantly depending on the solar irradiation at a given time. The solar energy received by FRL model A and model B throughout the experiment was 6464.67 kJ and 2646.22 kJ, respectively.
Phase Change Material Solar Still
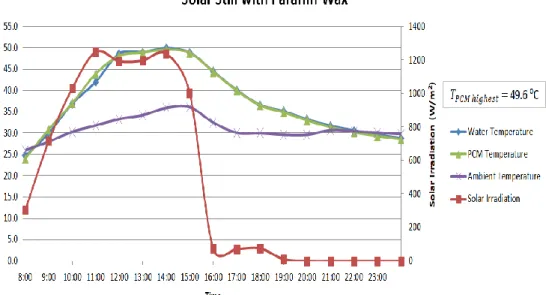
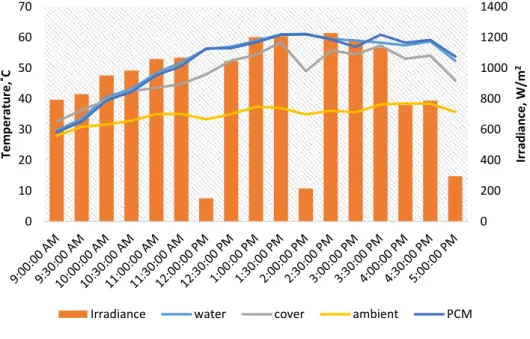
It can be observed that the temperature of PCM was initially lower, but very close to the water temperature. The effect of PCM can be observed at 12:00, 14:00 and 15:30, when the temperature of PCM is higher than the feed water. The effect of PCM can be observed at 12:30 pm and 3:00 pm where solar radiation decreased for various reasons.
Combination of Fresnel Lens and Phase Change Material
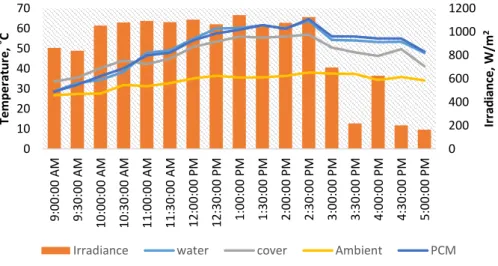
The solar energy received by PCM Model A and Model B throughout the experiment was 4795.42 kJ and 2181.81 kJ, respectively. Despite the performance of FRL and PCM on the water temperature, the productivity and efficiency of MSS model A and B were still lower than FRL A. The solar energy received by MSS Model A and Model B during the whole experiment was 4702.52 kJ and 2589 .53 kJ , respectively.
Effect of Water Volume
Modified solar photos have their productivity and efficiency fall between the FRL solar season and the PCM solar season. In terms of productivity and efficiency, unlike the FRL Model B, the MSS Model B performs better at higher water volumes. Followed by PCM Solar Still, whose improvement in terms of productivity and efficiency is negligible.
Introduction
Theoretical Model
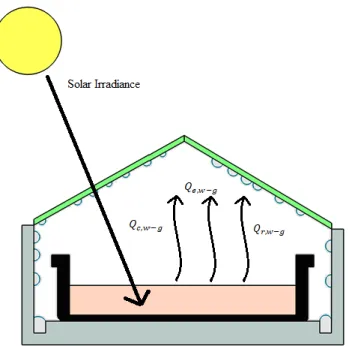
In theory, the shaded area (glass cover) below the FRL will keep out the sun's rays, making part of the cover at a low temperature. In contrast, canopy temperature was recorded on the other side of the slope, with a relatively higher temperature on the shaded slope. In other words, the shaded area of the lid increases the rate of condensation, thereby increasing the efficiency at the same time.
Effect of Fresnel Lens
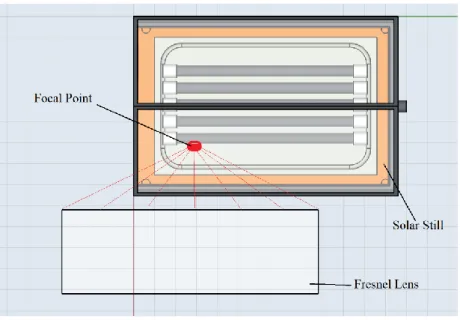
The FRL is placed slightly off center, but at the same time ensures that the focal point is on the basin. Boiling of feed water is not included in the mathematical model because it is impossible to measure the temperature of the focal point throughout the experiment. Anyway, boiling feed water at the focal point did indeed improve the productivity of the solar power plant.
Effect of Phase Change Material
Fully Submerged PCM Tube
In experiments where 4500 mL of feed water is used, the PCM tubes are completely submerged in the salt water. In contrast to the previous result, MSS Model B with 4500 ml saline has improved performance. As reflected in the result, the potential of PCM was shown when PCM is fully immersed in the salt water.
Combination of Fresnel Lens and Phase Change Material
Mixed Solar Still in the Research
The exposed PCM did not fulfill its main purpose as thermal storage as part of the heat absorbed from the salt water was continuously transferred to the air and glass cover by convective heat transfer. When solar radiation dropped, the temperature of saltwater dropped drastically because the PCM failed to return the heat to the water. The stored heat can be effectively discharged back to salt water in the form of sensible heat and latent heat.
Improvement on Mixed Solar Still
Quality of the Distillate
Cost of the Distillate
At the same time, the effect of FRL, PCM and the combination of both on passive solar has still been debated. The design of the PCM tanks has proven to be a crucial consideration when designing a PCM coupled solar system. The potential of combining both FRL and PCM on passive solar cell is still significantly proven.
Conclusion
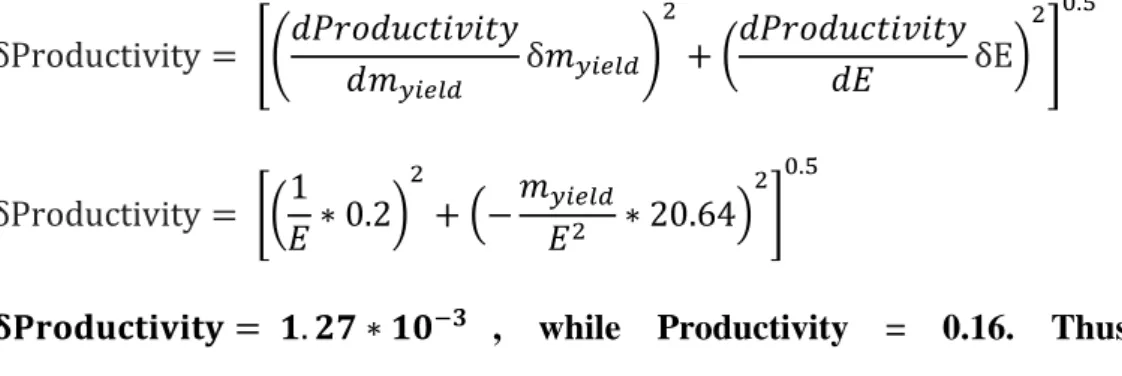
By comparing both solar stills, it can be concluded that among the mentioned modifications, FRL alone provides the highest productivity and efficiency when combined with passive double-tilted solar stills. Model B incorporated with FRL has the highest productivity of 0.16 g/kJ and thermal efficiency of up to 37%. It can be concluded that the Fresnel lens is feasible as a CSP on passive solar still, while the combination of Fresnel lens and PCM is viable when the heat transfer between brine and PCM is maximized.
Recommendation for Future Work
Experimental study of the effect of coupling a dual slope solar parabolic trough collector on performance. Improving solar energy performance still by using PCM as a thermal storage medium under Egyptian conditions. Improving the Performance of a Single Basin, Single Slope Solar Panel Using a Fresnel Lens: Experimental Investigation.
Investigation of the effect of the Fresnel lens on the performance of the double-tilted solar pool. An experimental investigation of the performance of single-slope solar cell still integrated with a PCM-based pin-finned heatsink.