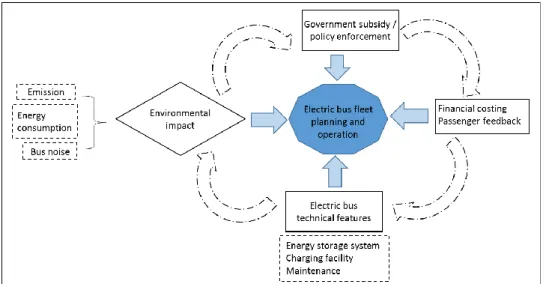
The assessment of environmental performance of the electric bus industry includes several environmental factors (energy consumption, emission and noise) as well as numerous influencing aspects (government policy and subsidy enforcement, passengers' feedback and response, bus technical characteristics and financial costs) that. And various improvement strategies are proposed to improve the environmental performance of electric bus operations in terms of Green Performance Index (GPI). With the help of the green performance indicator, a greener fleet plan and operation of electric buses can be formed.
Problem Statements
Thus, the electric bus is proposed, which is one of the invented technologies to replace the conventional bus as well as being environmentally friendly (Teoh et al., 2018; Pojani and Stead, 2015;. Electric buses need electricity to operate, and the source of electricity production and - production could be one of the concerns in relation to the environmental issue, therefore it can be one of the input for the environmental performance assessment on electric buses, which is an essential tool for the bus operator to refer to when making decision on planning and operating electric buses.
Significance of Study
Hypothesis: The development of the decision process can help the bus operator to have proper and better planning for the electric bus industry. In the first part, three sets of weights are proposed to quantify the green performance of the electric bus industry. There have been several types of batteries since the invention of the electric bus in the 1880s.
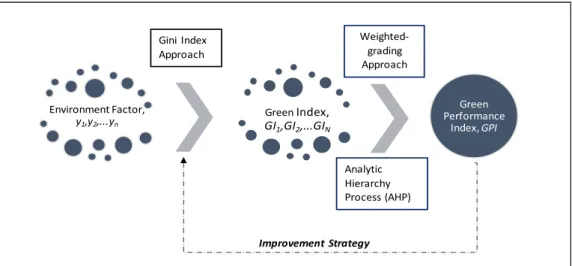
The environmental benefit of the electric bus has become one of the main motivations for the electrification of transport (Poullikkas, 2015; Zivanovic and Nikolic, 2012). Yet there is no measurement of the environmental performance of the planning and operation of the electric bus fleet. Green Performance Index (GPI) consists of the combination of three indices which are Green Energy Index (GEI), Green Emission Index (GMI) and Green Noise Index (GNI). The formula for the Green Performance Index, GPI is stated as follows:. ) 11.
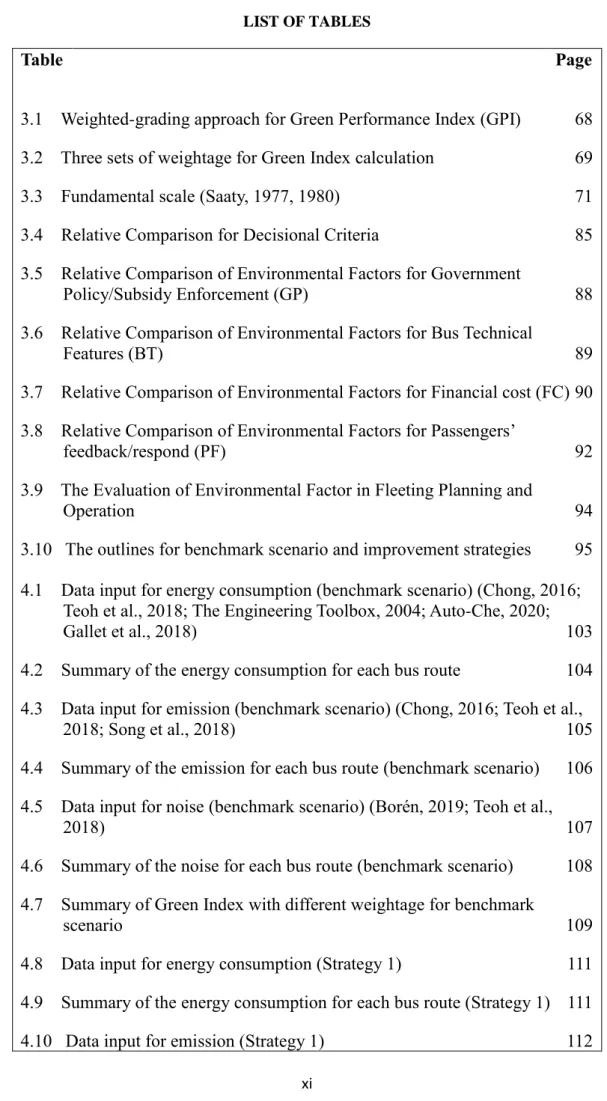
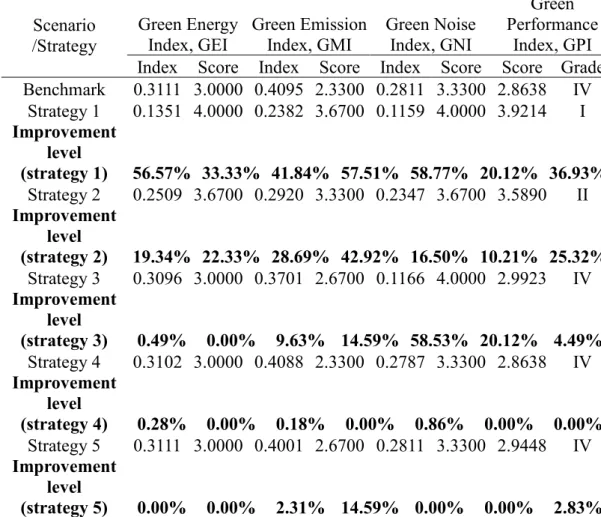
A summary of the green indices (score and rating) with different weights is shown in Table 4.7. Table 4.45 shows a summary of the total noise level for the comparison scenario and all improvement strategies. This is due to using the same amount and frequency of buses as in the comparison scenario.
This indicates that strategy 1 (increase the load factor) can lead to a greener performance of the bus operation. In contrast, the application of a different charging facility (from slow charging to fast charging) on the selected bus routes has no significant impact on further improving the green performance of the electric bus operation. The grade of the GPI (without AHP) for strategy 3 appears to be better in both score and grade compared to the GPI (with AHP).
With the newly proposed method, this study is able to quantify the environmental performance and operational planning of the electric bus fleet.
Research Scope
Research Objectives
Thesis Overview
LITERATURE REVIEW 16
An Overview of Electric Bus
Electric Battery 24
The battery plays a very important role for an electric bus, as it provides the primary electrical energy for the operation of the bus (Lorenzo et al., 2014). The necessary electrical energy is stored in a battery installed in the electric bus. Nevertheless, the environmental benefit of the electric bus has become a motivational key for the electrification of transport (Poullikkas, 2015; Zivanovic et al., 2012).
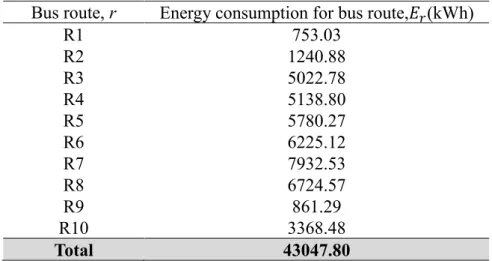
Energy Consumption 33
The emission of an electric bus is an indirect pollutant generated during the electricity generation process (namely WTT), whereby the indirect emission from the previous process is not taken into account (Song et al., 2018). Compared to a diesel bus, an electric bus can reduce the noise level due to the absence of mechanical parts (Laib et al., 2019). In general, three types of noise (external noise, internal noise and internal noise) are produced during the operation of an electric bus.
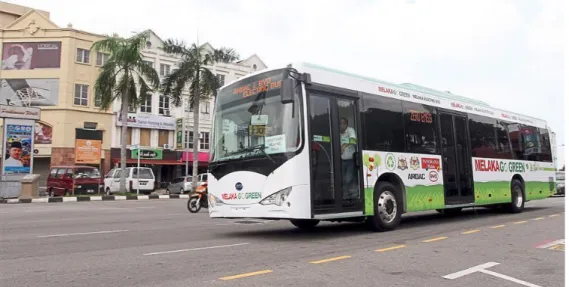
Application of Electric Bus in Malaysia 40
As part of the Green Technology Application for the Development Low Carbon Cities (GTALCC) project involving the education sector, Universiti Teknologi Malaysia has been selected as the first university to use electrically powered buses on its campus as part of its environmental conservation efforts. efforts (Ahmad, 2018). In 2015, 98% of the world's total number of electric buses was deployed in China, making China the leader in the global electric bus market (He et al., 2018). The initial cost of an electric bus has been one of the biggest concerns for the transportation company in the United States (Marshall, 2019).
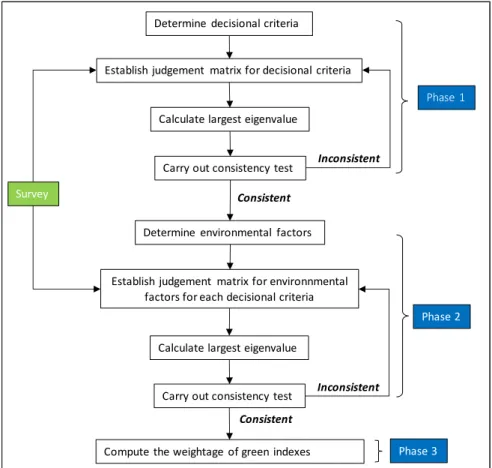
Analytic Hierarchy Process
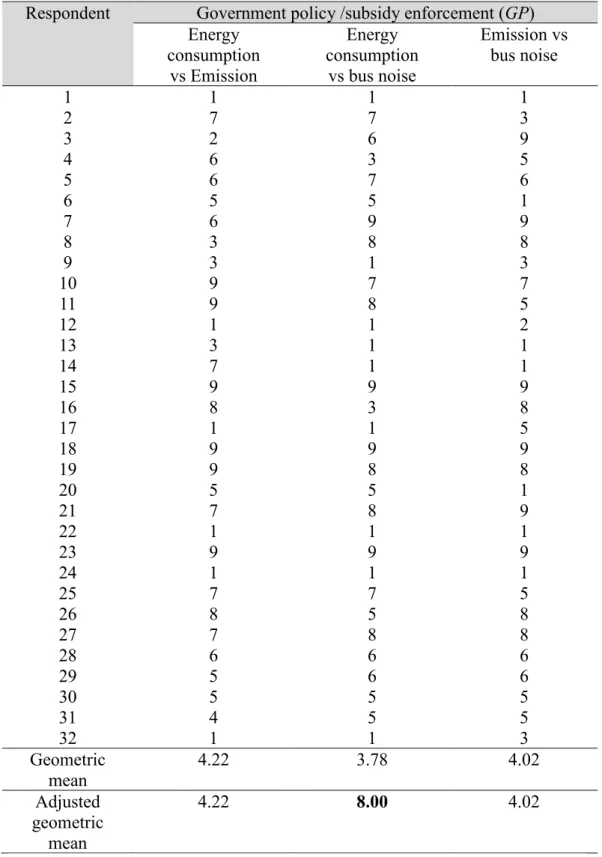
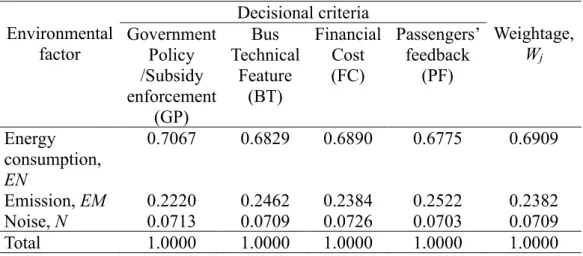
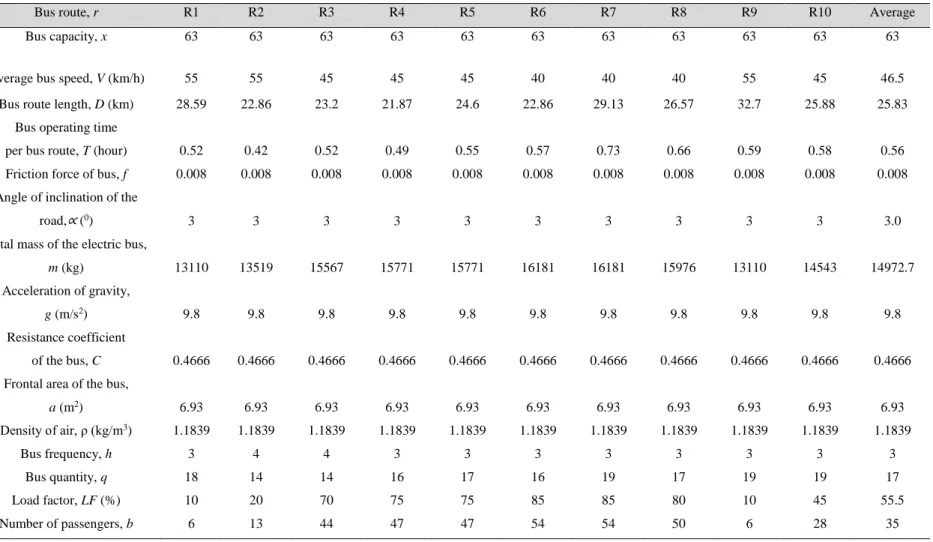
Of course, financial cost is one of the key concerns of the bus operator when making decisions about the planning and operation of the electric bus fleet. In other words, the weight may be different and subject to the needs of the bus operators. In table 4.1, the bus weight takes into account the underbody weight of the bus and the total passenger weight (which is approximately 65 kg per passenger).
Strategy 5 (change charging facility)
Energy consumption 135
In Table 4.36, the bus frequency for bus routes R6, R7 and R8 has increased, but the bus volume has decreased due to the reduction in bus charging duration (as the fast charging option is used). Although the charging facility is changed to fast charging for bus routes R7 and R8, there is no impact on energy consumption, as the amount of energy required for bus operation is still the same as used in the benchmark scenario. With a shorter charging duration, there are changes in bus frequency and bus volume for bus routes R6, R7 and R8.
The bus count is reduced for bus lines R6, R7 and R8 and each bus can take more trips for the bus operation. With these changes, the total number of trips made by the buses remains the same as in the benchmark scenario and there is no significant impact on the noise level of the buses. In this strategy, the bus lines with the lowest occupancy rate (10%), namely R1 and R9, have been eliminated.
For bus routes R2 and R10, the bus frequency has been reduced and the load factor has been increased to 50%. Moreover, strategy 3 showed a lower total energy consumption compared to the benchmark scenario, where four bus routes (R1, R2, R9 and R10) were selected to use smaller buses for the bus operation. This shows that with the use of different charging durations (fast charging), there is no major impact on the GEI, since the amount of energy consumption required by the bus is the same as in the benchmark scenario.
This shows that the reduction of the bus speed (Strategy 4) and the change of the charging facility to fast charging (Strategy 5) do not cause the major changes in the bus noise level.
Multi-Criteria Analysis with Analytic Hierarchy Process
Compared to all the strategies, Strategy 1 showed the lines of GEI, GMI and GNI closer to the line of equality. However, in Strategy 1, GNI and GEI appeared closer to the line of equality, while GMI remained further from the line of equality. It is expected that when the line gets closer to the line of equality, it will indicate better green performance of the bus.
Nevertheless, the GMI remained further from the line of equality, which means that the bus produces more pollutants (emissions) during the journey. GNI in strategy 4 approached the equality line compared to GMI and GEI. This reveals that the bus produced less pollutants (noise) but instead more emissions as the GMI stayed further from the equality line.
However, strategy lines 3–5 appear to be closer to the reference scenario, which is further from the equality line. We see that the line of Strategy 1 approaches the line of equality. As mentioned earlier, strategy 4 is not improved and the line appears to remain closer to the benchmark scenario and further from the equality line.
However, the GNI line of Strategies 4 and 5 remained further from the similarity line, but closer to the benchmark scenario line, meaning that the noise level for these two strategies is the same as for the benchmark scenario.
Comparative and Improvement Analysis
Summary
CONCLUSIONS 169
Future works
Future work may focus on electric bus optimization problems and cost savings analysis for electric bus fleet planning and operation. From the results obtained, the overall green performance for the entire bus network has been achieved. By applying and studying the parameters of the electric bus fleet, it will be able to provide a cost analysis for bus operators.
In addition, the cost of an electric bus can be studied before and after calculating the GPI to obtain greater accuracy and provide a discrete idea for the bus operator. In addition, in terms of social aspects, stakeholder satisfaction (i.e. passengers and bus operators) could be included in the future study to provide a more comprehensive reference. A comprehensive idea encompassing social, economic and environmental factors would push more bus companies to replace conventional buses with electric buses.
Research Accomplishment
10th Asia-Pacific Conference on Transport and Environment (APTE), 8-9 November 2016, Petaling Jaya, Malaysia. A potential application of the analytic hierarchy process (AHP) to college tenure selection. Preferences of electric buses in public transport; Conclusions of real-life testing in eight Swedish municipalities.
IEEE International Conference on Electrical Systems for Aircraft, Railway, Marine Propulsion and Road Vehicles and International Transportation Electrification Conference (ESARS-ITEC), doi: 10.1109/ESARS-ITEC. Available at: https://www.prnewswire.com/news-releases/byd-becomes-first-chinese-auto-company-to-penetrate-japanese-market-. Available at: https://www.world wildlife.org/magazine/issues/winter-2014/articles/impacts-of-climate-change-resource-scarcity-and-foreign-policy [Assessed: 1 March 2020].
Estimation of the energy demand of electric buses based on real-world data for large-scale public transport networks. Impact of the Spanish electricity mix, over the period, on the life cycle energy consumption and greenhouse gas emissions of electric, hybrid diesel-electric, fuel cell hybrids and diesel buses of the Madrid transport system. The 10th Asia-Pacific Conference on Transport and Environment (APTE), November 8-9, Petaling Jaya, Malaysia.
Energy consumption and well-to-wheel air pollutant emissions of battery-electric buses under complex operating conditions and implications for fleet electrification.