Effect of Non-Ground Copper Slag on Properties of Concrete
by
Mohd Zulhilmi Bin Mokhtar
Final report submitted in partial fulfillment of the requirements for the
Bachelor of Engineering (Hons) (Civil Engineering)
JANUARY 2008
Universiti Teknologi PETRONAS Bandar Seri Iskandar
31750 Tronoh
Perak Darul Ridzuan
TABLE OF CONTENTS CERTIFICATION
ABSTRACT
ACKNOWLEDGEMENT CHAPTER!:
CHAPTER2:
CHAPTER3:
CHAPTER4:
CHAPTERS:
REFERENCES APPENDICES
INTRODUCTION
1.1
Background of Study 1.2 Problem Statement1.3 Objectives and Scope of Study LITERATURE REVIEW
2.1 Copper Slag
2.2 Ordinary Portland Cement
2.3 X-ray Fluorescence (XRF) testing 2.4 Compression Test
2.5 Tensile Test 2.6 Porosity Test
METHODOLOGY AND PROJECT WORK.
3.1 Research
3.2 Set up the Raw Material 3.3 Detail of Mixing Scheduled 3.4 Calculation and Mix Proportional 3.5 Concrete Mixing
3.6 Casting
3. 7 Curing Process 3.8 Test
RESULTS AND DISCUSSION 4.1 Result and Discussion
CONCLUSION AND RECOMMENDATION 5.1 Conclusion
5.2 Recommendations
IV
VI
VII
1 1 2 3 3
3 5
67
78
11 11 11 12 12 15 16 16
18
21 21 30 30 31 33 34
LIST OF FIGURES
Figure 2.1 Copper Slag 3
Figure 2.2 X-ray fluorescence (XRF) 6
Figure 2.3 Graph of stress versus strain 7
Figure 3.1 Concrete Mixing Process 15
Figure 3.2 Casting of cylinder concrete 16
Figure 3.3 Curing process take place 17
Figure 3.4 Compression Test 18
Figure 3.5 Splitting Test 19
Figure 4.1 Graph of compressive strength of slag mortars 23
Figure 4.2 Failure in cube due to compression load 23
Figure 4.3 Graph of compressive strength of slag mortars 26
Figure 4.4 Failure in cylinder due to tensile load 26
Figure 4.5 Graph of compressive strength of slag mortars 39
Figure A Copper slag at MMHE 34
Figure B Informal discussion with MMHE personnel 34
Figure C Equipment use for compression and tensile test 35
FigureD Casting the concrete into the mould 35
LIST OF TABLES
Table 2.1 Material composition of copper slag 4
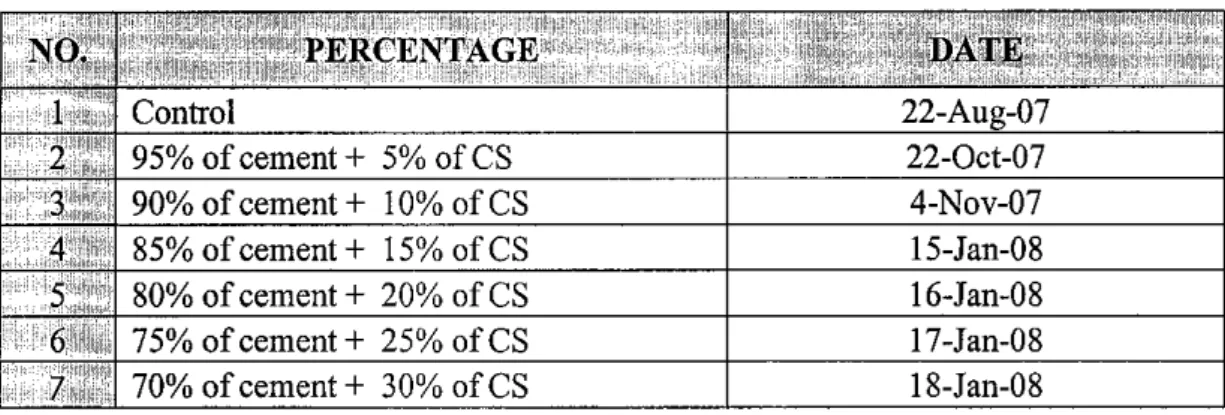
Table 3.1 Mixing Schedule 12
Table 3.2 Mix proportional for cubes 14
Table 3.3 Mix proportional for cylinders 14
Table 4.1 Result from mix 1 (control) 21
Table 4.2 Result from mix 2 for cube 21
Table 4.3 Result from mix 3 for cube 22
Table 4.4 Result from mix 4 for cube 22
Table 4.5 Result from mix 5 for cube 22
Table 4.6 Result from mix 6 for cube 22
Table 4.7 Result from mix 7 for cube 23
Table 4.8 Result from mix !(control) for cylinder 24
Table 4.9 Result from mix 2 for cylinder 24
Table 4.10 Result from mix 3 for cylinder 24
Table 4.11 Result from mix 4 for cylinder 25
Table 4.12 Result from mix 5 for cylinder 25
Table 4.13 Result from mix 6 for cylinder 25
Table 4.14 Result from mix 7 for cylinder 25
Table 4.15 Result from mix 1 for slab 27
Table 4.16 Result from mix 2 for slab 27
Table 4.17 Result from mix 3 for slab 27
Table 4.18 Result from mix 4 for slab 28
Table 4.19 Result from mix 5 for slab 28
Table 4.20 Result from mix 6 for slab 28
Table 4.21 Result from mix 7 for slab 29
CERTIFICATION OF APPROVAL
Effect of Non-Ground Copper Slag on Properties of Concrete
Approved by,
___-··-·--·~--
/
)
. I
~by
Mohd Zulhilmi Bin Mokhtar
A project dissertation submitted to the Civil Engineering Programme Universiti Teknologi PETRONAS in partial fulfilment of the requirement for the
BACHELOR OF ENGINEERING (Hons) (CNIL ENGINEERING)
(, I--~ .._ ,J
""" ' (X}
'V'-"~
(AP Dr. Nasir Shafiq)
UNIVERSITI TEKNOLOGI PETRONAS TRONOH, PERAK.
JANUARY 2008
ABSTRACT
Copper slag is material that widely used in blasting to prepare the steel for painting purposes. Major problem that arise regarding this materials are the way to dispose this material. Thus, this research was carried out to study the potential of copper slag as cement on properties of the concrete. Mortar specimen with non-ground copper ranging from 0% to 30% of cement weight were tested to determine the compressive strength, tensile strength, and permeability of the concrete. Results demonstrated that there is general an increase in the density and workability of concretes as copper slag quantity increases. Also results showed that the compressive strength of concrete is generally improved, compared with the control mix, with the increase of copper slag up to a certain copper slag content beyond which the strength generally reduces.
Keywords:
copper slag, fine aggregate, concrete, strength, compressive strength, tensile strength.
ACKNOWLEDGEMENT
I would like to express my gratitude to all those who gave me the possibility to complete this thesis. I want to thank the Department of civil of Universiti Teknologi PETRONAS (UTP) for giving me permission to commence this thesis in the first instance, to do the necessary research work and to use departmental equipment.
I am deeply indebted to my supervisor AP Dr. Nasir Shafiq whose help, stimulating suggestions and encouragement helped me in all the time for finishing this research.
My former colleagues from the Department of Civil supported me in my research work. I want to thank them for all their help, support, interest and valuable hints. Especially to my colleague Miss Nur Hayati Abd Rahman whose help me a lot in laboratory work. Not forgotten also to all techuician form Department of Civil who give fully cooperation in this research.
Last but not least, I would like to give my special thanks to my family members
for their priceless support, encouragement, constant love, valuable advices, and their
understanding along this research were carried out.
CHAPTER!
INTRODUCTION
1.1 BACKGROUND OF STUDY
Copper slag is used in shot blasting to prepare steel surface for painting. The widespread use of leas and other heavy metals in protective paints increases heavy metals in used slag, which is classified as a solid or hazardous waste. Landfill disposal of copper slag is not feasible since a few hundred tones are produces per year per factory. See Figure A in appendix.
Many investigations relating to the disposal of industrial by-products in concrete have been actively pursued. Theoretically, the disposal of this waste by adding into the concrete can reduce the number of pollution related to the copper slag. However, the research on copper slag has not been extensive. Basically, copper slag has been used as aggregates and back failing material. A few studies have been performed to investigate the stabilization of heavy metal present in copper slag within the cement matrix.
1.2 PROBLEM STATEMENT
Copper slag is one the waste that been categorized as heavy metal.
Generally, this material can be found at fabrication yard especially at Malaysian Marine and heavy Engineering (MMHE). Statistically, the amount usage of copper slag had increase day by day without proper disposal.
Thus, this research is to study the effect of the copper slag on the properties of concrete as one of the method to dispose this material.
1.3 OBJECTIVE AND SCOPE OF STUDY
The objectives of this thesis that need to be achieved by the end of the project are:
I. To determine the effect of non-ground copper slag on the properties of concrete.
2. To compare the strength, tensile and porosity of concrete by replacing some portion of cement with copper slag ranging of 0% to 30%.
3. To compare the effect between non-ground and ground copper slag on the properties of concrete.
CHAPTER 2
LITERATURE REVIEW
2.1 COPPER SLAG
Copper slag from a metal fabricating company at Pasir Gudang in Johor was used; its chemical composition ad physical properties are listed in Table 2.1.
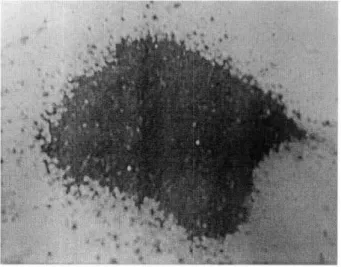
Physically it is angular, black, glassy and shiny with sharp edges.
Figure 2.1: Copper slag
As a general rule, the specific gravity will vary with iron content, from a low of 2.8 to as high as 3.8.The unit weight of copper slag is somewhat higher than that of conventional aggregate. The absorption of the material is typically very low (0.13 percent).
Granulated copper slag is more porous and therefore has lower specific gravity and higher absorption than air-cooled copper slag. The granulated copper slag is made up of regularly shaped, angular particles, mostly between 4.75 mm (3/4 in) and 0.075 mm (No. 200 sieve) in size.
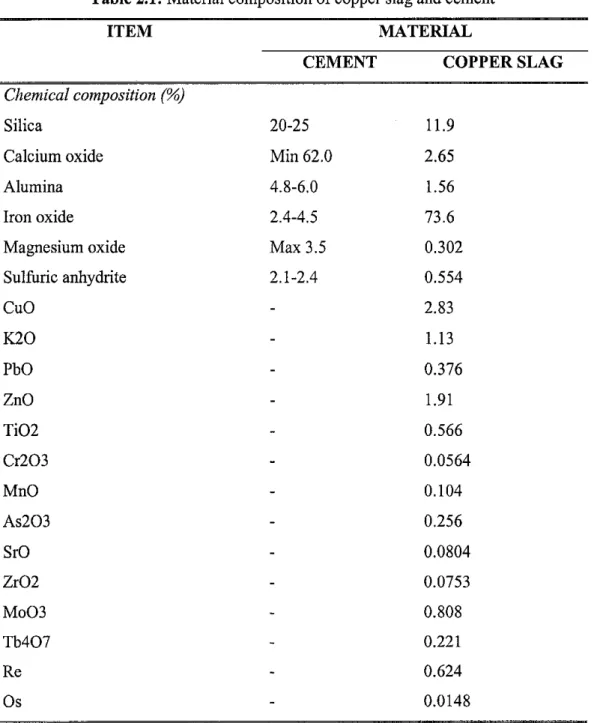
Table 2.1: Material composition of copper slag and cement
ITEM MATERIAL
CEMENT COPPER SLAG Chemical composition (%)
Silica 20-25 11.9
Calcium oxide Min62.0 2.65
Alumina 4.8-6.0 1.56
Iron oxide 2.4-4.5 73.6
Magnesium oxide Max 3.5 0.302
Sulfuric anhydrite 2.1-2.4 0.554
CuO 2.83
K20 1.13
PbO 0.376
ZnO 1.91
Ti02 0.566
Cr203 0.0564
MnO 0.104
As203 0.256
SrO 0.0804
Zr02 0.0753
Mo03 0.808
Tb407 0.221
Re 0.624
Os 0.0148
2.2 ORDINARY PORTLAND CEMENT
Ordinary Portland Cement (OPC) is the most common cement used in general concrete construction when there is no exposure to sulphates in the soil or groundwater. Ordinary portland cement is a gray coloured powder. It is capable of bonding mineral fragments into a compact whole when mixed with water. This hydration process results in a progressive stiffening, hardening and strength development.
It is a fine powder produced by grinding Portland cement clinker (more than 90%), a limited amount of calcium sulfate which controls the set time, and up to 5%
minor constituents (as allowed by various standards). As defined by the European Standard EN197 .1, "Portland cement clinker is a hydraulic material which shall consist of at least two-thirds by mass of calcium silicates (3Ca0.Si02 and 2CaO.Si02), the remainder consisting of aluminium- and iron-containing clinker phases and other compounds. The ratio of CaO to Si02 shall not be less than 2.0.
The magnesium content (MgO) shall not exceed 5.0% by mass." (The last two requirements were already set out in the German Standard, issued in 1909). Portland cement clinker is made by heating, in a kiln, a homogeneous mixture of raw materials to a sintering temperature, which is about 1450
oc
for modem cements.The aluminium oxide and iron oxide are present as a flux and contribute little to the strength.
For special cements, such as Low Heat (LH) and Sulfate Resistant (SR) types, it is necessary to limit the amount of tricalcium aluminate (3CaO.Ah03) formed. The major raw material for the clinker-making is usually limestone (CaC03). Normally, an impure limestone which contains Si02 is used. The CaC03 content of these limestones can be as low as 80%. Secondary raw materials (materials in the rawmix other than limestone) depend on the purity of the limestone.
Some of the secondary raw materials used are: clay, shale, sand, iron ore, bauxite,
fly ash and slag. When a cement kiln is fired by coal, the ash of the coal acts as a secondary raw material.
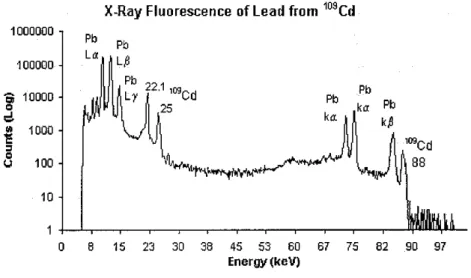
2.3 X-RAY FLUORESCENCE (XRF) TESTING
Energy dispersive X-ray fluorescence technology (ED-XRF) provides one of the simplest, most accurate and most economic analytical methods for the determination of the chemical composition of many types of materials. It is non- destructive and reliable, requires no, or very little, sample preparation and is suitable for solid, liquid and powdered samples. It can be used for a wide range of elements, from sodium (11) to uranium (92), and provides detection limits at the sub-ppm level; it can also measure concentrations of up to 100% easily and simultaneously.
XRF is an elemental analysis technique with unique capabilities including (I) highly accurate detenninations for major elements and (2) a broad elemental survey of the sample composition without standards. For example, XRF is used in analysis of rocks and metals with an accuracy of -0.1% of the major elements. A technique known as Fundamental Parameters can estimate the elemental composition of unknowns without standards. And to top it all off, sometimes the analysis requires minimal sample preparation.
X-Ray Fluorescence of Lead from 109Cd 1000000
Pb Pb
La L~
100000
a
1oooo Pb L 1 22.1""cd
Pb Pb0 25 ka
;.
~ 1000
~t"'"""M""'-f-
'!! 109Cd
~ 0
100 88
'-'
10
0 8 15 23 30 38 45 53 60 67 75 82 90 97 Energy (keV)
Figure 2.2: X-ray Fluorescence (XRF)
2.4 COMPRESSION TEST
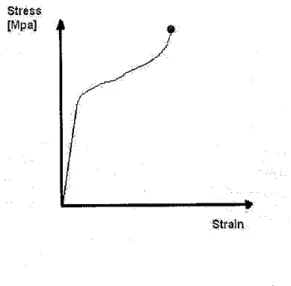
Compressive strength is the capacity of a material to withstand axially directed pushing forces. When the limit of compressive strength is reached, materials are crushed. By definition, the compressive strength of a material is that value of uniaxial compressive stress reached when the material fails completely.
stress [Mpa]
-$train
Figure 2.3: Graph of stress versus strain
The compressive strength is usually obtained experimentally by means of a compressive test. The apparatus used for this experiment is the same as that used in a tensile test. However, rather than applying a uniaxial tensile load, a uniaxial compressive load is applied. As can be imagined, the specimen (Usually cylindrical) is shortened as well as spread laterally. A Stress-strain curve is plotted by the instrument and would look similar to the foiJowing:
2.5 TENSILE TEST
ASTM C 496 gives required requirement for the testing apparatus, test specimen geometry and load application for determining splitting tensile strength of cylinder test specimen. The testing machine should meet the requirement of ASTM
C 39. The specimen is placed on its side and subjected to a diametral compressive force along its length. If either the upper or lower bearing block of the testing machine is shorter than the cylinder, a bearing bar or plate shall be used that is at least as thick as the distance from the edge of the machine bearing block to the end of the cylinder at least 51 mm wide, and within 0.001 in 0.025 mm of plainness.
Bearing strip at least as long as the cylinder and 1/8 in 3.2 mm thick and 25 mm wide shall be placed between the specimen and the loading faces. The load should be applied at a rate of between 686 bad 1380 kPa/min splitting tensile stress.
Failure of these specimens occurs along a vertical place containing the specimen axis and the applied load. The load configuration of this test method induced tensile stresses along the failure plane over approximately two-third to three-fourth of the specimen diameter. The regions of the specimen in the vicinity of the loading strips are subjected to large compression force. However, tensile rather than compressive failure occurs because the stress state at the loading strips is triaxial compression, allowing the concrete to resist higher compressive stresses.
2.6 POROSITY TEST
There are various methods available that have been used to study the pore structure of concrete and mortar, in a broad sense they can be divided into two categories.
+
Indirect or Bulk Methods+
Direct MethodsIndirect methods generally give information about the average picture of the whole microstructure of concrete or mortar, on the other hand the direct methods demonstrate the way in which different component phases are arranged in the microstructure. However, there are certain limitations and advantages of each method and technique.
2.6.1 VACUUM SATURATION TECHNIQUE
The total porosity of a porous material, such as concrete, is defined as the fraction of the bulk volume occupied by the voids. The voids may be filled with air and/or water depending upon the degree of pore saturation. For a partially saturated condition, the total porosity is the combination of the part of water filled and air filled voids usually termed as open porosity [Cabrera and Hassan, 1997], which corresponds to the term of empty porosity as used by Ujike and Nagataki (1988).
There are number of methods used to determine the total porosity of concrete and mortar, however, the technique of vacuum saturation is perhaps the simplest, cheap and direct method of measurement. Although the vacuum saturation of concrete is not widely used, evidence shows that the method is gaining acceptance because of providing a closed approach to total or full saturation in a relatively short time period [Cusens and Cabrera, 1987].
2.6.2 Calculation of Porosity
The total porosity (P) and the open porosity (V,) of concrete and mortar samples were calculated using the following equations [Cabrera and Hassan, 1997].
Where:
(6.1)
V '
=P(l-~)
100(6.2)
P =Total porosity(%) V, =Open porosity(%) S = Degree of saturation (%)
W sA = Weight of saturated surface dry samples in air (g) W sw =Weight of saturated surface dry samples in water (g) W d = Weight of oven dry samples (g)
CHAPTER3
METHODOLOGY AND PROJECT WORK
3.1 RESEARCH
At the beginning of the project, author has conducted research by referring to the journal, books and also web. Besides, the author also makes some discussion with Miss Fatin Nabilah, one of the FYP students who are using the same material.
For further information regarding the material use, the author has managed a discussion with in charge person at Malaysian Marine and Heavy Engineering (MMHE).
3.2 SET UP THE RAW MATERIAL
One of the main important parts of the project is to set up all the material before mixing take place. To ensure the schedule is one time, the author had organized a trip to MMHE in order to take 400 kg of copper slag. This is because, copper slag is the main material needed in this project.
Beside, the author investigates the place to find the raw material are hardware shop( sand) ,market( jut bag) ,quarry( coarse aggregate) and some raw material already available at lab are grease, cement and others equipment.
3.3 DETAIL OF MIXING SCHEDULED
Table 3.1: Mixing schedule
4-Nov-07
3.4 CALCULATION AND MIX PROPORTIONAL
Before the author start the project and the laboratory, the author do the calculation to determine the mixing proportional The mix proportions are done by referring to the literature review and discussion with supervisor. This design is very important before the author can proceed to the next step. Based on the mix design, the author can determine the proportion of aggregate, cement, water and copper slag.
Calculation
Characteristic Strength
Standard deviation Margin
Target mean strength Cement type
Aggregate type: coarse Aggregate type: fine Free water cement ratio
Maximum free-water/cement ratio Slump
Maximum aggregate size Free water content Cement content
Maximum cement content Minimum cement content
Relative density of aggregate (SSD) Concrete density
Total aggregate content Grading of fine aggregate Proportion of fine aggregate Fine aggregate content Coarse aggregate content
Compressive 50 N/mm2 at 28 days Proportion defective 1 percent 5N/mm2
(k=2.33) 2.33 x 5 = 11.6 N/mm2 50+ 11.6 = 62 N/mm2
OPC Crushed Uncrushed 0.46 0.45
Slump 60-180 mm 20mm
205kg/m3
205 I 0.45 = 455 k/m3
370 kg/m3 2.9
2733 kg/m3
2733 - 455 - 205 = 2073 kg/m3 Zone2
40 percent
2073 x 0.4 = 829.2 kg/m3 2073-829.2 = 1243.8 kg/m3
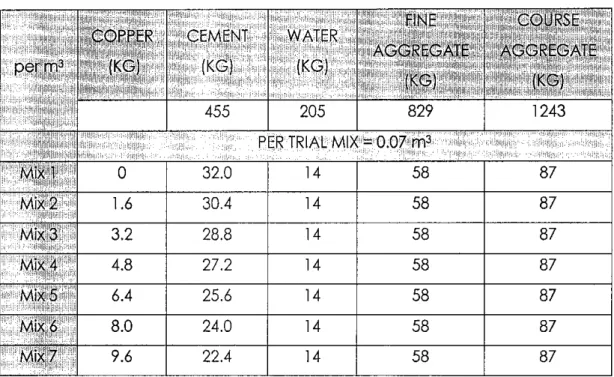
For cube
Size : 150 x 150 x 150 mm Total sample : 105 samples
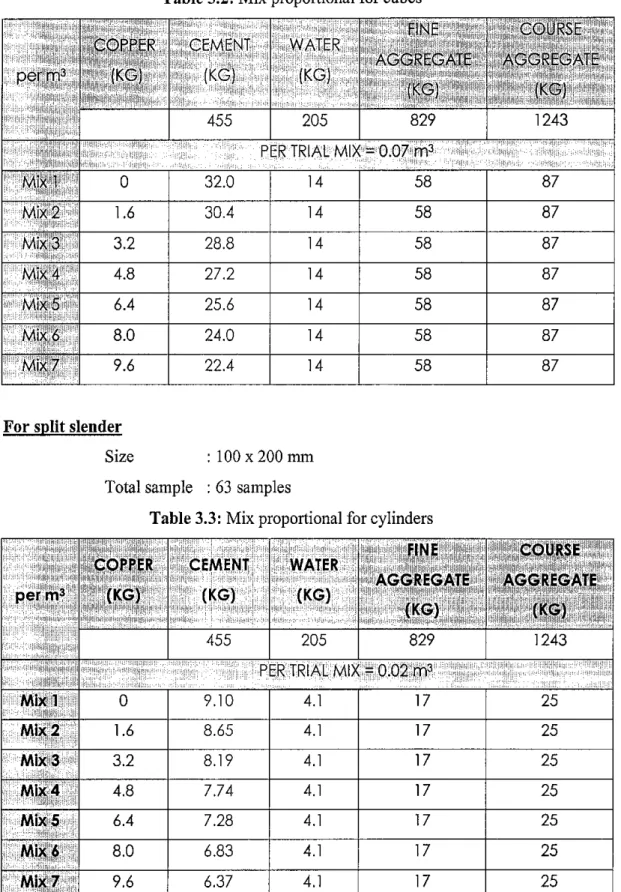
Table 3.2: Mix proportional for cubes
1.6 30.4 14 58 87
3.2 28.8 14 58 87
4.8 27.2 14 58 87
6.4 25.6 14 58 87
8.0 24.0 14 58 87
9.6 22.4 14 58 87
For split slender
Size : 100 x 200 mm Total sample : 63 samples
Table 3.3: Mix proportional for cylinders
·PER
TRIAL9.10
4.1
1.6 8.65 4.1 17 25
3.2 8.19 4.1 17 25
4.8 7.74 4.1 17 25
6.4 7.28 4.1 17 25
8.0 6.83 4.1 17 25
9.6 6.37 4.1 17 25
3.5 CONCRETE MIXING
All concrete should be mix thoroughly until it is uniform .The sequence of concrete mix is very important and it must be followed accordingly. It must be follow by the BS 1881 Part 125: 1986)
1. Wetted the mixer with water
2. Pour all coarse and fine aggregates into the mixer and mix for 25 seconds to ensure unifom1 distribution between both materials.
3. Add half of the water and mix for 1 minute.
4. Leave the mixes for 8 minutes to let both coarse and fine aggregates to absorb water.
5. Add cement into the mixer and mix for 1 minute.
6. Add remaining water available and mix for 1 minute.
7. Stop the machine and do hand mixing to ensure homogeneity.
8. Pour the concrete onto the non porous surface.
Precaution
• Room temperature should be approximately 25-27 °C
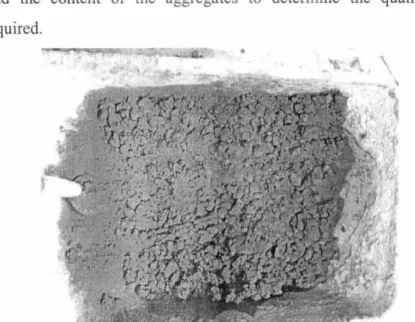
• All the fine and coarse aggregate must be in dry condition. If they are wet, find the content of the aggregates to determine the quantity of water required.
Figure 3.1: Concrete ML'dng Process
3.6 CASTING CUBES, SLENDERS AND PLANKS
1. Brush the inner faces of mould with oil and tighten the screws.
2. The concrete mixing are pouring into the fonn work by 3 layer , at each layer , vibrator are used take out the air that trapped in concrete mix .Trapped air can reduce the concrete strength .
3. After the next day, the cubes, cylinders and planks will take out from the mould and curing process will be conducted.
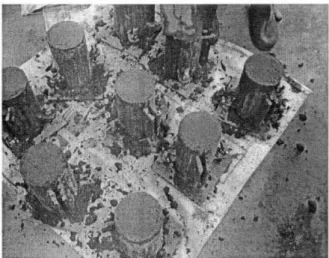
Figure 3.2: Casting of cylinder concrete
3.7 CURING PROCESS
Curing process is to fully hydrate the concrete beam before it acquires strength and hardness because the concrete beam must be cured once it has been placed. Curing is the process of keeping concrete under a specific environmental condition until hydration is relatively complete. Good curing is typically considered to provide a moist environment and control temperature.
A moist environment promotes hydration, since increased hydration lowers permeability and increases strength resulting in a higher quality material. Allowing the concrete surface to d1y out excessively can result in tensile stresses, which the still-hydrating interior cannot withstand, causing the concrete to crack.
Also, the amount of heat generated by the exothermic chemical process of hydration can be problematic for very large placements. Allowing the concrete to freeze in cold climates before the curing is complete will interrupt the hydration process, reducing the concrete strength and leading to scaling and other damage or failure.
The effects of curing are primarily a function of geometry (the relation between exposed surface area and volume), the pem1eability of the concrete, curing time, and curing history. Improper curing can lead to several serviceability problems including cracking, increased scaling, and reduced abrasion resistance.
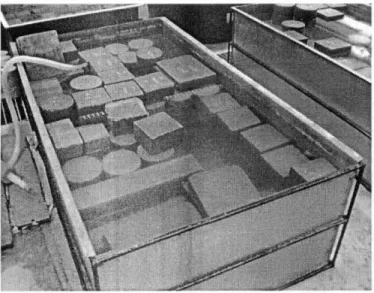
Figure 3.3: Curing process take place
3.8 TEST
3.8.1 Compression Test
Figure 3.4: Compression Test
This test is carried out to determine the compressive strength for the cube. Below are the procedures for compressive test:
1. Remove the specimen from curing tank and with surface water and grit off specimen
2. Weight each specimen to the nearest kg.
3. Clean the top and the lower platens of the testing machine. Carefully enter the cube on the lower platen and ensure that the load will be applied to two opposite cast faces of the cube.
4. Without shock, apply and increase the load continuously rate within the range 0.2N/mm2 to 0.4N/mm2 until no greater load can be sustained.
Record the maximum load applied to the cube.
3.8.2 Splitting Test
In the splitting test, a concrete cylinder of the type used in compressive strength testing, is placed, with its axis horizontal, between platens of a testing machine, and the load is increased until failure take place by splitting in the plane containing the vertical diameter of the specimen. Figure3.5 shows the type of jigs required for supporting the test specimen in a standard compression test machine as described by BS 1881: 1983 ; ASTM C 496-90 prescribes a similar test. to prevent very high local compressive stresses at the load lines, narrow strips of packing material , such as hardboard or plywood, are interposed between the specimen and the platen. Under these conditions, there is a high horizontal compressive stress at the top and the bottom of the cylinder but, as this is accompanied by a vertical compressive stress of comparable magnitude, there is a state of biaxial compression so that failure does not take place at these positions. instead, failure is initiated by the horizontal uniform tensile stress acting over the remaining cross section of the cylinder.
(
Figure 3.5: Splitting Test
3.8.3 Porosity Test
This test was carried out in order to determine the percentages of void contain in the sample. Subsequently this result can be used to determine the durability of the concrete in long term period.
I. Make a hole by using coring machine.
2. Allocate the sample into the porosity equipment without water and leave it for 30 minutes. Tum it on.
3. Then, switch off the equipment and add with the water. Switch on the equipment and leave it for 6 hours.
4. After that, put the sample into the coring tank for I day.
5. Remove the specimens from coring tank, measure the weight in air and in water.
6. Put the sample into the oven for I day period.
7. Weight the sample in air only.
CHAPTER4
RESULT AND DISCUSSION
4.1 RESULT AND DISCUSSION
In order to study the effect of copper slag to the construction material, compressive strength of mortar sample were determined. A plot of compressive strength against the period of 3, 7, 28 and 90 days reveal that the strength of copper slag mortar generally higher than the control mortar.
Detail: Mix 1 (control)
Table 4.1: Result from mix 1 (control)
8.06 603.17
32.75
8.14 914.67
40.26
Detail: Mix 2 (95% of cement+ 5% cement)
Table 4.2: Result from mix 2 for cube
706.23 31.39
6.80
983.43 43.70
8.40 1214.67
53.99
8.12 1061.20
47.16
8.41 1261.33
56.05
Detail: Mix 3 (90% of cement + 1 0% cement)
Table 4.3: Result from mix 3 for cube
8.43 1018 45.25
Detail: Mix 4 (85% of cement+ 15% cement)
8.45 1239 55.05
Table 4.4: Result from mix 4 for cube
8.38 894.27
39.74
Detail: Mix 5 (80% of cement+ 20% cement)
8.19 625.73
40.54
Table 4.5: Result from mix 5 for cube
8.38 823.17
36.58
Detail: Mix 6 (85% of cement+ 25% cement)
8.39 847.67
37.67
Table 4.6: Result from mix 6 for cube
8.45 672.70
29.90
8.31 733.47
32.60 6.80
8.43 1402.33
62.33
8.52 1265.67
46.27
8.39 1194.33
53.07
8.49 1033.47
45.92 6.80
Detail: Mix 7 (70% of cement + 30% cement)
Days Cube No.
Weight (kg) Max Load (N)
Stress Pace Rate
70.00
~ 60.00 ...
~
...
50.00~ ~40.00
~
...
30.00>
·v;
~ 20.00
...
0.g
10.00u 0.00
0
Table 4.7: Result from mix 7 for cube
3 7 28
Average Average Average
8.38 8.33 8.50
625.37 666.57 686.93
27.80 29.63 30.53
6.80 6.80 6.80
20 40 60 80
Period (Days)
100
Figure 4.1: Graph of compressive strength of slag mortars
Figure 4.2: Failure in cube due to compression load
90 Average
8.37 1077.33
47.9 6.80
-+-Mixl (control) -Mix2{5%) -+-Mix3 (10%) - Mix4{15%) ...,.._ MixS {20%) -+-Mix6{25%) - Mix7{30%)
Another test that been conducted to study the effect of copper slag is tensile strength. Theoretically, tensile strength of concrete was stated to be eight (8) lower than the compressive strength.
Detail: Mix 1 (control)
3.72 75.63
2.41
Detail: Mix 2 (95% of cement + 5% cement)
Detail: Mix 3 (90% of cement+ 10% cement)
123.37 3.73
149.03 4.74
3.73
119.90 165.20
3.78 5.26
.94 0.94
3.73 3.75
130.90 179.73
4.17 5.72
Detail: Mix 4 (85% of cement + 15% cement)
Detail: Mix 5 (80% of cement+ 20% cement)
83.10 2.65 0.94
Detail: Mix 6 (75% of cement+ 25% cement)
3.80 75.60
2.41
Detail: Mix 7 (70% of cement+ 30% cement)
73.13 2.33 0.94
72.77 3.33
3.83 87.47
2.78
86.47 2.75 0.94
75.37 2.40
3.8 72.73
2.06
80.67 2.28 0.94
7.00 E 6.00 E 5.00 ...
z
~
...
4.00CID c: 3.00
~ ....
Ill
..
..9:! 2.00
·;;;
1.00 c: ~
1- 0.00
0 20 40 60 80 100
Period (dilys)
Figure 4.3: Graph of tensile strength of slag mortars
Figure 4.4: Failure in cylinder due to tensile load
-+-Mixl(control) - Mix2(S%) ...-Mix3(10%) - Mix4{15%) - Mix5(20%) ... Mix6(2S%) - Mix7{30%)
The higher strength could be attributing by the composition of silica and other composition in the copper slag. Some of the composition that exists in the copper slag helps to reduce the porosity and by the same time also decrease the permeability of the concrete. Those behaviors will increase the compressive and tensile strength of the concrete.
Besides, porosity test also been conducted in order to determine the long term strength of the concrete.
Detail: Mix I (control)
Table 4.15: Result from mix 1 for slab
253.5 118.6 246
250.13
Detail: Mix 2 (95% of cement+ 5% cement)
Table 4.16: Result from mix 2 for slab
Detail: Mix 3 (90% of cement+ I 0% cement)
Table 4.17: Resnlt from mix 3 for slab
Detail: Mix 4 (85% of cement + 15% cement)
Table 4.18:
Result
from mix4
forslab
Detail: Mix 5 (80% of cement+ 20% cement)
Table 4.19:
Result
from mix5
forslab
Detail: Mix 6 (75% of cement+ 25% cement)
Table 4.20:
Result
from mix6
forslab
269.3 265.5
135.1 127.4
255.3 252.6
Detail: Mix 7 (70% of cement+ 30% cement)
~
14 12·i
~ 100 8
-
0.. 0"'
6"
f ..
u 4 2~
"
Q. 0
mixl
Table 4.21: Result from mix 7 for slab
mix2 (5%)
133.8 131.7 134.23
mix3 (10%)
mix4 (15%)
mixS (20%}
Percentages of CS (%)
mix6 (25%}
mix7 (30%)
Figure 4.5: Graph of porosity of slag mortars
272.5 276.60
-t-7day --28day
This graph showed that the mix 2 by replacing the cement with 5 percent of copper slag give the lowest reduction of porosity compared with others mix. The reducing of pores inside the cement leads the increasing of the compressive and tensile strength of the concrete. This situation may due to the existence of heavy metals inside the copper slag.
CHAPTERS
CONCLUSION AND RECOMMENDATION
5.1 CONCLUSION
From the research that have been done by collecting information from the articles, journal and books, it showed that that copper slag is the best material can be used to replace the cement in order to produce high strength concrete. Thus, after the on going research being done, it showed that this material has increased the properties of the concrete. In order to realize this study, further research will be made to clarify the behavior of copper slag in concrete.
This study has shown that the used of copper slag can increased the strength of a concrete. Based on the results, an optimum strength of concrete is atlO% of copper slag usage. Thus, copper slag can be used safely in the concrete as one of the method to dispose this material
Findings from this research will lead to a new are in building construction technology. The use of copper slag will be a cost effective alternative to concrete in order to increase the properties of the concrete. Hopefully with findings from this research, copper slag can be reuse in proper way without any environmental issues.
5.2 RECOMMENDATION
In this final year project ,the author determine that there are still have a problem while the author conduct the project that can affected the schedule and the results oflaboratory .The problem are:
Water cement ratio decrease
During the mixing of concrete, author notice that water/cement ratio is decrease due to time. This occurs when author decide to combine mixing for cube and slender.
Thus, the time use to casting all cube and slender take long time and may cause the water to evaporate. Subsequently, water/cement ratio will decrease and the mix becoming dry. This may give effect to the result of compressive strength and tensile strength. To avoid this from occurs; the author had divided the mixing between cube and cylinder.
Laboratory apparatus
Laboratory apparatus is not sufficient because when the peak hour of laboratory usage, the author must consecutively with others student because lack of equipment .In example in the lab, only I hammer present in the laboratory. It makes more time required for laboratory work because lack of equipment facilities in the lab.
Aggregate used
To ensure the accuracy of the research, the mix that been made must using the same size of aggregate. Basically, there is a lot of type of aggregates behind the
laboratory.
Future Research
In order to ensure this material can be used widely in concrete as a replacement for concrete, furtber research should be done respectively. Others research can be carried out are to study the effect of copper slag on structural behavior of the concrete. These are the proposed studies;
•!•
Static load dynamic•!•
Durability load•!•
Chloride migration•!•
Micro structured using ACMREFERENCES
1. JEGEL. Manitoba Slags, Deposits, Characterization, Modifications, Potential Utilization. Report prepared by John Emery Geotechnical Engineering Limited, Toronto, Ontario, 1986.
2. Hughes, M.L. and T.A. Haliburton, "Use of Zinc Smelter Waste as Highway Construction Material," Highway Research Record No.430, 1973, pp.16-25.
3. A.M. Neville and J.J. Brooks, 1999, Concrete Technology, Prentice Hall.
4. M L Gambhir,2004, Concrete Technology, Tata McGraw Hill.
5. M.S. Shetty, 1982, Concrete Technology-theory and practice,S. Chand
& Company Ltd.
6. American Society for Testing and Material. Standard specification for ground granulated blast-furnace slag for use in concrete and mortar.
ASTM C989-89, Philadelphia, 1982.
7. MS 552: Specification for Portland cement (ordinary and rapid hardening): part I :Standard specification (first Revision), 1989.
APPENDIX
Figure A: Copper slag at MMHE
Figure B: Informal discussion with MMHE personnel
Figure C: Equipment use for compressive and tensile test
Figure D: Casting the concrete into the mould
FULL RESULT FOR COMPRESSION TEST Mix 1
Mix2
Mix3
Mix4
Mlx5
35.32 6.8
38.48 6.8
30.87 6.6
31.39 6.80
6.80
43.6 6.8
45.63 6.8
45.44 6.8
44.67 6.8
6.80
45.25
52.96 6.8
0.00 6.8
51.44 6.8
0.00
53.99 6.80
57.98 6.8
59.96 6.8
64.19
6.8 6.80
Mix6
Mix7
FULL RESULT FOR TENSILE TEST Mix 1
Mix2
Mix3
Mix4
0.94
0.94
0.94
2.67 0.94
0.94
2.334 0.94
0.94
3.877 0.94
0.94
0.94 0.94
112.4 149.3 3.578
0.94
4.751 0.94
0.000
0.94 0.94
78
MixS
Mix6
273.49 293.77 0.94 0.94 Mix7
3.597 0.94
0.94 0.94 0.94
85 2.707
0.94
2.42 0.94
0.94
88.1 2.492
0.94
74.6 2.376
0.94
2.043 0.94
75.5 2.403
0.94