ANALYSIS OF REWETTING OF HOT SYSTEM
A THESIS SUBMITTED IN PARTIAL FULFILLMENT OF THE REQUIREMENTS FOR THE DEGREE OF
Bachelor of Technology in
Mechanical Engineering
By
ASHUTOSH SINGH
DEPRTMENT OF MECHANICAL ENGINEERING NATIONAL INSTITUTE OF TECHNOLOGY
ROURKELA
NATIONAL INSTITUTE OF TECHNOLOGY ROURKELA
CERTIFICATE
This is to certify that the thesis entitled “ANALYSIS OF REWETTING OF HOT SYSTEM”
submitted by Mr. Ashutosh Singh in partial fulfilment of the requirements for the award of Bachelor of technology Degree in Mechanical Engineering at the National Institute of
Technology, Rourkela (Deemed University) is an authentic work carried out by him under my supervision and guidance.
To the best of my knowledge, the matter embodied in the thesis has not been submitted to any other University / Institute for the award of any Degree or Diploma.
Prof Santosh Kumar Sahu Date:13/05/09 National Institute of Technology
Rourkela-769008
NATIONAL INSTITUTE OF TECHNOLOGY ROURKELA
ACKNOWLEDGEMENT
I deem it a privilege to have been the student of Mechanical Engineering stream in National Institute of Technology, ROURKELA.
My heartfelt thanks to Prof. Santosh Kumar Sahu, my project guide who helped me to bring out this project in good manner with his precious suggestion and rich experience.
I take this opportunity to express our sincere thanks to our project guide for cooperation in accomplishing this project a satisfactory conclusion.
Ashutosh Singh
Roll No.-10503040
Department of Mechanical Engineering
National Institute Of Technology, Rourkela
LIST OF FIGURES FIGURE 1- Longitudinal section of the electrical simulator FIGURE 2- Adopted sequence for solution
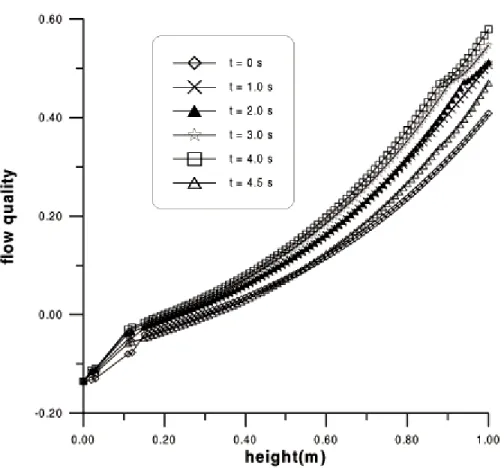
FIGURE 3- Heat transfer coefficient versus height of the channel for several time instants FIGURE4- Flow quality as a function of the channel height for several time instants FIGURE 5- Clad temperature as a function of the channel height for several time instants FIGURE 6- Mass flow influence on CHF position versus time
FIGURE 7- Pressure influence on the CHF position versus time.
FIGURE 8- Mass flow influence on the CHF position versus time with a coolant pressure at 8.00 Mpa
LIST OF TABLES
TABLE 1-GEOMETRIC PARAMETERS OF HEATED ROD.
TABLE 2-COOLANT CHANNEL PARAMETERS
CONTENTS
1.1-INTRODUCTION
1.2-THEORETICAL MODEL 1.3-RESULTS
1.4-CONCLUSIONS 1.5-APPENDIX
1.6-REFERENCES
ABSTRACT
In nuclear reactors, the occurrence of critical heat flux leads to fuel rod overheating with clad fusion and radioactive products leakage. To predict the effects of such phenomenon, experiments are performed using electrically heated rods to simulate operational and accidental conditions of nuclear fuel rods. In the present work, it is performed a theoretical analysis of the drying and rewetting front propagation during a critical heat flux experiment, starting with the application of an electrical power step from steady state condition. After the occurrence of critical heat flux, the drying front propagation is predicted. After a few seconds, a power cut is considered and the rewetting front behavior is analytically observed. Studies performed with various values of coolant mass flow rate show that this variable has more influence on the drying front velocity than on the rewetting one
INTRODUCTION
Following thesis deals with understanding the rewetting and drying phenomena during critical heat flux in nuclear reactors. An attempt has been made to study the occurrence of critical heat flux that leads to fuel rod overheating with clad fusion and radioactive products leakage.Theoretical observation of experiments performed using electrically heated rods to simulate operational and accidental conditions of nuclear fuel rods has been made. An in-depth study has been carried out to explore the theoretical model that deals with the mathematical aspect of the solution. Results obtained during experiments give more accurate picture of the solution
The present work, analyzes the thermal behavior of a typical electrically heated rod with indirect heating, as shown in Figure 1, during a step transient of the electrical power. From a steady state condition, at a given power, it is imposed a 10% power step of its initial value in order to produce the CHF. It is, then, observed the effect of pressure and flow rate in the drying and rewetting front propagation velocities.
(1.2)THEORETICAL MODEL
Consider the universally adopted test section, with indirect heating, shown hematically in Figure 1. Heat is generated in the electrical resistance by an electrical current, is conducted axially and radially, and is removed by the water flowing longitudinally along the rod. The heat transfer coefficient is a function of the local coolant conditions.
In order to analyze the thermal behavior of this system, it was considered:
• circular symmetry of the electrical heaters;
• uniform axial heat generation;
• no heat losses through the ends of the rod;
• constant thermal properties of the materials of the rod;
• homogeneous model for the water two-phase flow.
For the several regions of the rod, the heat conduction equation can be written as:
where T is the rod temperature; k, the thermal conductivity; r , the density and cp , the specific heat of each material. The volumetric heat generation, q, is zero for all material except for the electrical resistance.
According to Silva Neto et alii(1983), the lumped form of the energy equation for the water coolant can be written as:
where q" is the heat flux received by the coolant; A is the cross section area of the channel; p is the rod perimeter and hf , rf and G are the enthalpy, density and mass flux of the coolant, respectively.
The coupling between the rod and the flow is established by the surface heat removal given by:
Where kclad is the thermal conductivity of the cladding; href is the heat transfer coefficient between cladding and coolant; Tf is the coolant temperature and Rext =R4, the outer radius of the cladding.
The correlations presented in Appendix A were considered for the heat transfer coefficient, taking into account the several heat transfer regimes. Although several different correlations can be found in literature, these were considered adequate for the present situation.
The heat conduction equation for the rod was solved by the finite control volume method with an implicit formulation. For the water enthalpy, equations were solved iteratively.
To take into account the surface-water coupling, in any length of the coolant channel, the sequence shown in Figure 2, with the variables Twall, href and q" defined in Appendix A, was adopted.
(1.3)Results
An analytical solution was developed to analyze the critical heat flux for a several types of transients. Here the classical case of a step power transient is presented. At t=0s, the variable qo (the linear power density) is increased by 10% from its steady state value of 16 600 W/m, in order to reach the CHF. The new level is then maintained for 4.0 s and then the electric power is cut off. The entire transient lasts 4.5 s.
The tables below show the physical and geometric parameters used. The electrically heated rod is composed of a Ni-Cr ( 18 to 20% Cr and 8 to 12% Ni ) resistance, a MgO electric insulator
and stainless steel ( type 349 ) cladding. The time step used in discretization is 5 x 10 -2 s. The numbers of nodes considered are: five in the internal insulator, nine in the resistance, four in the internal insulator and four in the cladding. The axial interval is equal to 10-2 m.
The variation of the heat transfer coefficient versus height in the coolant channel, for several time instants, is shown in Fig. 3. Since the heat transfer coefficient for subcooled boiling is function of the wall temperature, it is observed that it will rise steadily until saturation is reached.
After saturation, its value remains constant. When CHF occurs near the end of the channel, the heat removal degrades and the heat transfer coefficient suffers a severe drop as observed. This heat transfer crisis tends to travel to lower heights as time increases, which corresponds to a drying front propagation. For t = 4.0 s, the heat transfer coefficient drop is as large as 97%.
When the power is cut off, the heat transfer coefficient drops along the rod due to the reduction of the rod superficial temperature.
Figure 4 shows the flow quality, where three different boiling regions can be observed, separated by the inflections of the curves. The first one separates the region of forced convection and subcooled boiling from the region of saturated boiling. The second inflection divides this last region from the post-dryout region. Near the entrance, a sharp increase in flow quality is observed, followed by a smooth increase when the CHF phenomenon occurs. There is a reduction in the quality growth, indicating the position and instant of time where it takes place.
This behavior can be explained by the reduction of the superficial flux and consequently a smaller increase of the enthalpy. The maximum flow quality in this transient is equal to 0.57 at the outlet of the channel at t = 4.0 s.
The effect of the heat transfer regimes reflects on the clad temperature as shown in Fig.5. A maximum increase of 22% is seen in the clad temperatures when the boiling crisis phenomenon occurs. Clad melting can be avoided if the electric power supply is interrupted. Some clad points show temperature rise of 118 oC/s. As a result their temperatures could reach values as high as 1100oC in less than 7.0 s.
The propagation of the drying and rewetting fronts is represented in Figure 6, for several mass flow rates. For mass flow rate equal to 0.0535 m/s, the drying front has a mean velocity of 4.6 cm/s. For the rewetting one, this velocity is 2.4 cm/s. The front velocities presented in Figs.6, 7and 8 are mean velocities which are calculated dividing the maximum distance reached by the front by the correspondent time interval. The mass flow influence on the velocities is also shown. Variations of + 20% and - 20% on the reference case ( = 0.0535 kg/s) are applied. It is noted that, as this variable rises, the drying velocity also rises from 4.6 to 4.9 cm/s, while the rewetting one goes from 2.4 to 4.4 cm/s. The CHF does not occur immediately after the power step, due to the radial and axial thermal resistances and conductance of the indirect heated rod. The time delay observed is reduced from 1.0 s to 0.8 s as the mass flow rate increases.
In order to observe the pressure influence on the reported velocities, the same transient is then analyzed under the coolant pressure of 8.0 MPa. Its inlet temperature is now equal to 280 oC. A 41% reduction in the pressure value has a strong influence on the rewetting front velocity: an increase of 936%. Otherwise there is a little influence on the drying one: it goes from 3.8 to 3.2 cm/s. These comparisons are shown in Fig. 7.
The pressure also has considerable influence on the time delay which varies from 1.9 s to 1.4 s as the pressure changes from 8.0 MPa to 13.5 MPa.
The influence of the inlet mass flow rate was also investigated for the 8.0 MPa coolant pressure. Other authors have shown that this parameter has accentuated influence on the rewetting velocity at low pressures until 6.9 MPa. The test with a lower pressure was done to validate the model. The result obtained with the present model shown in Fig. 8 and confirms the trend. Note that the inlet mass flow rate has a smaller effect in the drying front. For a 20% reduction in mass flow the rewetting front velocity is reduced in 29.5%: It varies from 24.7 to 17.4 cm/s.
(1.4)Conclusions
The present work analyzes the front propagation velocity for the drying out and rewetting processes, during the occurrence of critical heat flux in electrically heated simulators of nuclear fuel rods, caused by a power step.
This study is very important in the simulation of nuclear power plants as well as in metallurgical problems. At the occurrence of CHF, the amount of time required to cut off the electric power used in the heating of the simulator needs to be quantified. After the power cut off, the surface is rewetted when the temperature of the wall is less than the critical one. The two phenomena were analyzed individually by several authors (Carlson (1989), Olek et al. (1988), Griffith et al.(1988)) and there were no information about the amount of time available for the operation of the protection systems. Specially, there were few informations about rewetting,
studied before only for descending films at low pressures. The work here presented supplies part of this lack of information.
Due to the radial and axial thermal resistances and capacitances of the indirect heating of the rod, the critical heat flux does not occur immediately after the power step. A certain time delay is observed. This time delay is reduced by increasing the pressure or the mass flow rate. In the beginning of the occurrence of CHF, the velocity of the propagation of the drying front is very high, being reduced gradually to an approximately constant value, around 4.6 cm/s. After the power cut off, the rewetting front presents a very large velocity of propagation, which is greatly affected by the system pressure and mass flow rate. The rewetting velocities were 24.7 cm/s and 2.4 cm/s for pressures of 8.0 MPa and 13.5 MPa, respectively. For the case of pressure of 8.0 MPa, the rewetting front propagation velocities were 17.4 cm/s and 24.7 cm/s for flow rates of 0.0471 kg/s and 0.0539 kg/s, respectively.
At the spot where the occurrence of CHF first starts, it was observed that the temperature increases at a rate of 118° C/s, which indicates that the wall temperature would reach its temperature limit, estimated around 1100° C, in approximately 7s. This is the amount of time available to turn off the electrical power supply. This observed heating rate is much larger than the value obtain by Mosaad (1988).
Additional details of the present work can be obtained in Lima (1997).
(1.5) Appendix
a) Forced convection: DITTUS - BOELTERs correlation (BJORNARD (1977)).
where k is the coolant thermal conductivity; De , the hydraulic diameter of the channel; Re, the Reynolds number; and Pr , the Prandtl one.
b) Nucleate boiling: THOMs correlation (TONG & WEISMAN, (1979)).
where Twall = external temperature of the cladding; Tsat = saturation temperature; q"SUP = heat flux; e p = pressure.
The transition between forced convection and nucleate boiling may be abrupt. This problem can be solved using the suggestion of Rohsenow(1961) that considers the heat flux divided into two parts:
where the first term refers to the convection in the absence of bubbles and the second is the heat transfer only affected by the bubble movement, without convection. In the present work the first term is calculated using href
obtained from Eq. A.1 and the last one by Eq. A.2.
c) Critical heat flux: EPRI correlation (EPRI Report, 1983).
where A and C are constants which are dependent from pressure, is the local flow quality local, and , the inlet flow quality; is the local heat flux and q"CHF , the critical heat flux.
d) Transition boiling: Bjornards correlation (BJORNARD,1977).
where q"TB is the heat flux in the transition boiling region, and q"MSFB is the heat flux at the Leidenfrost temperature (TMSFB ).
e) Minimum heat flux (Leidenfrost point): BJORNARDs correlation (1977).
where THN is the homogeneous nucleation temperature. This is the temperature at which the nucleation occurs spontaneously in the liquid in the absence of preferred nucleation sites. It is function of the pressure and can be predicted using standard nucleation theory. It can be obtained by the following expression of the TRAC -PF1 handbook:
where DP = 3203.6 - P, ( in psia) and THN in 0F.
f) Film boiling: modified Groenevelds correlation (BJORNARD, (1977)).
where: Y = two-phase flow factor of Miropolskiy, x = flow quality; Prwall = Prandtl number evaluated at temperature Twall; G = coolant mass flux; De = hydraulic diameter of the channel; mg = dynamic viscosity - gaseous phase;
rg = coolant density - gaseous phase; rf = coolant density - liquid phase; kg.=
thermal conductivity –gaseous phase.
(1.6)References
BJORNARD, T. A.; GRIFFITH, P. PWR blowdown heat transfer. In:
Symposium on the thermal and hydraulics aspects of nuclear reactor safety, vol.1: Light Waters Reactors, pp. 17-39, 1977.
CARLSON, R.W., "Spreading of critical heat flux region during testing for onset of critical heat flux", Ann. Nucl. Energy, vol. 6, no. 2, pp. 49-62, 1989.
GRIFFITH, P., MOHAMED, J. A. & BROWN, D., "Dryout front modeling for rod bundles", Nucl. Engin. and Design, vol. 105, pp. 223-229, 1988.
GUNNERSON, F. S. & YACKLE, T. R., "Quenching and rewetting of nuclear fuel rods", Nuclear Technology, vol. 54, pp. 113-117, 1981.
LIMA, R. DE C. F. DE, "Comportamento de vareta aquecida eletricamente durante transitório de fluxo critico de calor", Doctoral Thesis, Instituto de Pesquisas Energéticas e Nucleares / USP , São Paulo, 1997.
MOSAAD, M. Subcooled boiling heat transfer to flowing water in a vertical tube. Doctoral Thesis, Technischen Universitaet Berlin , 1988.
OLEK, S., ZVIRIN, Y. & ELIAS, E., "Rewetting of rod surfaces by falling liquid film as a conjugate heat transfer problem", Int. J. Multiphase Flow, vol. 14, no. 1, pp. 13-33, 1988.
PARAMETRIC STUDY of CHF data, volume 2. A generalized subchannel CHF correlation for PWR and BWR fuel assemblies. Prepared for Electric Power Research Institut, California, 1983.
SILVA NETO, A. J. da, ROBERTY, N.C., CARMO, E.G.D. CRISTE - um subcódigo para o cálculo da distribuição axial, transiente, de temperaturas no canal de um reator PWR. Internal Report PEN-132, COPPE/UFRJ, Rio de Janeiro, 1983.
TONG, L.S. & WEISMAN, J. Thermal analysis of pressurized water reactors, American Nuclear Society, 1979.
TRAC-PF1. An advanced best-estimate computer program for pressurized water-reactor analysis. Safety Code Development Group Energy Division.
YU, S.K.W., FARMER, P. R. & CONEY, M.W.E., "Methods and correlations for the prediction of quenching rates on hot surfaces", Int. J.
Multiphase Flow, vol. 3, pp. 415-448, 1977.