ENERGY RECOVERY HEAT EXCHANGER PERFORMANCE
IN BUILDING’S AIR CONDITIONING SYSTEM
By
NIK MOHD HAFIZZAL AB RAZAK 12779
A project dissertation submitted to the Mechanical Engineering Programme
Universiti Teknologi PETRONAS in partial fulfillment of the requirement for the
BACHELOR OF ENGINEERING (Hons) (MECHANICAL ENGINEERING)
MAY 2013
Universiti Teknologi PETRONAS Bandar Seri Iskandar
31750 Tronoh Perak Darul Ridzuan
1 CERTIFICATION OF ORIGINALITY
This is to certify that I am responsible for the work submitted in this project, that the original work is my own except as specified in the references and acknowledgements, and that the original work contained herein have not been undertaken or done by unspecified sources or persons.
___________________________________________
NIK MOHD HAFIZZAL ABD RAZAK
2
CERTIFICATION OF APPROVAL
ENERGY RECOVERY HEAT EXCHANGER PERFORMANCE IN BUILDING’S AIR CONDITIONING SYSTEM
by
Nik Mohd Hafizzal Ab Razak A project dissertation submitted to the
Mechanical Engineering Programme Universiti Teknologi PETRONAS in partial fulfillment of the requirement for the
BACHELOR OF ENGINEERING (Hons) (MECHANICAL ENGINEERING) Approved by,
_____________________
UNIVERSITI TEKNOLOGI PETRONAS TRONOH, PERAK
May 2013
3 ABSTRACT
Nowadays, the urbanity and industrial growth have led people to spend about 90% of their time in the buildings which result in high energy demand for optimal thermal comfort. The design in heating, ventilation and air conditioning (HVAC) industry need a very high attention in order to provide a good indoor air quality (IAQ) and consume less energy in term of cooling and heating process. The use of 100% fresh air in any HVAC systems is necessary, and due to this reason cooling and heating load in conventional HVAC system consume large amount of energy especially in hot and humid region. In this project, the thermal performance of a Z shape enthalpy heat exchanger utilizing 70gsm Kraft paper as heat and moisture transfer surface has been investigated. Effect of different inlet air humidity ratio conditions on the heat exchanger effectiveness and on the energy recovered by the heat exchanger have been the main focus of this investigation. A typical air conditioning cooling coil which incorporates an enthalpy heat exchanger has been modeled for tropical climate. Under test conditions, results have shown that the latent effectiveness and the moisture resistance coefficient have strong dependency on the inlet air humidity ratio. Moreover, the latent effectiveness has been found to be strongly dependent on the moisture resistance coefficient rather than the convective mass transfer coefficient. Finally, annual energy analysis for Kuala Lumpur, Dubai, Miami, Rome and Sydney weather conditions have also shown that a significant amount of energy can be recovered since the Z shape enthalpy heat exchanger utilize the room exhaust air to pre-condition the ambient fresh air.
4
ACKNOWLEDGEMENTS
First and foremost I would like to thank to my supervisor Dr. Mohammad Shakir Nasif for his endless support, knowledge and experiences he had shared with me. With his encouragement and compassionate hospitality from the first meeting, till the end enables me to develop a better understanding of my project. This research studies would not have been made possible without his consistence effort fostering me to my very best in order to strive towards excellent.
I also would like to thank to the other lecturers in the Mechanical Engineering Department, who have spend their precious time to share their thoughts to me that were very much contributed in this thesis. With their passion in enduring my mistakes and my weaknesses, they have contributed significantly make this thesis a success.
Lastly, I also would like to also express my appreciation to my family and friends who gave endless support and motivation throughout all the difficulties that I had encountered in completing this thesis.
5 Table of Contents
ACKNOWLEDGEMENTS ... 4
LIST OF FIGURES ... 6
LIST OF TABLES ... 7
1.0INTRODUCTION ... 8
1.1BACKGROUND OF STUDY ... 8
1.2 PROBLEM STATEMENT ... 9
1.3 OBJECTIVES AND SCOPE OF STUDY ... 10
1.4 RELEVANCY OF THE PROJECT ... 10
1.5 FEASIBILITY OF THE PROJECT ... 10
2.0 LITERATURE REVIEW ... 11
2.1 Parameter for Z shape air-to-air heat exchanger ... 14
3.0 METHODOLOGY ... 16
3.1 PROJECT FLOW CHART ... 16
3.2 Effectiveness Measurements ... 17
3.3 Mathematical Modelling ... 18
3.3.1 Sensible Heat ... 18
3.3.2 Latent Heat ... 20
3.4 Energy model ... 22
3.5 Spreadsheet simulation ... 27
3.6 GANTT CHART ... 29
4.0 RESULTS AND ANALYSIS ... 31
5.0 CONCLUSION ... 43
REFERENCES ... 44
6
LIST OF FIGURES
Figure 1: Convective mass transfer coefficient (hmass) vs humidity ratio …………...10
Figure 2. Paper moisture transfer resistance (R) vs humidity ratio. ... 10
Figure 3. Z shape heat exchanger flow configuration ... 12
Figure 4. Detailed view of air flow channel through Z shape heat exchanger ... 13
Figure 5. Methodology for effectiveness calculation and energy modelling ... 15
Figure 6. Air conditioning system coupled with enthalpy heat exchanger. ... 21
Figure 7. System psychometric ... ….21
Figure 8. Weather Data used……… ……….24
Figure 9. Variation history of paper moisture transfer resistance, and convective mass transfer coefficient – Kuala Lumpur………...28
Figure 10. Heat exchanger sensible and latent effectiveness variation history–Kuala Lumpur…29 Figure 11. Comparison of the annual energy recovered and energy consumption– Kuala Lumpur . ... 31
Figure 12 (a): Variation history of paper moisture transfer resistance, (R) and convective mass transfer coefficient, (1/hmass) – Dubai... 33
Figure 12 (b): Variation history of paper moisture transfer resistance, (R) and convective mass transfer coefficient, (1/hmass) – Miami ... 33
Figure 12 (c): Variation history of paper moisture transfer resistance, (R) and convective mass transfer coefficient, (1/hmass) – Rome ... 35
Figure 12 (d): Variation history of paper moisture transfer resistance, (R) and convective mass transfer coefficient, (1/hmass) – Sydney ... 37
Figure 13 (a): Heat exchanger sensible and latent effectiveness variation history– Dubai ... 36
Figure 13 (b): Heat exchanger sensible and latent effectiveness variation history– Miami ... 37
Figure 13 (c): Heat exchanger sensible and latent effectiveness variation history – Rome ... 38
Figure 13 (d): Heat exchanger sensible and latent effectiveness variation history – Sydney ... 39
Figure 14: Comparison of the annual energy for- cooling consumption And annual energy recovered for 5 cities……… 40
7 LIST OF TABLES
Table 1. Initial office room’s parameter ... 19
8 1.0 INTRODUCTION
1.1 BACKGROUND OF STUDY
The depleting nature of primary energy resources, negative environmental impact of fossil fuels and low efficiencies obtained in conventional space heating and cooling are the main reasons for developing alternative heating, ventilating and air-conditioning (HVAC) techniques which can either save energy or utilize low-grade thermal energy sources. According to Niu and Zhang [1, 2], air conditioning has accounted for 1/3 of the total energy use by the whole society. The design of HVAC systems for thermal comfort requires a great concern, so that an optimal level of indoor air quality (IAQ) and humidity may be reached and maintained to ensure a comfortable and healthy environment and to avoid condensation damage to the building envelope and furnishings.
The usage of 100% fresh air and good ventilation in HVAC system are necessary especially when the requirement for fresh air in a building like hospital is not only for breathing purposes, but also for the prevention of deadly epidemic diseases like bird flu and SARs. Due to this requirement, energy expenses for ventilation are very heavy. Zhang et al. [3] Ventilation air accounts for 20-40% of the cooling load for HVAC industry. The ratio can be even higher in hot and humid regions where latent load from fresh air is as heavy as 50% of the cooling load. For such system, it is essential to utilize energy recovery systems in order to create a reduction in energy consumption to this load. The operating principle of the energy recovery systems is to use the room exhaust air to pre-condition the ambient fresh air. As a result, a significant amount of energy is recovered which in return reduces the overall HVAC energy requirement.
Heat exchangers are devices that allow the exchange of heat between two fluids without allowing them to mix with each other. The heat transfer in a heat exchanger usually involves convection in each fluids and conduction through the wall separating the two fluids [4]. Z-shape Enthalpy heat exchanger is a device that can recover both sensible and latent energy by using a porous membrane as the heat and moisture transfer surface [3,
9
4]. This enthalpy heat exchanger is a static device that does not involve any moving parts and can be easily integrated into existing air conditioning system. Theoretically, it could save a large fraction of energy for cooling and dehumidifying the fresh air since cool air and dryness would be recovered from the exhaust stream to the fresh air in summer.
Similarly in winter, the total heat exchangers could also save energy because exhaust moisture and heat can be recovered to save heating and humidification energy for fresh air.
1.2 PROBLEM STATEMENT
One of the primary aspects to consider in designing HVAC system is to ensure thermal comfort condition and indoor air quality reached an optimal level. For some building like hospital, the requirement for fresh air is crucial not only for breathing purposes, but also for the prevention of deadly epidemic diseases like bird flu and SARs that can spread between the occupants. In this regard, the use of 100% fresh air in any HVAC systems is necessary and proper ventilation also very important consideration in order to maintain good indoor humidity to avoid contaminant that can cause hazard to health. Nowadays, the urbanity and industrial growth have led people to spend most of their time working in buildings, which results in high energy demand to provide a thermal comfort. Cooling and heating load in conventional HVAC system consume large amount of energy especially in hot and humid region. Any solution that can provide a significant reduction in energy consumption of HVAC system will be crucial, and new concept of cooling system is needed in order to fulfill this requirement.
10 1.3 OBJECTIVES AND SCOPE OF STUDY
a. To study the effects of different inlet air humidity ratio conditions on the heat exchanger effectiveness by using different weather data.
b. To study the annual energy consumption and comparison on the annual energy recovered for cooling of air conditioning system coupled with heat exchanger in five (5) different locations.
The weather data from Kuala Lumpur, Dubai, Miami, Rome and Sydney will be obtained and used as variable for inlet air humidity ratio in order to study the objectives above. As a control measure, this project will focus on summer season condition for all weather data. This is done to obtain an accurate result for dehumidification process in air conditioning system which is coupled with heat exchanger. The total number of transfer units (NTU) method will be used to calculate the sensible and latent effectiveness of the heat exchanger and the graphical result will be shown to study the variation of the effectiveness as well as the energy recovered for all the cities mentioned earlier.
1.4 RELEVANCY OF THE PROJECT
This project covers the area of study where the performance of Z shaped air-to-air fixed plate energy recovery heat exchanger is examined. The overall energy analysis will be study and the comparison between the annual energy recovered for cooling of air conditioning system coupled with heat exchanger in five different locations will be concluded. Proper analysis of this study will help the author to put theoretical knowledge learned throughout the course of Mechanical Engineering into practical use.
1.5 FEASIBILITY OF THE PROJECT
The overall timeliness of this project covers the duration of two semesters (8 months) and is broken down into two subjects namely Final Year Project I and II. By referring to the Gantt Chart provided in chapter 3.2, this project is expected to be completed over the course of 8 months.
11 2.0 LITERATURE REVIEW
The utilization of air-to-air fixed plate enthalpy energy recovery heat exchanger in HVAC systems is becoming a popular option. This is because it can recover both sensible and latent energy by utilizing permeable material as the heat and moisture transfer surface.
The effectiveness of the enthalpy heat exchanger is relatively high, which reduces the overall HVAC energy consumption. Moreover, it provides fresh air to the occupied spaces which significantly improves buildings’ indoor air quality [1-6]. The performance of the fixed plate enthalpy heat exchanger is usually evaluated through calculating the heat exchanger sensible, latent and total effectiveness. Researchers have found that the sensible effectiveness is higher than the latent effectiveness. This is due to the high moisture transfer resistance across the permeable surface in comparison with the surface conduction thermal resistance. Due to the small thickness of the permeable surface, the surface conduction thermal resistance can be ignored [7 and 8].
Researchers have found that sensible effectiveness remains almost constant when the heat exchanger inlets air conditions vary. However, the research has shown that the heat exchanger latent effectiveness varies when the air inlets conditions change. The variation in the latent effectiveness was attributed to the variation of the permeable surface moisture transfer resistance (R). It has been found that the moisture transfer resistance, R was affected by the inlets operating conditions unlike conduction heat transfer resistance of the permeable surface which remained almost constant [7, 8, and 10].
Zhang and Niu [10] illustrated a cross flow enthalpy heat exchanger utilizing permeable membrane as the heat and moisture transfer surface. They used humidity ratio gradient in their model as the driving force for moisture transfer. As a result, they underlined the fact that the membrane mass diffusive resistance changes with the operating conditions. Similarly, Min and Su [6] developed a mathematical model to calculate the membrane moisture transfer resistance. Unlike Niu and Zhang, Min and Su utilized the relative humidity difference as the driving force of moisture transfer. They also found that the membrane moisture transfer resistance varied with inlet conditions of the enthalpy heat exchanger.
12
Based on results discovered by Nasif, the overall mass transfer coefficient which consisted of the convective mass transfer coefficient, hmass and moisture transfer resistance, R was the main factor behind the variation in latent and sensible effectiveness. Fig. 1 and Fig. 2 shows the variations in the convective mass transfer coefficient and moisture Figure 1: Convective mass transfer coefficient (hmass) vs humidity ratio
Figure 2: Paper moisture transfer resistance (R) vs humidity ratio
13
transfer resistance as a function of humidity ratio gradient. The variations in the convective mass transfer coefficient, shown in Fig.1, were minimal and points present had an almost constant value for the entire corresponding humidity ratio gradient values but for the paper moisture transfer resistance as shown in Fig.2, the R value increases with humidity ratio gradient increases.
Zhang and Niu modelled the air cycle of an air conditioner coupled with a membrane heat exchanger. In their model, they incorporated the membrane moisture transfer resistance variation due to various inlet air operation conditions using Hong Kong weather data. Their results clearly showed that the latent effectiveness varied whilst the sensible effectiveness was almost constant. However, they commented that the variation in latent effectiveness was stable. However, in their research they did not compare the energy recovered with similar heat exchangers under constant membrane moisture transfer resistance.
Nasif et al. [5] investigated the enthalpy heat exchanger moisture transfer resistance variation. Their findings showed that the permeable surface moisture transfer resistance varied with air humidity ratio gradient at the heat exchanger inlets which caused the variation of the heat exchanger latent effectiveness. They determined the permeable surface moisture transfer resistance by using permeability measurement under controlled humidity environment.
In this research, the performance of a Z shape air-to-air heat exchanger under different inlet air conditions is evaluated experimentally. The permeable surface moisture transfer resistance is calculated from the heat exchanger measured effectiveness and the developed mathematical model under different inlet air conditions. Finally, annual energy analysis is performed for enthalpy exchanger system under variable effectiveness and compared with energy performance of the same heat exchanger system but under constant latent effectiveness for Singapore tropical weather climate where the latent load is significant.
14
2.1 Parameter for Z shape air-to-air heat exchanger
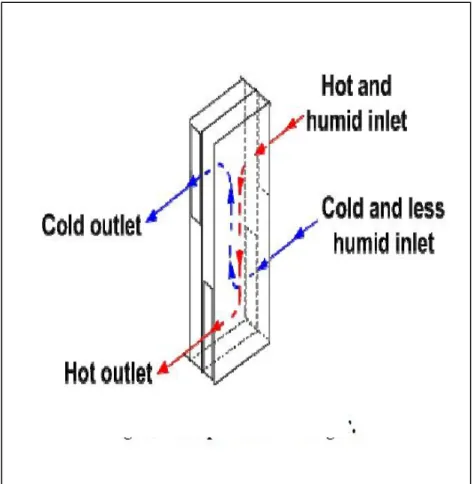
In this project, the thermal performance of a Z shape flow configuration heat exchanger utilizing 70gsm Kraft paper as the heat and moisture transfer surface has been investigated as shown in figure below. Effects of different inlet air humidity ratio conditions on the heat exchanger effectiveness and on the energy recovered by the heat exchanger have been the main focus of this investigation. The performance of this fixed plate enthalpy heat exchanger, similar to the one shown in figure 3, is usually evaluated through calculating the heat exchanger sensible, latent and total effectiveness. Zhang et al.
[7] have found that the sensible effectiveness is higher than the latent effectiveness. This is due to the high moisture transfer resistance across the permeable surface in comparison with the surface conduction thermal resistance. Due to the small thickness of the permeable surface, the surface conduction thermal resistance can be ignored.
Figure 3: Z shape heat exchanger
15
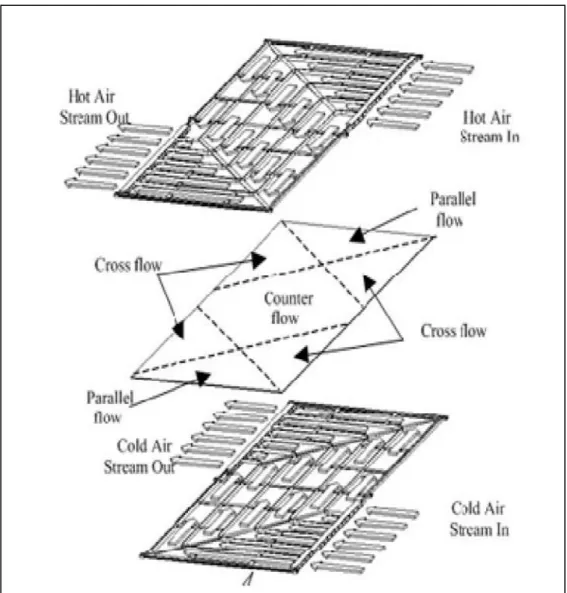
The Z flow configuration, shown in Fig. 4, provides a counter flow arrangement over most of the transfer surface. This arrangement maximizes the heat and moisture transfer relative to the ideal counter flow arrangement over a considerable part of the heat exchanger surface. The heat exchanger is made up of 98 plastic frame flow passages with 49 inlet air passages in each of the air streams. The plastic frames are assembled together in an alternating pattern and the passage of the cold air stream is laterally inverted from the passage of the hot air stream.
Fig 4: Detailed view of air flow channel through Z shape heat exchanger
16 3.0 METHODOLOGY
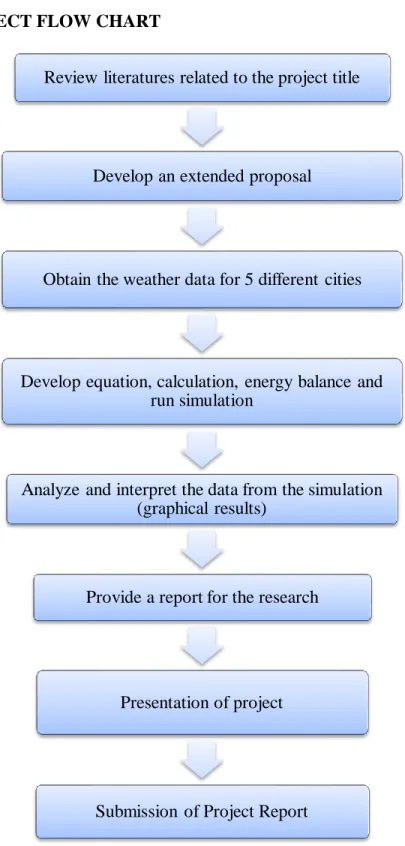
3.1 PROJECT FLOW CHART
Review literatures related to the project title
Develop an extended proposal
Obtain the weather data for 5 different cities
Develop equation, calculation, energy balance and run simulation
Analyze and interpret the data from the simulation (graphical results)
Provide a report for the research
Presentation of project
Submission of Project Report
Figure 5: Methodology for effectiveness calculation and energy modelling
17 3.2 Effectiveness Measurements
Theoretically, the performance of the Z shape air-to-air heat exchanger is evaluated by calculating the heat exchanger sensible and latent effectiveness. The sensible and latent effectiveness are calculated using Eq. (1) and Eq. (2), respectively.
( ) ( )
( ) ( )
( ) ( )
( ) ( )
Since the Z shape configuration heat exchanger is used, total effectiveness calculation must include the effectiveness for counter flow, cross flow and parallel flow for the same heat exchanger. Hence, mathematical models were developed using effectiveness-NTU method to predict the heat exchanger effectiveness.
T/ω hi T/ω ho
T/ω ci
T/ω co
18 3.3 Mathematical Modelling
Determining the heat exchanger permeable surface moisture transfer resistance from direct measurements is difficult and sometimes expensive and complicated. As a result, mathematical models were developed using effectiveness-NTU method to predict the heat exchanger effectiveness.
3.3.1 Sensible Heat
To model sensible heat transfer in the heat exchanger, a mathematical model was developed based on Nusselt number and Reynolds number correlation of each air channel.
The heat exchanger inlet face velocity was assumed to be 0.75m/s, and the respective air velocity at each air flow passage of the heat exchanger was 1.5m/s. By using the air velocity at each passage, Reynolds number at each flow passage was calculated based on Eq. (4). A Reynolds number value of 970 was estimated concluding that the flow was a laminar flow.
( )
Nusselt number value was estimated based on the Hausen’s correlation for laminar flow in ducts under uniform heat flux [14].
( )
( ) ( ⁄ )
( )
The convective heat transfer coefficient (hheat) is a function of Nu and is calculated as:
( ) The total number of transfer units (NTU) is calculated as:
( ) The general form of the overall sensible heat transfer coefficient, Us is:
[
]
( )
19
The thermal resistance (ᵟ/kther) represents the conduction resistance of the 70gsm Kraft paper and is a function of the material type and thickness. This term was very small due to the small thickness of the paper (130µm) and could be ignored [7,10-13]. The other two terms are the convective heat transfer resistance in the two streams which contributed the largest portion of the sensible heat transfer resistance (Us).
Similarly, the sensible effectiveness for counter flow, cross flow and parallel flow conditions are defined in Eq. (9), Eq. (10) and Eq. (11) respectively.
(
)
(
) (
) ( )
{
[ (
) ]} ( )
(
)
(
) ( )
Where the minimum/maximum stream heat capacity is:
( ) ( ) ( )
The Z flow heat exchanger being investigated is a combination of counter flow, cross flow and parallel flow as shown in Appendix.4. The effectiveness of each flow region was evaluated according to Eqs. (9) – (11) and the overall effectiveness were determined from the area ratio of each region [7].
Therefore, the overall sensible effectiveness of the heat exchanger could be obtained by combining Eqs. (9) – (11):
(
) (
) (
) ( )
20
The counter flow area, for the current Z flow heat exchanger, was found to be equal to 36% of the total heat transfer area. Similarly, the cross flow and parallel flow areas were 43% and 21% of the total heat transfer area, respectively.
3.3.2 Latent Heat
A latent heat transfer model was, also developed to simulate moisture transfer using the convective mass transfer Sherwood correlation. The convective mass transfer coefficient can be obtained using the Chilton-Colburn analogy [15].
( )
Where Sherwood number is defined as:
( )
By substituting Nusselt number from Eq. (6) and Sherwood number from Eq. (15) into Eq.
(14), the convective mass transfer coefficient (hmass) can be defined as:
( ) It has been found that Lewis number value was around 0.81 for the conditions studied [8,11].
The number of latent transfer units (NTUL) is:
( )
21 The overall mass transfer coefficient (UL) is given by:
[
]
( )
The moisture resistance of the porous paper is Rpaper and the other two terms are the convective mass transfer resistance at each flow stream. Similarly to the sensible effectiveness, latent effectiveness is calculated using the following correlations for different heat exchanger configurations [7].
(
)
(
) (
) ( )
{
[ (
) ]} ( )
(
)
(
) ( )
(
) (
) (
) ( )
22 3.4 Energy model
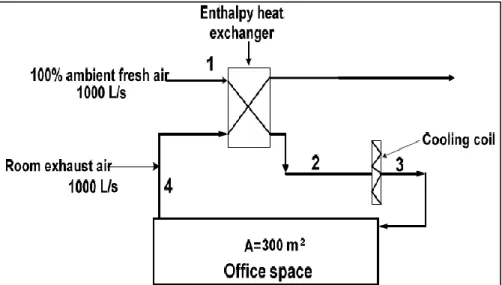
The main objective of the energy modeling is to study the effect of paper moisture transfer resistance variation on the enthalpy heat exchanger performance. The air cycle of an air conditioning cooling coil coupled with the enthalpy heat exchanger was modelled.
The developed mathematical model of the heat exchanger was incorporated into an energy model to study the effect of varying inlet air conditions on the heat exchanger performance and subsequent energy recovered. Furthermore, it was used to study the impact of this variation on the annual energy recovered by the enthalpy heat exchanger.
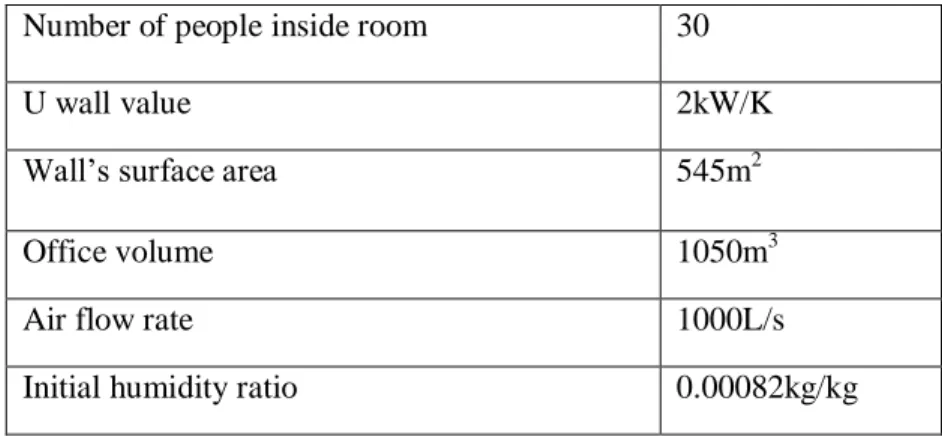
An air conditioning cooling coil which supplies 100% fresh air coupled with an enthalpy heat exchanger was modelled as shown in Fig. 6. The analysis was conducted for an office space of 300m2, office height of 3.5m which operates 24 hours - seven days a week, and for an internal load of 20kW and occupant moisture generation of 0.04kg/hr per person. For energy modeling purposes, Kuala Lumpur weather data was used as the first variable due to the high latent loads. The table below shows the details for all initial parameter required in order to develop the energy model analysis.
Number of people inside room 30
U wall value 2kW/K
Wall’s surface area 545m2
Office volume 1050m3
Air flow rate 1000L/s
Initial humidity ratio 0.00082kg/kg
Table 1: Initial office room’s parameter
23
Process 1 to 2 in Fig.6 represents the cooling and dehumidification process inside the enthalpy heat exchanger. Point 2 indicates the air-on conditions (T2 and ω2) at the cooling coil inlet were calculated as follows:
( ) ( ) Figure 6: Air conditioning system coupled with enthalpy heat exchanger.
Figure 7: System psychometric
24
( ) ( )
The air discharged from the heat exchanger was cooled and dehumidified at the cooling coil (point 3). Cooling coil effectiveness value of 0.9 was used in this simulation, whereas the air-off humidity (point 3) was assumed to have a value of 0.95. The air-off temperature at this point depended on the cooling coil efficiency and it was calculated from:
( ) ( )
The simulation was carried out by reading Kuala Lumpur hourly weather data. The coil-off calculation was performed from the above equations based on the supplied air condition (air-on conditions). The cooling provided by air conditioner was calculated from:
( ) ( )
The heat transfer through the room walls was calculated from:
( ) ( )
The sensible cooling load provided by the air conditioner was considered to be the sum of the heat transferred via the walls and the heating load within the space:
( )
Substituting equations. (28) and (29) into (30), the office temperature can be obtain as follow:
( )
25
Moisture content in the room at each time step will be calculated as follows:
( )
( )
Where mroom moisture is the room moisture content (kg), mioccupant represent the occupant’s total moisture generation at specified time step, mi-1room moisture represents room moisture content at previous time step, micoil moisture is coil air off supplied moisture at specified time step, and mimoisture room exhaust corresponds to moisture discharged from the room exhaust air at specified time step.
The amount of energy recovered by the enthalpy heat exchanger will be calculated at each time step in accordance with eq. (33). The annual total energy recovered by the enthalpy heat exchanger will be summed for the modeled heat exchanger with variable moisture transfer resistance.
( ) ( )
The developed sensible and latent mathematical models were used at each time step in the simulation to calculate the sensible and latent effectiveness. At the start of the calculations, the office air conditions were unknown. It was assumed that for the first time step, the room temperature and relative humidity were 22°C and 50% respectively. The coil air-off conditions were calculated from Eq. (27). The office air temperature and humidity ratio were then calculated from energy and mass balance of the modeled space using Eq. (31) and Eq. (32).
For the next time step, the heat exchanger membrane moisture transfer resistance was calculated from relation Rpaper = 4168.3∆ω based on values of the ambient air and the air leaving the office room. The heat exchanger effectiveness was calculated from the
26
developed sensible and latent mathematical models. The air condition exiting the heat exchanger was obtained from the calculated heat exchanger effectiveness.
Then, the above calculations were repeated by using Dubai, Miami, Rome and Sydney weather data as inlet variable to study the impact of different humidity ratio has on the energy recovered. For the modeled system shown in Fig. 6, when the room temperature was less than 22°C, the air conditioner was turned off. As the result, the heat exchanger acted as a passive cooling device for the room with no energy required for cooling. The building thermal mass was not included in this model in order to simplify the calculation in this project.
27 3.5 Spreadsheet simulation
Five desired weather data was obtained by using weather station software. Data for Kuala Lumpur, Dubai, Miami, Rome, and Sydney was then used in order to study the effect of different inlet air humidity ratio conditions on heat exchanger effectiveness, and on the energy recovered by similar heat exchanger for each individual city. Mathematical equations was then studied and used into spreadsheet in order to obtain all parameters required for each point as indicated in Fig.6.
Figure 8: Weather Data used
28 3.6 SOFTWARE AND TOOLS
Weather Data Station software was used in order to obtain five different weather data as required. Microsoft office excel 2007 was used in order to model the annual energy analysis for cooling energy consumption as well as the total energy recovered by enthalpy heat exchanger in different weather location. Data and mathematical equation will be develop and used in this software to get the heat exchanger effectiveness, variation history of paper moisture transfer resistance and convective mass transfer coefficient, comparison of annual energy for cooling consumption, and finally the comparison of energy recovered for the same heat exchanger.
29 3.7 GANTT CHART
Study Plan for Final Year Project (FYP1)
Action / Event Number of Weeks
1 2 3 4 5 6 7
MID SEMESTER BREAK
8 9 10 11 12 13 14
Initial Studies and Title Selection
1 FYP registration
2 Title selection on FYP1
3 Study on Air conditioning
system
4 Study on heat exchanger
Preparation on completing extended proposal and proposal defense
5 Submission of extended
proposal
6 Study methodology for
project in detailed
7 Study governing equations
8 Proposal defense for FYP1
Details of study and final report for FYP1
9 Obtain weather data for 5
different cities
10 Develop equation in spreadsheet
11 Submission of interim report
30 Study Plan for Final Year Project (FYP 11)
No Task / Activities
Weeks 1 2 3 4 5 6 7
MID SEMESTER BREAK
8 9 10 11 12 13 14 Project Work Continues
1 Proceed FYP1 for other cities 2 Develop equation and simulate into
spreadsheet
3 Analyze data and provide graphical illustration
4 Analyze result, discussion, and modification
5 Progress report submission ●
Project finalization
6 Review result and data obtain 7 Modification and rerun the
simulation if necessary
8 Submission of Draft Report ●
9 Submission of Dissertation ●
10 Submission of Technical Paper ●
11 Oral Presentation ●
12 Submission of Project Dissertation (hard Bound)
●
31 4.0 RESULTS AND ANALYSIS
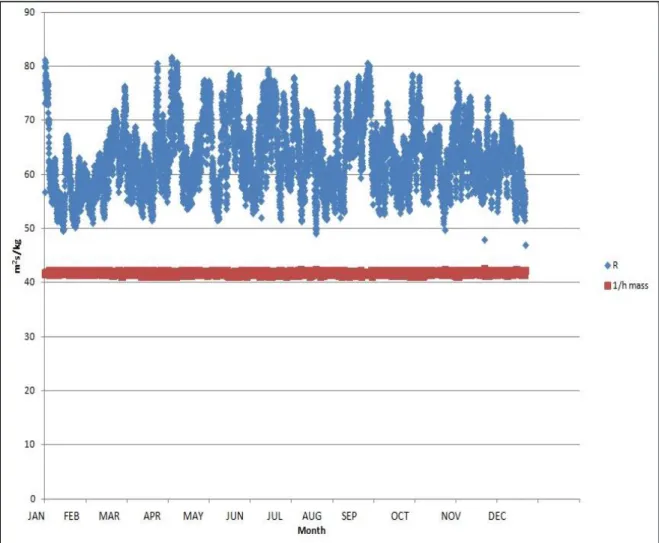
Results from the annual energy modeling confirmed the earlier trends of the main parameters contributing to the heat exchanger effectiveness. Fig. 9 shows paper moisture transfer resistance and convective mass transfer coefficient variation for Kuala Lumpur weather data throughout the year. It can be seen that although the convective mass transfer variation was small, paper moisture transfer resistance variation was significant.
Figure 9: Variation history of paper moisture transfer resistance, (R) and convective mass transfer coefficient, (1/hmass) – Kuala Lumpur
32
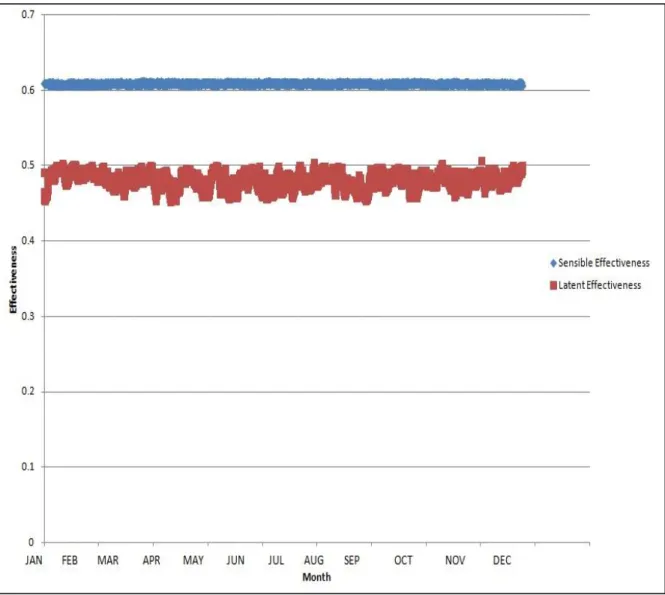
The heat exchanger effectiveness variation is illustrated in Fig. 10. The figure shows that the sensible effectiveness variation was small and could be considered as a constant.
However the latent effectiveness was significant which was attributed to the consequential variation of paper moisture transfer resistance.
Figure 10: Heat exchanger sensible and latent effectiveness variation history – Kuala Lumpur
33
The energy consumption for cooling for the modeled system with Kuala Lumpur weather data was about 707 GJ which is considered high as shown in Fig. 11. This is due to the nature of the working hours of the modelled office. It was assumed that the modelled office operates 24 hours a week and the supplied fresh air flow rate was 1000L/s. Large amount of energy is required in order to cold and dry the ambient air especially in hot and humid weather like Kuala Lumpur. However, a significant large amount of energy was recovered since the cold and dryness was extracted from the room exhaust air to pre- condition the ambient fresh air.
Figure 11: Comparison of the annual energy recovered and energy consumption – Kuala Lumpur
34
The variation history of paper moisture transfer resistance against convective mass transfer coefficient for another four different cities was shown in Fig. 12 (a), (b), (c), and (d).
Based on the graph obtained, the R-value for all four cities were observed to be slightly higher than 1/hmass was mainly due to the low porosity characteristic of the paper that was used as enthalpy heat exchanger. From the results, 1/hmass value was observed to be lower than the R-value for all weather since the thickness of the paper was very low and can be ignored.
Figure 12 (a): Variation history of paper moisture transfer resistance, (R) and convective mass transfer coefficient, (1/hmass) – Dubai
35
Figure 12 (b): Variation history of paper moisture transfer resistance, (R) and convective mass transfer coefficient, (1/hmass) – Miami
36
Figure 12 (c): Variation history of paper moisture transfer resistance, (R) and convective mass transfer coefficient, (1/hmass) – Rome
37
Figure 12 (d): Variation history of paper moisture transfer resistance, (R) and convective mass transfer coefficient, (1/hmass) – Sydney
38
Results from the heat exchanger sensible and latent effectiveness variation history for the rest of the cities confirmed the earlier trends that R-value and latent effectiveness have strong dependency on the inlet air humidity ratio. From the graph obtained as shown in Fig. 13 (a), (b), (c), and (d), they exhibit the same pattern which is the sensible effectiveness remains almost constant when the inlet air conditions vary. However, heat exchanger latent effectiveness varies when the air inlets conditions change. This variation in sensible and latent effectiveness was caused by the thickness of the kraft paper that was used as permeable surface heat exchanger. Due to this thin paper, the conduction of heat through the paper becomes dominant which allows the energy recovered in all cities become easier.
Figure 13 (a): Heat exchanger sensible and latent effectiveness variation history – Dubai
39
Figure 13 (b): Heat exchanger sensible and latent effectiveness variation history – Miami
40
Figure 13 (c): Heat exchanger sensible and latent effectiveness variation history – Rome
41
Figure 13 (d): Heat exchanger sensible and latent effectiveness variation history – Sydney
42
The results of energy consumption for cooling and dehumidification process was found to be slightly higher than energy recovered under constant heat exchanger as shown in Fig.
14. This behavior applies for the first four cities which is Kuala Lumpur, Dubai, Miami, and Rome. For Kuala Lumpur, 708 GJ of energy was required to cold and dry the ambient air, and at the same time 703 GJ of energy can be recovered annually. As for Dubai, 360 GJ of energy was needed to condition the ambient fresh air, while 158 GJ of energy managed to be recovered annually. Different result was obtained for Sydney which has the lowest energy required for cooling since the weather is already cold and dry, thus less energy was needed to condition the ambient fresh air. This shows that more energy will be needed in order to cold and dry the ambient fresh air especially for hot and humid weather.
At the same time, large amount of energy can be recovered by utilizing enthalpy heat exchanger since it can recover both sensible and latent effectiveness. Energy analysis presented in Fig. 14 proved that the actual energy consumed or recovered was dependent on the nature of the permeable surface moisture transfer resistance and on the inlet air condition.
Figure 14: Comparison of the annual energy for- cooling consumption And annual energy recovered for 5 cities
43 5.0 CONCLUSION
The performance of a Z flow heat exchanger utilizing 70gsm Kraft paper as heat and moisture transfer surface has been experimentally evaluated under constant air flow rate and different inlet air moisture content conditions. The performance has been determined in terms of both sensible and latent effectiveness. A mathematical model of the sensible and latent characteristics of the paper membrane heat exchanger has been developed. The developed mathematical model was integrated into the air conditioner cooling coil energy model to calculate the annual energy consumed and energy recovered by the heat exchanger under constant paper moisture transfer resistance.
It has been shown that the sensible effectiveness was near constant, whereas the latent effectiveness exhibited noticeable variation. This variation was attributed to the dependence of moisture resistance of the permeable surface on the variable inlet humidity ratios. In addition, the actual energy consumed and recovered was dependent on the nature of the permeable paper moisture transfer resistance. Energy calculations when Kuala Lumpur weather data was used shows significantly large amount of energy recovered since the cold and dryness was extracted from the room exhaust air to pre-condition the ambient fresh air. This shows the significant effect the inlet humidity ratio has on the energy analysis calculations of air conditioning systems coupled with enthalpy heat exchanger.
As conclusion, the objective of this project is achieved. The use of Z shape enthalpy heat exchanger can create a significant reduction in energy consumption for cooling and dehumidification process in any HVAC system since it uses the room exhaust air to pre-condition the ambient fresh air.
44 REFERENCES
[1] L.Z. Zhang and J.L. Niu, Energy Requirements for Conditioning Fresh Air and the Long-term Savings with a Membrane-Based Energy Recovery Ventilator in Hong Kong, J. Energy. 26 (2001).
[2] L.Z. Zhang and J.L. Niu, Energy Requirements for Conditioning Fresh Air and the Long-term Savings with a Membrane-Based Energy Recovery Ventilator in Hong Kong, J.
Energy. 26 (2001)
[3] M. Nasif, R. AL-Waked, G. Morrison, and M. Behnia, Membrane heat
exchanger in HVAC energy recovery systems, systems energy analysis. J. Energy and Buildings. 42 (2010)
[4] Yunus A.Cengel, Afshin J, Ghajar, Heat and Mass transfer, fundamentals and applications.Science 2011.
[5] J.L. Niu, and L.Z. Zhang, Membrane-based Enthalpy Exchanger: Material
Considerations and Clarification of Moisture Resistance, J. Membrane Science. 189 (2001) [6] J. Min, and M. Su, Performance analysis of a membrane-based enthalpy exchanger:
Effects of the membrane properties on the exchanger performance, J. Membrane Science.
348 (2010)
[7] L.Z. Zhang and J.L. Niu, Energy Requirements for Conditioning Fresh Air and the Long-term Savings with a Membrane-Based Energy Recovery Ventilator in Hong Kong, J. Energy. 26 (2001)
[8] Zhang, L.Z.; Niu, J.L. Indoor humidity behaviors associated with decoupled cooling in hot and humid climates. Building and Environment, 2003
45
[9] Zhang, L.Z.; Zhu, D.S.; Deng, X.H.; Hua, B. Thermodynamic modeling of a novel air dehumidification system. Energy and Buildings, 2005.
[10] Zhang, L.Z.; Zhu, D.S.; Deng, X.H.; Hua, B. Thermodynamic modeling of a novel air dehumidification system. Energy and Buildings, 2005.
[11] J. Min, and Su, Performance analysis of a membrance-based enthalpy exchanger:
Effects of the membrane properties on the exchanger performance, J. Membrane science.
348 (2010) 376-382.
[12] L.Z. Zhang, and J.L. Niu, Energy requirements for conditioning fresh air and the long-term savings with a membrane-based energy recovery ventilator in Hong Kong, J.
Energy. 26 (2001) 119-135
[13] L.Z. Zhang, Progress on heat and moisture recovery with membrance: From fundamentals to engineering applications, J. Energy conversion and management. 63 (2012 173-195)
[14] W.M. Kays, and M.E. Crawford, Convective Heat and Mass Transfer, McGraw- Hill International Edition, Singapore (2005)
[15] L.Z. Zhang, Energy performance of independent air dehumidification systems with energy recovery measures, J. Energy. 31 (2006) 1229-1242
46 APPENDIX –A
Nomenclature
A : area of heat/moisture transfer (m2) Cp : specific heat capacity (J/kgK) C : heat capacity rate (W/K) dhy : hydraulic diameter (m)
Dvs : diffusion coefficient of vapour into air (m2/s)
h : convective heat/mass transfer coefficient. For heat transfer (W/m2K) and for mass transfer (m/s).
H : enthalpy (J/kg)
hfg : enthalpy of evaporation (J/kg) k : thermal conductivity of air (W/mK)
kther : thermal conductivity of paper film (W/mK) Le : lewis number
ṁ : mass flow rate (kg/s) Pr : prandtl number
Rpaper : paper moisture transfer resistance (m2s/kg) T : temperature (°C)
U : total heat/mass transfer coefficient. For heat transfer (W/m2K) and for mass transfer (kg/m2s)
V : velocity of air stream (m/s)
47 APPENDIX-B
1.
Appendix 1: Z shape heat exchanger
48 2.
Appendix 2: Detailed view of air flow channel through Z shape heat exchanger
49 3.
Appendix 3: Air conditioning system coupled with enthalpy heat exchanger.
50 4.
Appendix 4: Heat exchanger flow arrangement