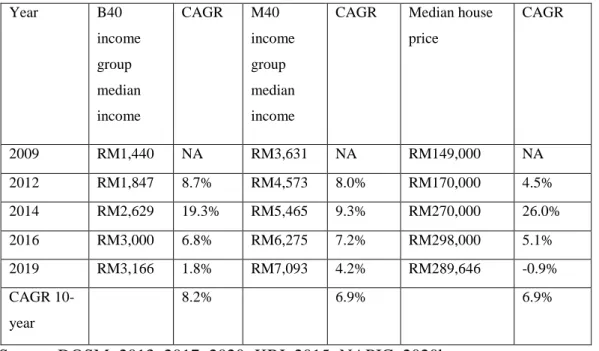
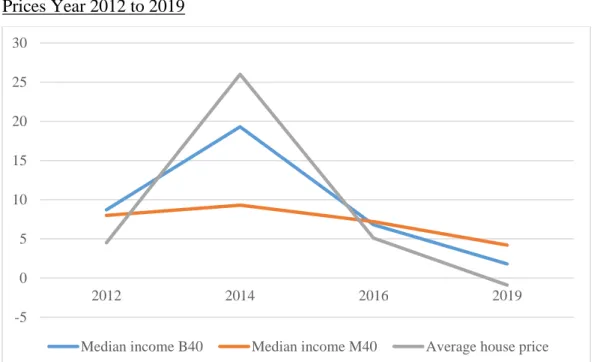
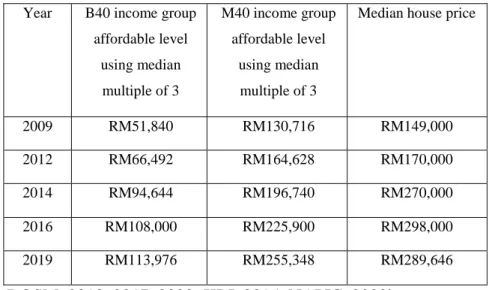
Thus, the analysis revealed 7 decisive factors influencing the decision of income group B40 and M40 to buy an affordable house in Malaysia. In addition, the study also confirmed that housing affordability is the main determining factor influencing the decision of the B40 and M40 income group to purchase an affordable house in Malaysia.
INTRODUCTION
Background
The 10th Malaysia Plan introduced a new policy for the Malaysian government to provide adequate affordable housing that caters to the low-income group as well as the middle-income groups. Malaysia's National Housing Policy states the government's commitment to provide adequate, comfortable, quality and affordable housing to improve the standard of living of its people.

Problem Statement
According to Abdullateef and Tan (2017), the likelihood of an imbalance in the supply and demand for affordable housing is due to a lack of match between the choice of home buyers and the supply. However, the factors that influence these homebuyers may not be the same as those of affordable housing homebuyers.
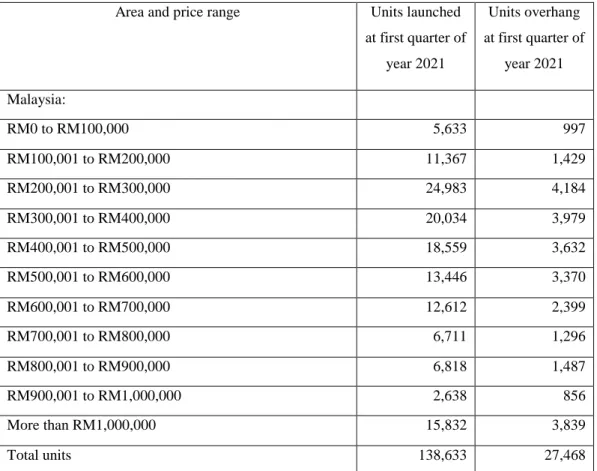
Research Question
Research Objective
Significant of the Study
The findings in this study can also guide the policy maker, urban planner and property developer in planning affordable housing priced at RM300,000 or below in Malaysia to achieve better effectiveness and competitive advantage in meeting the B40 - and M40 income groups. housing needs. Proper planning of affordable housing development based on the determinants of home buyers in the B40 and M40 income brackets is expected to allow supply to better meet demand. Potential homebuyers will thus benefit from suitable, affordable housing and ultimately reduce demand. ownership transfer situation.
Outline of the Research
Thus, given that overcrowding of affordable housing properties may not be entirely the affordability issue, this research attempts to investigate other possible influencing factors, including the potential buyer's view of affordable housing as important branding and the developer factor in affordable housing. On top of this implication suggestion, the limitation of the study and recommendation is revealed.
LITERATURE REVIEW
Introduction
Affordability Measurement
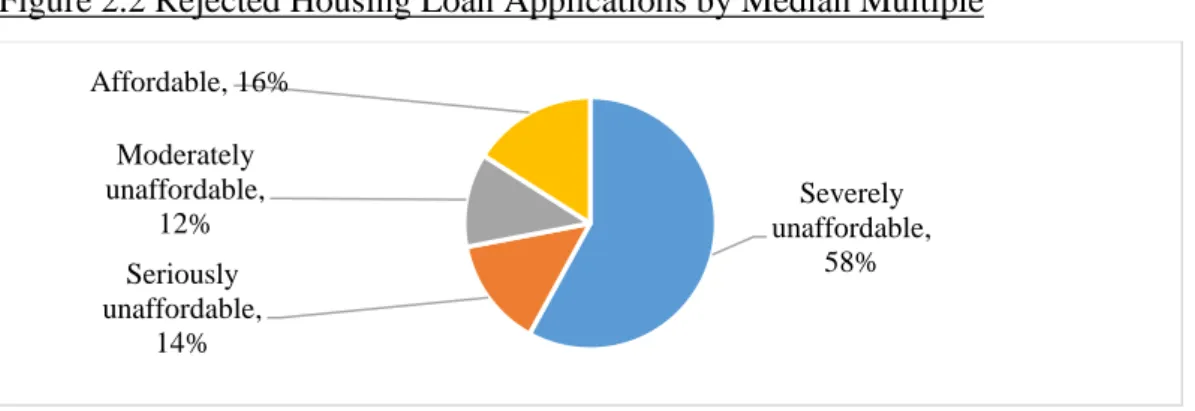
In Malaysia, a similar approach, namely debt service ratio, has been commonly used by financial institutions to determine the potential home buyers' affordability by evaluating the borrower/applicant's ability to repay (BNM, 2016). The debt service ratio gives an indication of the leverage level of a borrower/applicant whose loan application the financial institution can refuse if the borrower/applicant is over-leveraged.
Housing Affordability
- Household Income
- Property Price
- Affordable Housing Scheme and Government Policies
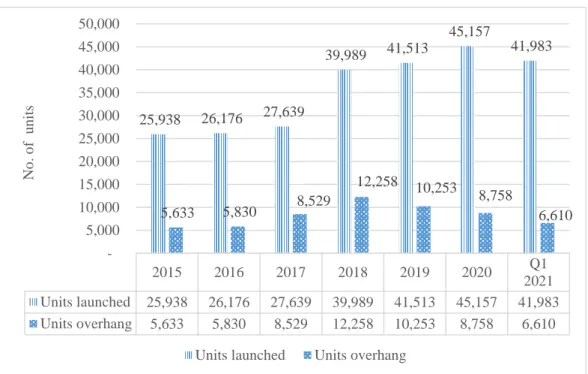
- Property Overhang
- Demographic
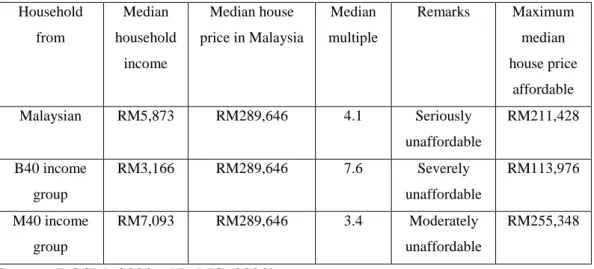
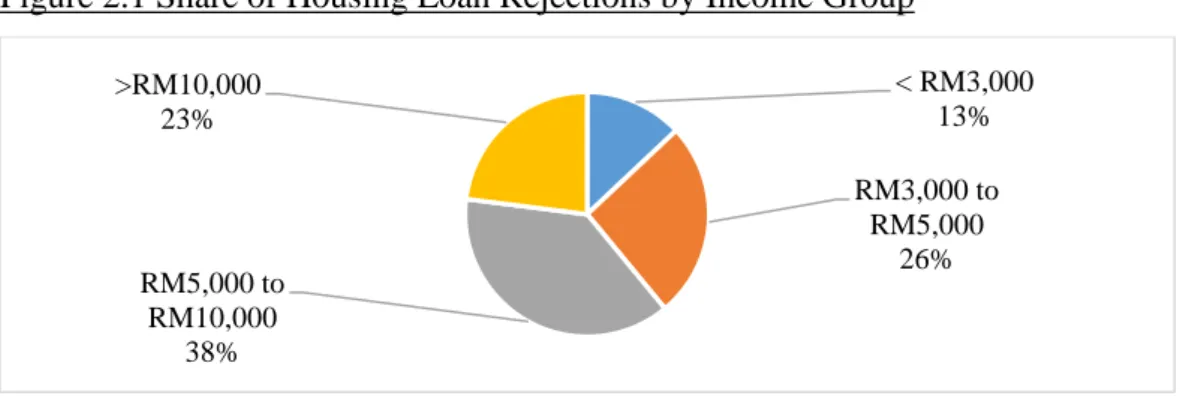
Furthermore, it was reported that the B40 income group spends up to 25.6% of their income on housing costs while the M40 income group spends around 22.8% in the same period. RMM SPNB This scheme provides low, medium and medium cost housing to the low income group.
Building Factor
In addition, the authors also found that among various demographic profiles, only marital status, number of households, monthly household income, and level of education have a strong relationship with housing affordability. In addition, the KRI (2015) study found that the types of housing sought are subject to family composition and the advancement of family income over time. For example, a large family may need a larger living space, however if the market does not offer such housing within the family's affordable level, it is likely that the purchase of the house will not be realized.
Location Factor
Accessibility Factor
Neighbourhood Factor
Developer’s Attributes
& Tan, 2017). The sick project may affect the purchasing decision of home buyers in the developer's future projects due to its notorious brand image. 2019) study found that the home buyer has a higher tendency to own their home from a prominent developer as opposed to a lesser known developer due to perceived value and quality. In some cases, developers create a development product line with similar concept, quality and design to differentiate their product from their competitors such as PR1MA from Perbadanan PR1MA Malaysia, Eco series from EcoWorld group and M Series from Mah Sing Group. As a result of the outstanding reputation status, the brand strategy gives a competitive advantage to the company that encourages home buyers in their purchase decision (Yap et al., 2019).
Theoretical Framework and Hypotheses
RESEARCH METHODOLOGY
Introduction
Research design
Similarly, a deductive approach was more appropriate to use in this research as this study aims to identify the main factors influencing the decision of B40 and M40 income group to purchase an affordable house priced at RM300,000 or less in Malaysia. In addition, this study also investigates whether housing affordability is the main factor influencing such a purchase decision and what are the other factors that also influence the decision to purchase a home. Consequently, quantitative research was chosen for use in this study due to the similarity of characteristics in this study and its descriptive nature.
Population
Sampling Design
Data collection can be collected only once or over a period of time to answer the research questions (Sekaran & Bougie, 2016). In a cross-sectional study, it enables research to be done on a particular phenomenon at a particular time, data collection is collected in a day, a period of days, weeks or months (Sekaran & Bougie, 2016). Therefore, in relation to this study, questionnaires were sent and collected over a period of two weeks.
Survey Instruments
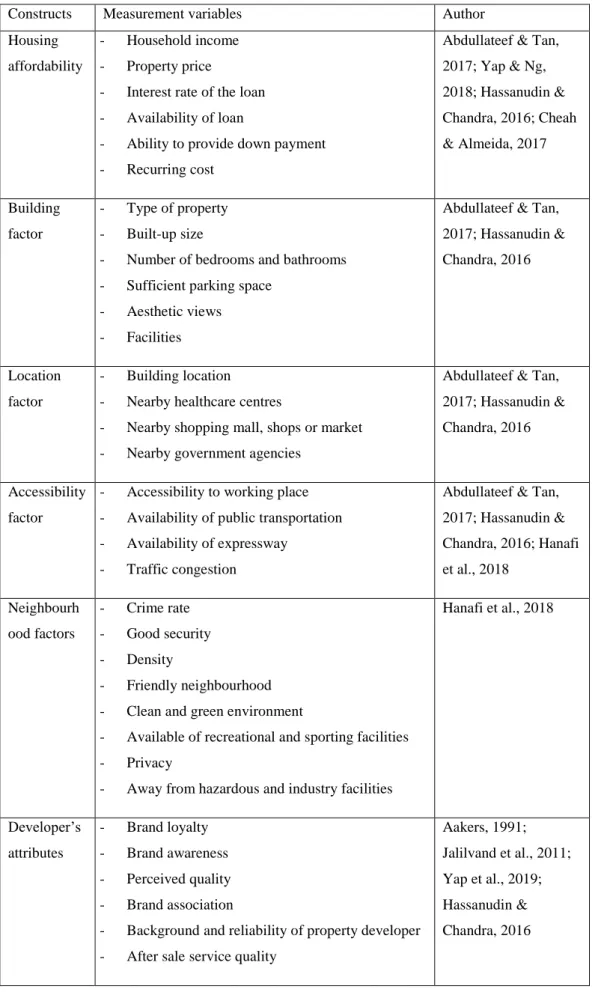
The questionnaire was a self-administered questionnaire using closed questions where each respondent had to answer a set of questions in a predetermined order including their relevant data. The language used in the questionnaire was English, as universally understood by the respondents. In section 3 of the questionnaire is also a rating question consisting of a similar five-point Likert-style rating scale that asked respondents to give their opinion on their intention to buy a house under the affordable housing scheme under of the following degree: - .
Descriptive Statistic
An interval data refers to numerical data that cannot be measured its relative differences, but the range (differences) between two data values can be specified. In contrast, the ratio data were able to calculate their relative difference between two data values.
Analysis Method
In the event that the Cronbach coefficient alpha was less than the threshold of 0.70, a further examination of the items is to identify which is the low correlated item that had to be removed from the set. The validity test relies on construct validity which shows the applicability of the results of the criterion fit in the theoretical framework (Sekaran & Bougie, 2016). In general, the techniques determine the statistical significance that shows significant correlations between different variables in the correlation matrix.

Results Presentation and Interpretation
Factor with p-value of less than 0.05, which means that the factor is statistically significant, therefore the alternative hypothesis will be accepted and the null hypothesis will be rejected.
Conclusion
FINDINGS AND DISCUSSION
Introduction
Respond Rate of the Survey and Outlier
According to Saunders et al. 2012), a boxplot function helps to identify which sample has values that differ from the other data over the allowable threshold and this occurrence is mainly due to data entry errors. In this study, there were 42 samples that were dropped due to the presence of outliers, so the total samples collected were usefully reduced to 304 samples. Nevertheless, the number of samples used of 304 samples was still above the minimum 200 samples as recommended by Hair et al. 2014) which can reduce the adverse effects of non-normality to negligible and minimum of 100 samples if a factor analysis is performed.
Respondent Demographical Profile
- Age
- Gender
- Ethnicity
- Marital status and number of members living in the house
- Highest Academic Level
- Distance to Work Place and Nearest Public Transportation
- House Type and Built Up Size
- Average Market Value of House
- Household Income and Rent or Own
- Summary of Distribution of Respondents’ Majority Profiles
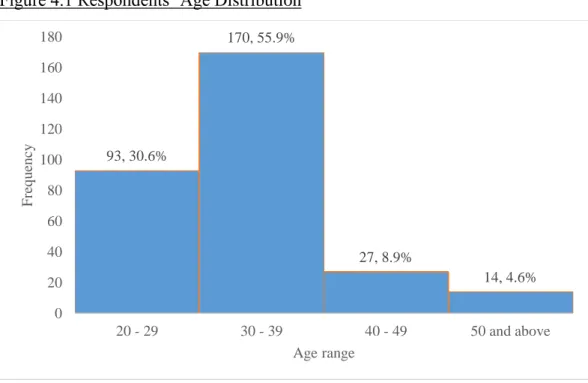
Figure 4.4 shows that 208 persons or 68.4% of respondents had a diploma/professional qualification as their highest academic level. The cross tabulation shows that 69 of the respondents use public transport to their workplace, regardless of whether they have a motor vehicle at home. It should be noted that the majority of respondents were Chinese, female, aged 30-39 and married.
Factor Analysis
- Descriptive Statistic
- Reliability Measure
- Validity and Correlation Test
- Factor Analysis
- Spearman’s Rank Correlation Coefficient
- One Sample T-Test
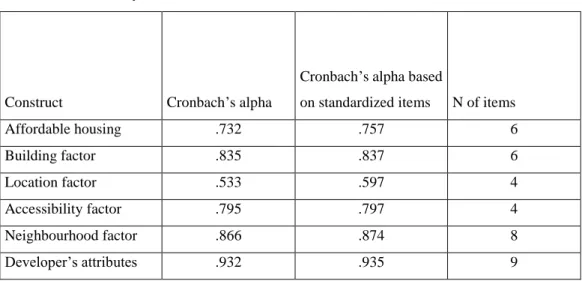
As shown in Table 4.9, after eliminating the irrelevant variable within the location factor construct, Cronbach's alpha returned to an acceptable value. As shown in Table 4.11, 7 components were created from 36 variables (excluding the nearby government agencies variable) that have eigenvalues greater than 1. Table 4.14 listed the results of a one-sample t-test conducted for each of the factors.
Intention to Purchase under Affordable Housing Scheme
The graph in Figure 4.7 shows that the majority of respondents' interest in buying a house under the affordable housing scheme ranged from neutral, agree and strongly agree, or 22.0%. A similar trend was seen in Figure 4.8 for those looking to buy a house under an affordable housing scheme, ranging from neutral, agree and strongly agree to 22.0%. However, as shown in Figure 4.9, the majority of respondents, 43.4%, were neutral about their desire to buy a house under the government's affordable housing scheme.
Interpretation and Discussion of Data
In other words, this showed that the vast majority of respondents agreed that variables are factors that influence their decision to purchase an affordable home. Based on the mean of the combined variables of 4.87, this factor was ranked among the most important factors influencing the decision of income group B40 and M40 to purchase an affordable housing in Malaysia. To summarize the data analysis, the study found that all the factors were statistically significant, therefore the alternative hypothesis will be accepted and the null hypothesis will be rejected.
CONCLUSION
Introduction
Summary and Discussion
Achieving of Objective 1
The first objective of this study is to identify factors that influence B40 and M40 income group purchase decisions towards an affordable house in Malaysia. Therefore, in examining the alternative hypotheses as discussed in Chapter 2.9, determine whether the alternative hypotheses should be accepted and null hypotheses rejected, or vice versa. In the context of this study, it is reported that all the factors have a p-value of less than .05 which means that the factor is statistically significant, therefore the alternative hypothesis will be.
Achieving of Objective 2
Delimitation
For this study, a convenience sampling technique was used to collect the data to reduce the time and cost of survey administration as well as appropriate when details of the population size are not available. It is a sampling technique that collects data from willing volunteers in the population and conveniently available to participate in the research. Regardless, the survey results obtained from convenience sampling may not be generalizable to the population of interest, but with a sufficiently large sample size, the results may represent the population (Sekaran & Bougie, 2016). However, given sufficient time and cost, future researcher of similar studies are recommended to use different sampling techniques to collect data from samples that allow to represent the Malaysian population throughout the country.
Future Studies
Prioritizing Key Attributes Influencing the Decision to Purchase a Residential Property in Malaysia: An Analytic Hierarchy Process (AHP) Approach. The Effect of Public Transport on Property Price Growth in Malaysia: A Correlation Study of the MRT Project.
