INTRODUCTION 1
Motivation and Problem Statement 1
Some portable devices do not organize their screen structure well before displaying the information to the user, and sometimes the text message and information are displayed in a complicated way. Therefore, this project will carry out to overcome the problem of display structure of portable.
Project Scope 4
To build an easily understandable and effective structure of information presentation using different forms such as symbol, color and graphic representation. This project should also display the health status of the user's body to allow the user to know his body's health status at a glance through the interface.
Organization of the report 6
6 This project will create relevant screens on wearable devices that allow a quick view of the most important and relevant information from the application interface. Therefore, a new way is needed that will change the interaction between the user and the wearable device, which allows the user to have a quick glance using an image or symbol.
LITERATURE REVIEW 7
Review of the Technologies 7
- Hardware Platform 7
- Operating System 8
- Programming Language 8
- Summary of the Technologies Review 9
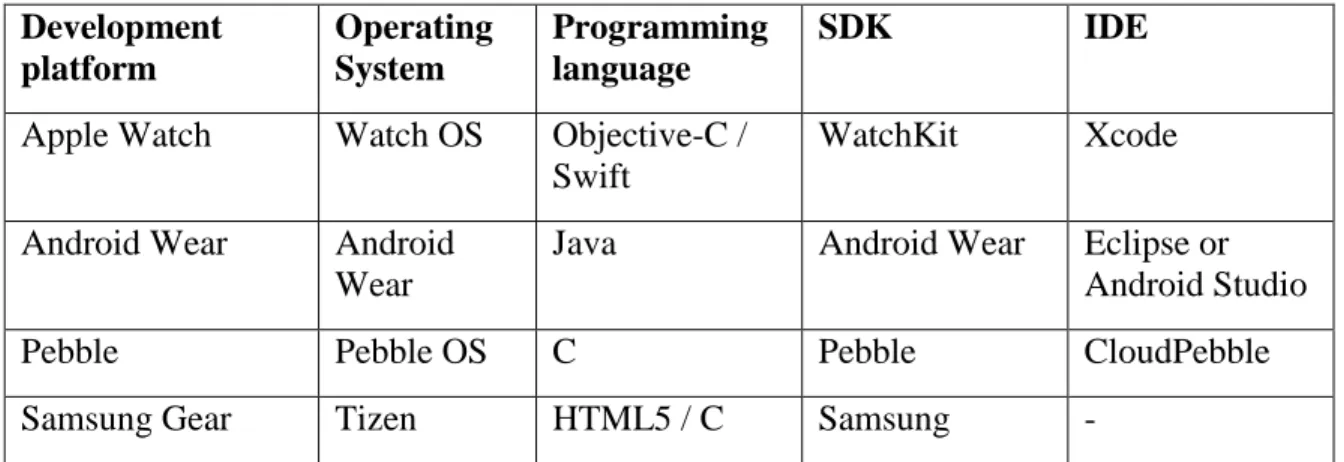
For example, the Apple Watch runs Watch OS, which is based on the iOS operating system and has many features similar to those in iOS. Apart from this, the software developer is also trying to create applications on those wearable devices to bring great advantages to mankind.
Review of Existing Applications 10
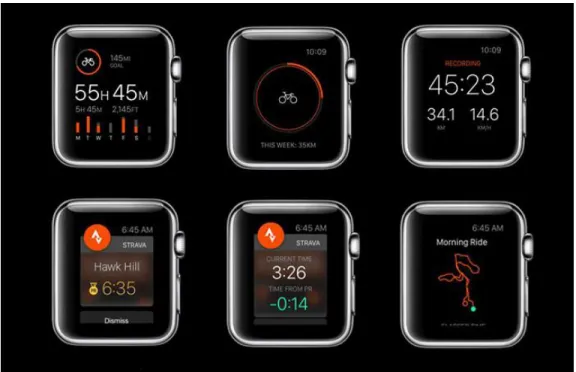
- Apple watch OS2 app (Strava) 10
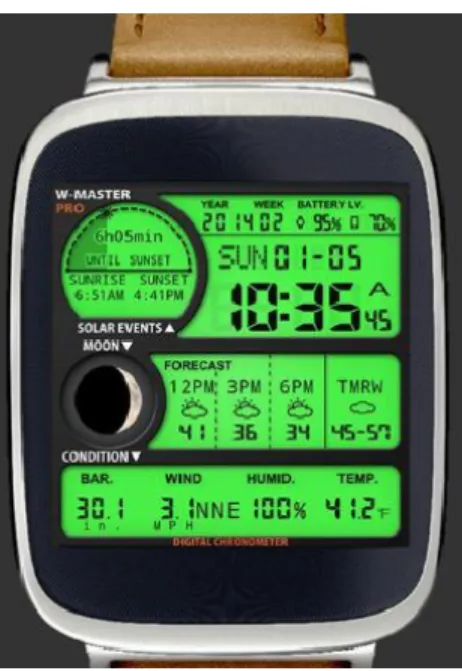
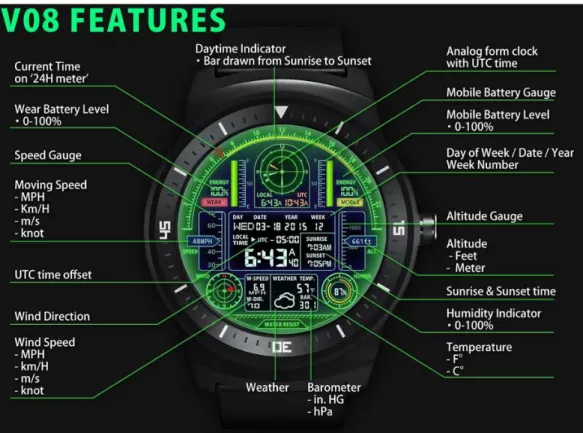
- LG Watch R app (V08 watch face) 12
- Asus ZenWatch app (F04 watch face) 13
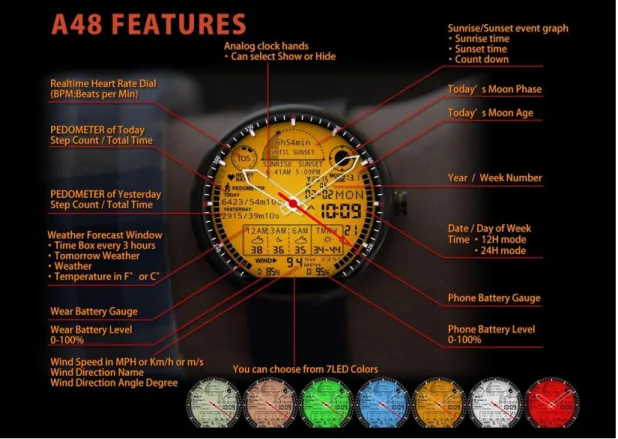
- Moto 360 app (A48 watch face) 15
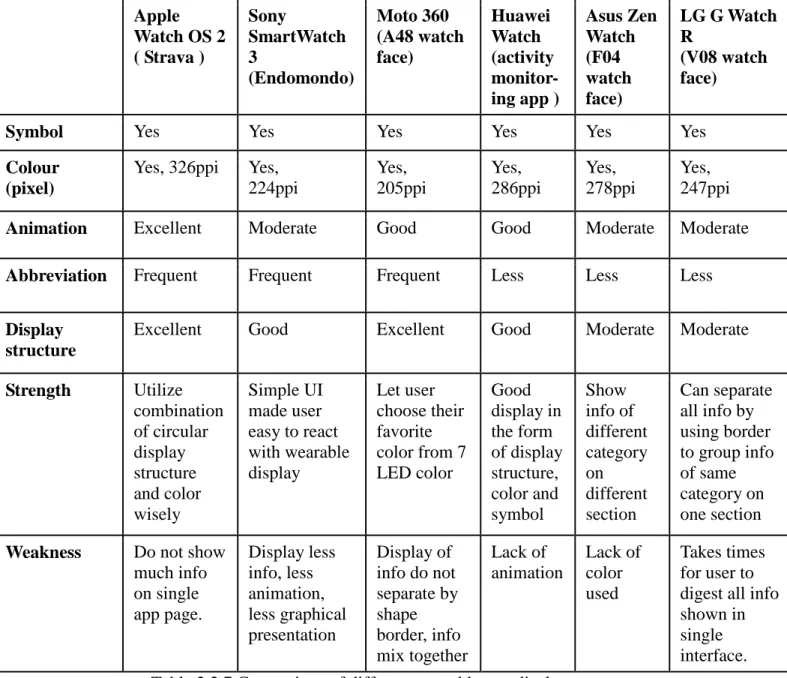
- Comparison of different wearable app display
One of its features is that it can display local time and UTC time at the top of the watch face using a circular display structure. 13 Strength: The display structure of the V08 watch face for time, weather, sunrise or sunset is all separated by a rectangular border shape so that the information is not confused with each other and the information on each section is grouped by category. F04 separates the display structure by using five sections where each section shows a different category of information.
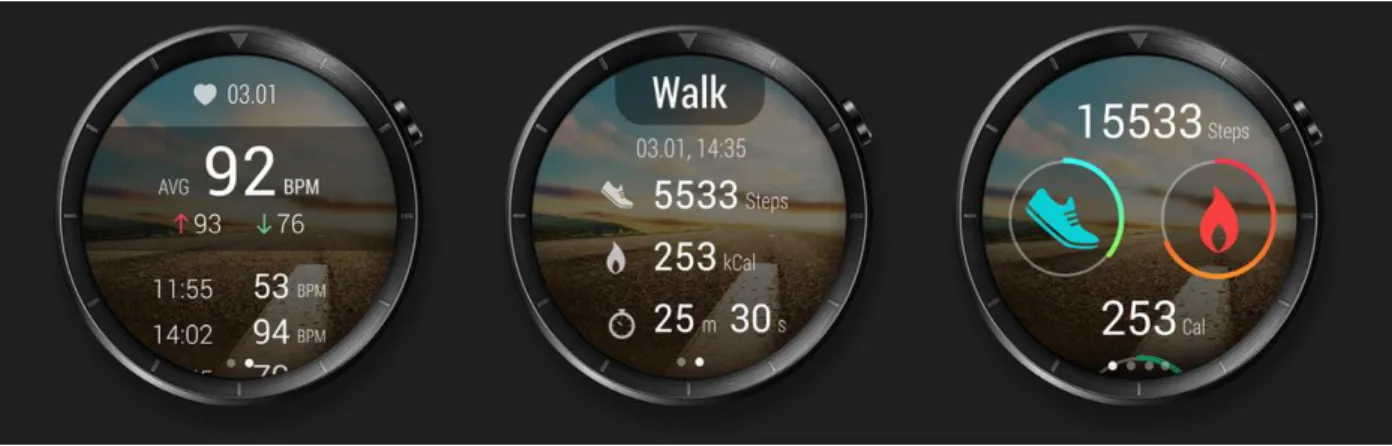
Strength: F04 watch shows almost all information related to weather of different categories on different sections. 16 sunrise and sunset event, it shows the time and countdown for sunrise and sunset in a semi-circular display structure. The display structure is good as Huawei Watch is used circularly with information shown in the circle.
17 Power: The Huawei Watch activity monitoring app uses a good way to provide information in the form of symbols, colors and the display structure. Only some of the existing apps appear in wearables with good information display. The result of the study revealed the following requirements of this project to overcome the problem of lack of proper display structure on the portable interface.
SYSTEM METHODOLOGY 20
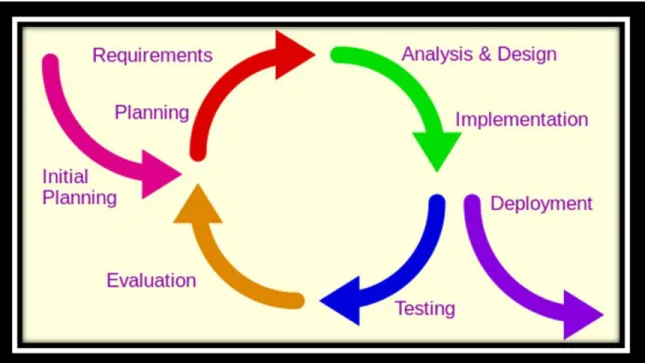
System Development Model 20
- Incremental Development 22
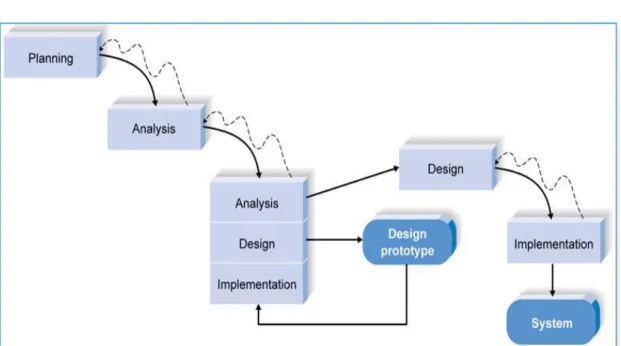
- Throw-away Prototyping 23
- Selecting a Software Development Process Model 24
System Requirement 24
- Hardware 25
- Software 26
This project requires hardware listed below and some software tools to develop the mobile application. The technologies and tools involved in this project are as below: .. ii) 2 Universal Serial Bus (USB) cables. iii) Hardware (disk capacity at least 128 GB and RAM size at least 4 GB). iv) Software (Korulab SDK recommended). This project development needs this software to compile codes and runs the application in an emulator of Android Studio.
Some additional software is also installed in Android Studio, which are SDK packages and system image for portable devices.
Functional Requirement 27
Expected System Testing and Performance 27
Expected Challenges 28
Project Milestone 29
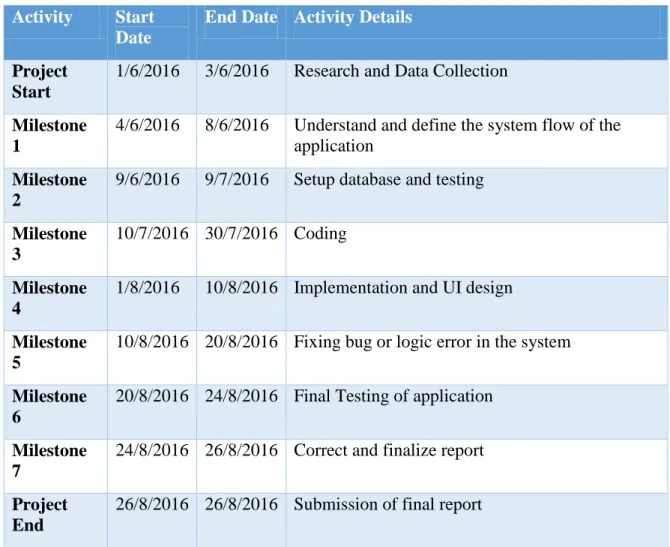
Since the date and time are limited, a timeline and milestone is created to ensure that this project can be completed before the due date. After a small milestone is completed, then the next target is set to ensure that project progress continues smoothly until the project is completed. Milestones allow us to manage a project more efficiently and determine if the project is on schedule and on track.
The critical path method is used to identify the highest priority in the project and the duration required to complete each subtask of the project. The purpose of using this critical path method is to ensure that the overall project is not delayed by achieving each subtask in the right sequence and on time. The first milestone is some research and data collection on wearables and some wearables' user interfaces (UI) and user experience (UX) review on each wearable.
In this step, Eclipse, which is an integrated development environment (IDE), is chosen as the tool that was used to implement the project. Then, the third milestone is familiarization with Java language and android wear emulator tools. 32 The next milestone is to repeatedly test the function to make sure there is no bug or error while the function is running.
Estimated Cost 34
Concluding Remark 34
35 Expected challenges included proper graphical presentation in a small interface of a portable device and proper display structure of applications. This project had reached the entire milestone and all tasks in the project are on track. The project development cost estimated in the last year is free because the software tools used are open source which is free and the hardware uses proprietary hardware such as a laptop to run an emulator.
To use the commercialization, the user must own an Android wearable device which is at least MYR 700.
System Architecture 36
History graph function, the user can view their profile details of different types of progress and their history data. The historical chart is shown to the user in an automated way without much input from the user. A progress bar status is being displayed to the user accordingly, which depends on the goal the user has assigned to it.
Some smart features in the progress bar will be displayed to the user if a particular user has reached their target goal. Sleep monitoring function, showing information about the total hours of sleep from yesterday and further dividing the total hours of sleep and categorizing them into deep sleep, light sleep and hours awake at midnight. Body mass index (BMI) function, quickly input the height and weight of the user and calculate their BMI value, showing their status and giving some tips to the user.
The user can view his latest health profile and track his historical health data on the main page. In addition, the user can also view the health advisory by clicking on the historical graph buttons on the main page. In the selection in the floating button menu, there are five available functions, namely step tracker function, sleep monitoring function, BMI function, calories burned function and exit function. In addition, all functions in the application will extract certain data from the local database and display this data to users in a graphical presentation.
Database Design 40
Use Case Diagram 41
GUI design 42
Some features would use a colored progress bar to show the user's progress towards goals. The color of the progress bar will change accordingly to show the user how much effort is left to reach their own goal. For example, for the step tracker feature, a red color inside the progress bar indicates that the user has many steps left to reach their goal, while a green color indicates that the user has a few more steps to go to reach their goal or that they have already reached your goal.
The system architecture is shown in Figure 4.1, and the applications will be installed on small wearable devices. A table is created in the SQLite database, which contains a six-column field representing the timestamp of the inserted health data (attribute field name: TIMESTAMP), the current status of the user, whether he has reached his goal or not (attribute field name: STATUS), the number of hours of sleep (attribute field name: SLEEP), the number of steps taken by the user (attribute field name: STEP), the current body mass index, the user's BMI value (attribute field name: BMI), the amount of calories burned by the user (attribute field name: CALORIES ). The table design and table details are shown in Table 4.4.1, including attribute name and attribute type.
The flowchart of the system is shown in Figure 4.3.1 to show how the flow of the . As in the GUI design shown above, Figure shows a symbol for the user to save user time reading the descriptive text next to it as the correct symbols are used to describe each of the functions in the application. In Figure 4.6.8, the bar chart design used a different color to represent all data on the x-axis instead of using the same color in the bar chart.
Hardware Setup 47
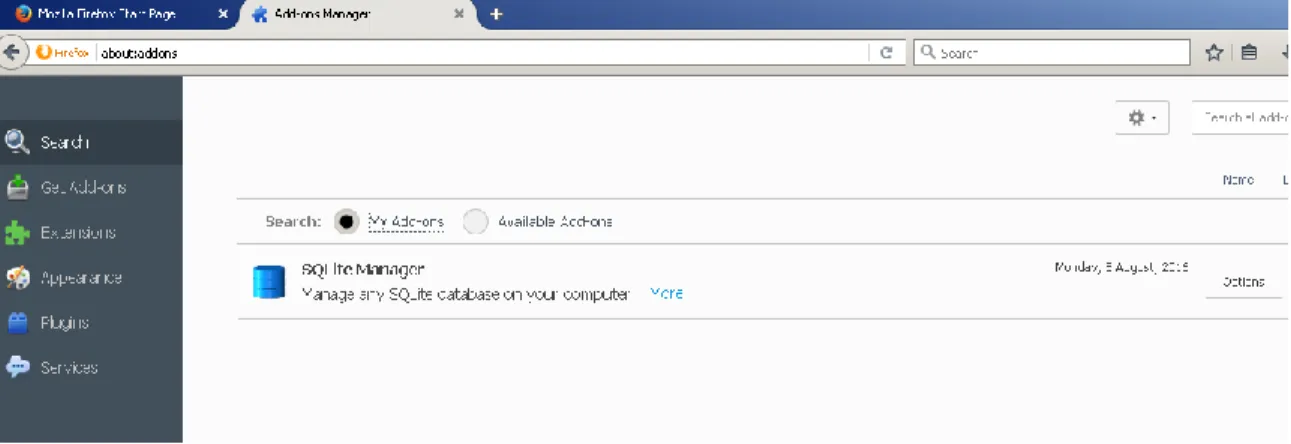
We also need a SQLite Manager Tools to monitor the database created locally in the portable device. In the sleep monitoring function, after the user clicks the "show" button, the application will access the database and retrieve the latest sleep hours of the user and show it in the progress bar as in Figure 5.4.10. Therefore, user can see all their health information at a glance on their wearable device without much input from the user.
First, the portable device is too small to place the keyboard layout so that the user can provide some input in the same way, just like our smartphone. Additionally, the user login feature will not be suitable for portable devices as the interface is too small to provide accurate input. Moreover, the user does not need much interaction with the wearable device while tracking their own history record, as some function in the application will display all information in an automatic way, which means that the user does not need much input into the wearable device to provide before he checks their health data.
Graphical presentation allows the user to quickly interpret all the information contained on the small interface of the portable device. In this chapter we talked about the system evaluation and the discussion of the project. The application is tested with few possible inputs, and the output is recorded as shown in table 6.1.1 and table 6.1.2. The challenge in this project is that the interface of a wearable device is too small to display a lot of health monitoring data, moreover, creating an efficient way to display information is also another challenge.
In short, the purpose of this project is to provide the user with a suitable and good screen structure to monitor his health in a wearable device. Additionally, the app can be improved if the app itself can collect accurate health monitoring data from the wearable device.