STUDY USER BEHAVIOUR THROUGH EVENT SHARING MODULE IN MOBILE UNICAT SYSTEM
BY
LYE GUANG XING
A REPORT SUBMITTED TO
Universiti Tunku Abdul Rahman in partial fulfilment of the requirements
for the degree of
BACHELOR OF COMPUTER SCIENCE (HONS) Faculty of Information and Communication Technology
(Perak Campus)
MAY 2015
DECLARATION OF ORIGINALITY
I declare that this report entitled “STUDY USER BEHAVIOUR THROUGH EVENT SHARING MODULE IN MOBILE UNICAT SYSTEM” is my own work except as cited in the references. The report has not been accepted for any degree and is not being submitted concurrently in candidature for any degree or other award.
Signature : _________________________
Name : _________________________
Date : _________________________
I would like to express my deepest gratitude to my supervisor, Dr Cheng Wai Khuen, for affording me this opportunity to venture into mobile application development, and my senior, Alex Shieh Yu Xuen, for persuading me into undertaking the UniCAT project. Without both of whom, I would not have gotten this far into mobile applications development, planting my roots along the process.
Not to forget my fellow mobile UniCAT teammate, Chan Mun Yee, for sticking with me through the highs and lows of this project. Without you, the project would not have been able to take off in such limited time. I would also like to give thanks to my many testers, with a shout out to Lim Li Yang, for giving valuable feedbacks and suggestions during the span of this project.
Also, to Kee Soon Ching, for your generosity and trusts in allowing me access to the Apple developer account. Finally, I must convey my thanks to both of my parents and my family for their love and support.
ACKNOWLEDGEMENTS
University Cyber AgenT (UniCAT) is a graphical social networking system that is created for the purpose of studying the behaviour of the local population. Agents that represent users think and behave like its users through the user preferences collected and stored in the system.
This project seeks to further the cause by re-engineering and adding native mobile support to one of its various modules, the event sharing module. The UniCAT event sharing module for the mobile platform allows users to create, share and discover events and happenings around them while on the go.
Authorised users are able to create, update and report events. This enables the system to have an updated event list and details.
After studying the existing system, it has been noted by the author that the collection of user preferences can be improved upon. Besides questionnaire, there are other ways of collecting user preferences, whilst preserving user experience. Systems that are similar in nature are studied and compared. An interest system is implemented to record user interests. As such, all events are tagged with related interests and as users interact with the mobile application, their interests change, reflecting their current interests. Prototypes are made based on the solution and improved upon during different development phases.
In a nutshell, this project will enable the local population and visitors to get updated event details directly on their mobile devices whereas the UniCAT system can benefit from the increased collection of user data and event data.
ABSTRACT
TITLE
DECLARATION OF ORIGINALITY ACKNOWLEDGEMENTS
ABSTRACT
TABLE OF CONTENTS LIST OF TABLES LIST OF FIGURES
LIST OF ABBREVIATIONS
CHAPTER 1 INTRODUCTION
1.1 Motivation and Problem Statement 1.2 Project Scope
1.3 Project Objectives 1.4 Proposed Approach 1.5 Background Information 1.6 Report Organisation
CHAPTER 2 LITERATURE REVIEW 2.1 Review Description
2.2 Review of Existing System 2.2.1 Eventbrite
2.2.2 All Events in City 2.2.3 StumbleUpon 2.2.4 Vamos
2.2.5 Hangtime 2.3 Critical Remarks
2.3.1 System Comparison 2.3.2 Criteria Explanation 2.3.3 Comparison Analysis
i ii iii iv v viii ix xi
1 1 2 2 2 3 4
5 5 5 5 6 7 8 10 11 11 11 12 TABLE OF CONTENTS
CHAPTER 3 SYSTEM DESIGN 3.1 Requirement Specifications 3.2 Design Specifications
3.2.1 Use-case Diagram 3.2.2 System Flow 3.2.3 Sequence Diagram 3.2.4 Database Design 3.3 User Interface Design
3.3.1 Map Module 3.3.3 Event Module 3.3.3 Interest System 3.4 Parse Core Setup
CHAPTER 4 METHODOLOGY AND TOOLS 4.1 Project Methodology
4.1.1 General Work Procedures 4.1.2 Work Procedures Elaboration 4.2 Tools Used
4.3.1 Software 4.3.1 Hardware 4.3 Timeline
4.3.1 Gantt Chart
13 13 14 14 15 17 18 19 19 20 23 24
26 26 27 28 29 29 30 30 30
CHAPTER 5 IMPLEMENTATION AND TESTING 5.1 Implementation
5.1.1 Event Module 5.1.2 Interest System 5.1.3 Report Generation 5.1.1 Others
5.2 Black Box Testing 5.2.1 Event Module 5.2.2 Event Editor
CHAPTER 6 CONCLUSION 6.1 Project Review
6.2 Impact, significance and contribution 6.3 Future Work
BIBLIOGRAPHY
APPENDIX THE NEW MULTI-SCREEN WORLD:
UNDERSTANDING CROSS-PLATFORM CONSUMER BEHAVIOR
TESTER SIGN UP PAGE PROMOTIONAL POSTER SAMPLE REPORTS
31 31 31 34 35 36 38 38 39
40 40 41 41
42 A-1
A-2 A-3 A-4
Table Number
Table 2.3.1 Table 2.3.2 Table 5.2.1 Table 5.2.2
Title
System Comparison table Criteria Explanation table Event Module Test Case Event Editor Test Case
Page
11 11 38 39 LIST OF TABLES
Figure Number
Figure 2.1 Figure 2.2 Figure 2.3 Figure 2.4 Figure 2.5 Figure 2.6 Figure 3.1
Figure 3.2
Figure 3.3
Figure 3.4
Figure 3.5 Figure 3.6 Figure 3.7 Figure 3.8 Figure 3.9 Figure 3.10 Figure 3.11 Figure 3.12
Title
Screenshots of Eventbrite
Screenshots of All Events in City Content view of StumbleUpon StumbleDNA of StumbleUpon Screenshots of Vamos
Screenshots of Hangtime
Use case diagram of the Event Sharing module of UniCAT
System flowchart of the Event Sharing module of UniCAT (Part 1)
System flowchart of the Event Sharing module of UniCAT (Part 2)
Sequence Diagram of Client-Server Data Synchronisation of UniCAT
Entity-Relationship Diagram for Event Sharing Map Module and Side Menu UI
Event Module UI Event Editor UI
Picker View and Date Pickers
Interest View and Choose Interest View System Architecture Diagram
Screenshot of Parse Core Import Data Window
Page
5 6 7 8 9 10 14
15
16
17
18 19 20 22 23 23 24 25 LIST OF FIGURES
Figure Number
Figure 4.1
Figure 4.2
Figure 4.3 Figure 5.1 Figure 5.2 Figure 5.3
Figure 5.4 Figure 5.5 Figure 5.6 Figure 5.7
Title
Flow chart of the Evolutionary Prototyping methodology
Work flow Diagram of the Evolutionary Prototyping methodology
Gantt Chart
Comparison of the Vibrancy Effect Screenshots of Event List View
Screenshots of Event Detail View and Attendance Bar States
Screenshots of Interest and Choose Interest View Screenshot of the Sample Reports web page Screenshots of the Map Module
Screenshots of the Side Menu
Page
26
27
30 31 32 33
34 35 36 37
API HIG HTML IDE OS MBaaS PC POI RDBMS RSVP SCM SDK UI UniCAT
Application Programming Interface Human Interface Guidelines
Hypertext Markup Language
Integrated Development Environment Operating System
Mobile Backend as a service Personal Computer
Point of Interest
Relational Database Management System
“Répondez s'il vous plaît” meaning “please reply”
Source Code Management Software Development Kit User Interface
University Cyber Agent
LIST OF ABBREVIATIONS
Chapter 1 : Introduction
1.1 Motivation and Problem Statement
In regards to the existing UniCAT system, it does not have a mobile client that allows users to create, share and discover information. Mobile devices like smartphones provide the benefits of portability and access to cellular data to users that a normal computer doesn’t. These benefits will allow users to stay connected at anytime, anywhere. According to a research, smartphones are the most common starting place for online activities such as searching for information whereas normal PC are often used for more complex activities such as planning a trip (Google 2012).
This shows that users prefer to share and discover information on a mobile platform over a computer.
Also, there are currently no existing mobile applications that show all the local events and happenings. The existing systems either do not fully support Malaysia or obtain their contents from popular social networks and ticketing services, all of which only represent a small portion of the events happening around here. There is not a single location for users to find out about all the local events and happenings. This has caused many of them to miss out on events that they may be interested in.
Chapter 1 : Introduction 1.2 Project Scope
The scope of the project is the development of a mobile application module that studies user interest and allows the user to create, share and discover events in a mobile application.
1.3 Project Objectives
The objectives of the project is:-
-
to develop an information sharing module using mobile solution in order to allow user to create, share and discover local events.-
to adopt simple behaviour learning mechanisms in order to deliver better content to the user.1.4 Proposed Approach
The proposed approach to tackle the problems stated is to build a mobile UniCAT client with the event module. The UniCAT event sharing module for the mobile platform allows users to create, share and discover events and happenings around them while on the go. Authorised users are able to create, update and report events.
Event planners such as the clubs and societies of the university can easily post and promote their events through the module. This allows the system to have an updated and accurate event list and details. The module make use of an interest system to record user interests. All events are tagged with related interests and as users interact with the mobile application, the recorded interests will change, reflecting their current interests. User actions are also recorded using a user tracking system to enable the UniCAT system to find out about user preferences and behaviours.
Chapter 1 : Introduction 1.5 Background Information
University Cyber AgenT (UniCAT) is a graphical social networking system. It’s created for the purpose of studying the behaviour of population in Kampar (Shieh 2014, p4). In the system, user will be able to see avatars that represent users move and social around on a visualised map. These avatars, called agents, can think and behave like their users, so the users do not need to manually move them. The visualised map also contains POI like shopping centres, restaurants and school buildings that the agents can go to.
Social networking features such as file sharing, message system and friend management are integrated into UniCAT. Users can manage their profiles, connect with their friends and share information with each other within UniCAT. Information sharing is a big part of UniCAT as users can share and discover information about events, foods, studies and so on, directly in the system.
There is a variety of events happening in Kampar every week, whether they be major university events, society-organised themed events, promotional events or community festivals, these events can gather like-minded people and encourage face to face communication which make it possible to lead to great friendships and partnerships.
In other words, life in Kampar can be colourful and exciting.
Chapter 1 : Introduction 1.6 Report Organisation
This report consists of 6 chapters in total. The first chapter introduces the project, the motivations for working on the project and also the project objectives. In the second chapter, five similar systems currently in the market is reviewed and compared with the proposed solution. Their functionalities and UI designs are examined.
Chapter 3 explains the system design in detail. Instructions to set up the system and database are in this chapter. Chapter 4 describes the methodology and tools used in the project in addition to the timeline of the project. Chapter 5 details the implementation and testings done on the project.
The final chapter concludes the project and explains on possible future improvements on the finished system.
Chapter 2 : Literature Review
2.1 Review Description
The following analysis gathered existing systems that serve similar purposes or functionalities to this project and reviewed them based on their strength and weaknesses.
2.2 Review of Existing System 2.2.1 Eventbrite
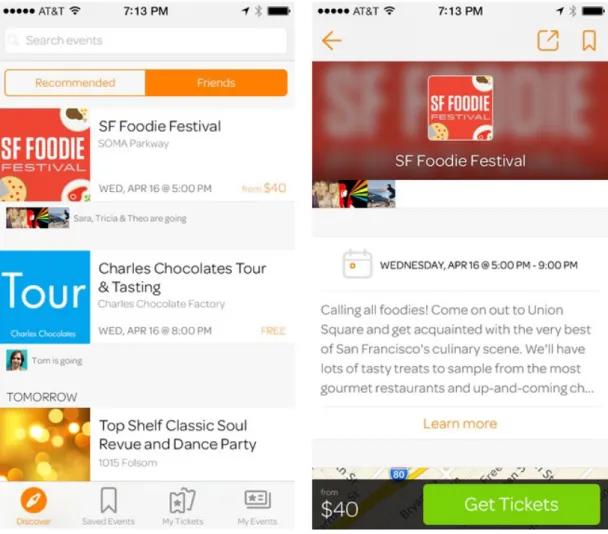
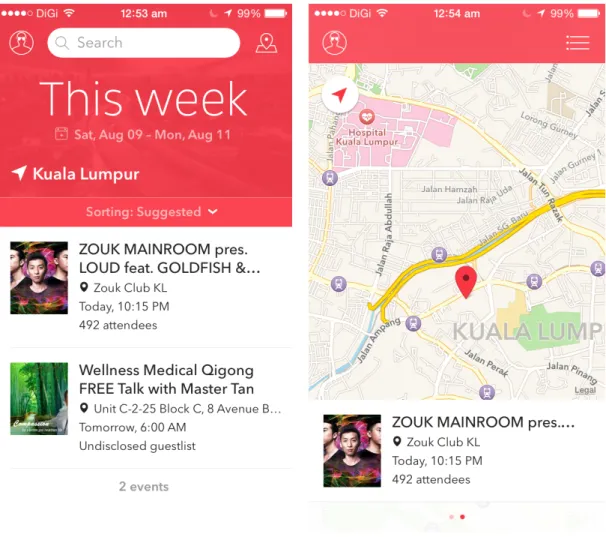
Figure 2.1: Screenshots of Eventbrite
Eventbrite is a free online ticketing service that lets event organisers create events and sell the event tickets easily (Eventbrite 2014). It has a mobile app that works for both iOS and Android platforms.
Chapter 2 : Literature Review
The Eventbrite mobile app allows users to create, promote and sell tickets to events such as concerts, festivals, classes, conferences, parties and more. Users can use the app to check the various statistics and information of their events, which include ticket sales, event attendance and attendees details.
In addition to organising events through the app, it also helps people to discover and share events that they fancy via various social networks. It gives recommendations of events to users. User can see what their friends are attending as shown in and also the events that are happening nearby. Users can easily access the details of any event and reserve the tickets to the event. There is no need for any physical ticket as the purchased ticket can be directly accessed through the app and used for event entry.
2.2.2 All Events in City
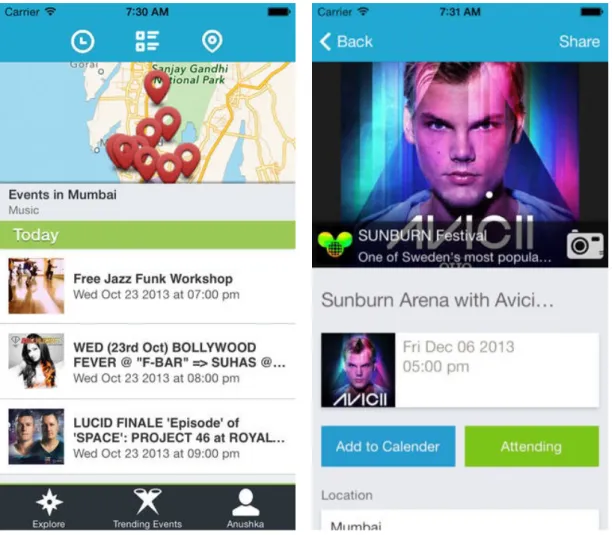
Figure 2.2: Screenshots of All Events in City
Chapter 2 : Literature Review
The All Events in City app is the official companion app for the similarly named event portal that is free to use by everyone (Amitech Business Solutions 2014).
The app lets the users easily filter the types of events, the date and time, and also the location of the events with only the three buttons at the top of the app, as shown in Figure 2.2. Users can further filter the events shown by using keywords. However, it only supports ticketing for selected events. The app integrates with the map apps that are installed on the mobile system and shows the events on the map and also enables guided navigation to the venue.
Users can easily add events to their calendar with the Add to Calendar button, as shown in Figure 2.2. Events can be shared to Facebook, Twitter or via Email with the Share button on the right. Notifications can also be scheduled for upcoming events.
2.2.3 StumbleUpon
StumbleUpon is a free content discovery app that lets users discover and explore the contents that they’re interested in (StumbleUpon Inc 2014). It first asks the user to choose at least five interests from a list of popular interests. Then, the app will generate a mix of photos, videos, articles and more that matches the chosen interests.
These contents are taken from around the web.
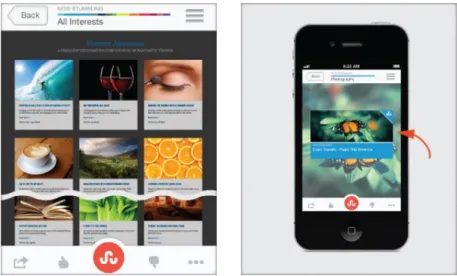
Figure 2.3: Content view of StumbleUpon
Chapter 2 : Literature Review
The contents are presented one at a time and the user can navigate by simply swiping left and right. It has a slide preview feature that shows a small preview of the content before loading the actual content, as shown in Figure 2.3. User can then rate the contents presented to further enhance the recommendations. The rating system has two options, a thumbs-up and a thumbs-down symbol, similar to the rating options used by the video-sharing site, Youtube.
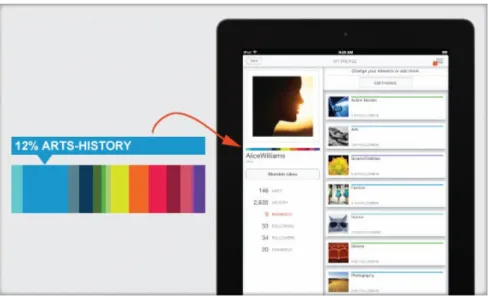
Figure 2.4: StumbleDNA of StumbleUpon
User can further add, refine or update the chosen interests in the settings. This time, the interests are categorised into a couple major categories, such as Computers, Arts/
History, Hobbies, Sports, and Religion. According to the description, the total number of interests available to choose from are up to five hundreds. There’s a rather unique feature called StumbleDNA in StumbleUpon, it’s a representation of the user’s current taste. It’s visualised as a rainbow stripe with each colour representing an interest, as shown in Figure 2.4. The stripe changes as the user rate the contents and refine the interests. User can compare the stripe with other users to discover shared interests.
2.2.4 Vamos
Vamos is a minimalistic event discovery app that sourced its events listings from Eventbrite, Ticketmaster and public events from Facebook (Vamos & Friends UG 2014). It uses the users’ location data to determine the most relevant event to the
Chapter 2 : Literature Review
users. It also has Instagram integration that streams photos related to the event chosen.
Users can follow their friends to know their plans and favourite venues. Also, users can directly obtain the guest lists and tickets to selected events through Vamos.
Figure 2.5: Screenshots of Vamos
As shown in Figure 2.5, Vamos has a map view that shows events pinpointed on their respective locations, along with the details of the selected event.
The app has a limited settings panel that lets user show or hide their RSVPs to events on Facebook and toggle the notifications sent to friends using Vamos. Besides that, it contains a short list of interests that show or hide events according to the users’
choices. The list of interests are Arts and Culture, Family, Nightlife, Music, Networking, Food and Drink, Fashion, and Sport.
Chapter 2 : Literature Review
2.2.5 Hangtime
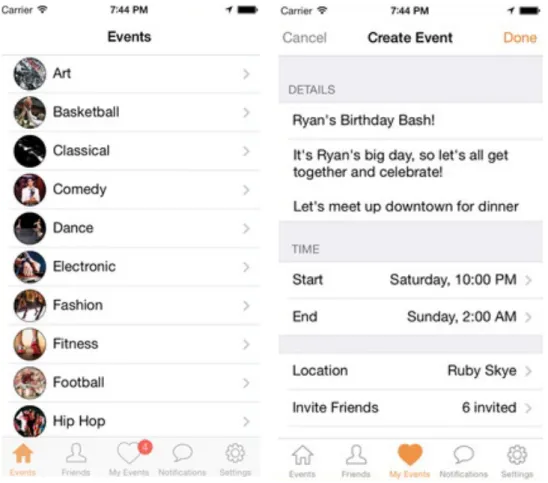
Hangtime is a free event sharing app that is heavily integrated with Facebook (Hangtime 2014). The app immediately ask for access to user’s Facebook account on launch. Although the user can choose to opt out of the Facebook integration, the app will prompt for Facebook access from time to time and also limit the features of the app that required Facebook access. One of those features is Facebook event support.
Figure 2.6: Screenshots of Hangtime
Hangtime lets user see upcoming local events such as parties, concerts, festivals and sporting events that the user’s friends are interested in. User can see friends’ social plans in calendar form. The app will immediately notify the user through push notifications when there is any new event the user’s friends are going. In the event that no friends are going to any event, the app also lets the user discover events near the user. The events are categorised into several ‘Interests’, some of them are Art, Classical, Dance and Fashion. User can then share the events through Facebook.
Chapter 2 : Literature Review
Besides that, user can create new events and invite friends to the events. They will receive push notifications of the event hosted by the user. Other users can share their photos to the events, be it promotional images or event photos.
2.3 Critical Remarks 2.3.1 System Comparison
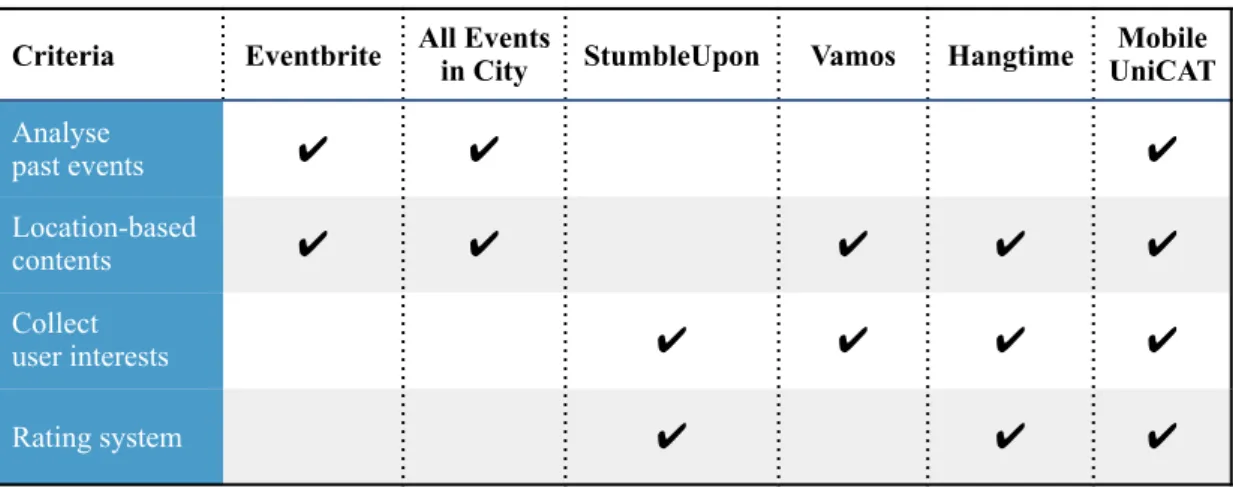
Table 2.3.1: System Comparison table
2.3.2 Criteria Explanation
Table 2.3.2: Criteria Explanation table
Criteria Eventbrite All Events
in City StumbleUpon Vamos Hangtime Mobile UniCAT Analyse
past events ✔ ✔ ✔
Location-based
contents ✔ ✔ ✔ ✔ ✔
Collect
user interests ✔ ✔ ✔ ✔
Rating system ✔ ✔ ✔
Criteria Elaboration
Analyse past events The application display events based on events shared or attended by user in the past.
Location-based contents The application uses location data of user device to display contents that are happening around the user or any user-chosen location.
Collect user interests The application collects the user interests that are chosen by user.
Rating system The application uses a rating system that lets user give ratings to the content displayed.
Chapter 2 : Literature Review 2.3.3 Comparison Analysis
Eventbrite recommends events to its users based on the events they attended in the past and through their social connections with other users. According to statistics, only half of its users clicked into the recommended events (Ryan 2012). This shows that not all past events attended are favoured by the users as only half of them are intrigued by the recommendations. It does not have a rating system to refine the recommendations nor does it asks the users for their interests. The same goes for All Events in City, it displays events to its users based on locations of users, events attended by users in the past and their social connections.
StumbleUpon on the other hand, uses a different approach to recommend contents. It explicitly asked for the users’ interests and implemented a rating system to further refine the recommendations. The rating system lets the users rate the recommended contents to determine the level of interests of users to each interest. The interests level of users are then compared with their friends’ to give more relevant recommendations. It does not, however, support recommendations based on user location or any other location-based features.
Vamos supports recommendations based on users location or any location of their choice. It also allows users to choose their interests, nevertheless, the choices are a bit limited and not diverse enough, having only a total of eight interests to choose from.
Hangtime collects interests of users by providing a variety of interests for the users to choose from, in addition to supporting recommendations based on user location, a friends system and a basic rating system. Although it has a rating system in place, its function is limited to only using the ratings to perform basic filtering such as showing other similar events and hiding unwanted events.
Chapter 3: System Design
3.1 Requirement Specifications 3.1.1 Functional Requirement
1. User should be able to register and log in to the system.
2. User should be able to create events and add event details, the event details may include event name, event description, event images, date, time and venue.
3. User should be able to add event details to existing events.
4. User should be able to view the list of events happening in a particular location by clicking the location marker on the map.
5. User should be able to view events near his/her current location.
6. User should be able to flag an event detail that is fake or contain inaccuracy for review by administrator.
7. Administrator should be able to review flagged event details.
8. Administrator should be able to unflag or remove flagged event details.
9. User should be able to update his/her personal information.
10. User should be able to select and update his/her interests from a list of interests.
3.1.2 Non-functional Requirement
1. User data changes should synchronise with the server in real time.
2. All event data should be stored in the database and not hardcoded in the application source code.
3. All event images should be stored on the server and retrieved on demand
Chapter 3: System Design
3.2 Design Specifications 3.2.1 Use-case Diagram
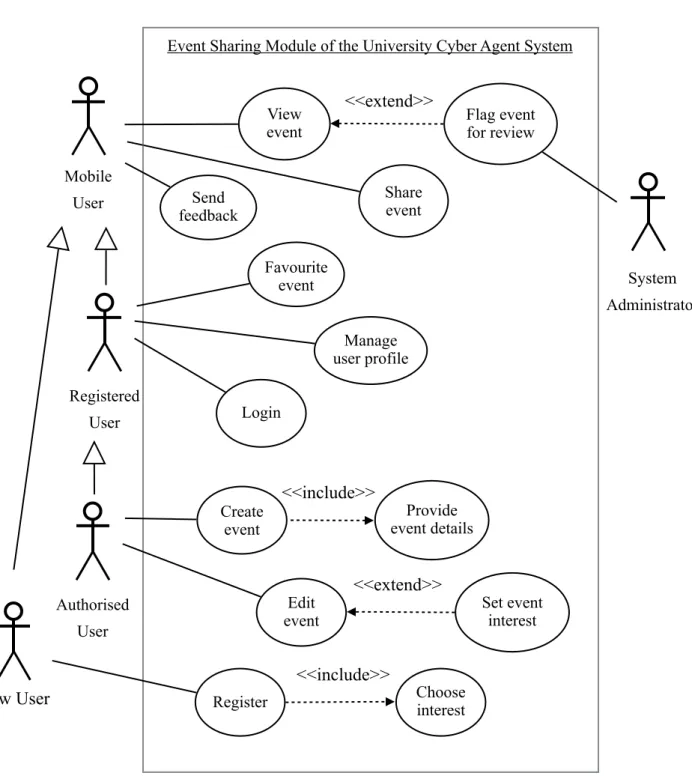
Figure 3.1: Use case diagram of the Event Sharing module of UniCAT Share
event
Event Sharing Module of the University Cyber Agent System
Create event
Provide event details
<<include>>
Register Choose
interest
<<include>>
System Administrator Mobile
User
Registered User
New User
View
event Flag event
for review
<<extend>>
Favourite event
Authorised User
Manage user profile Login
Edit
event Set event
interest
<<extend>>
Send feedback
Chapter 3: System Design 3.2.2 System Flow
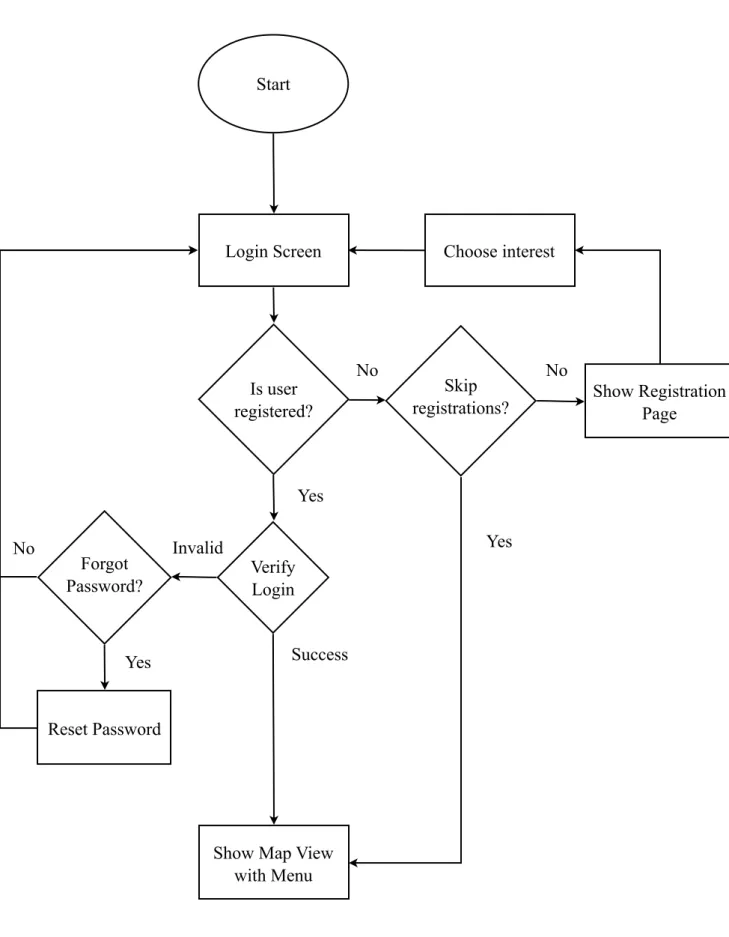
Figure 3.2: System flowchart of the Event Sharing module of UniCAT (Part 1) Start
Login Screen
Is user
registered? Show Registration
Page
Verify Login Invalid
Show Map View with Menu
Skip registrations?
No No
Yes
Yes
Success
Choose interest
Forgot Password?
No
Reset Password Yes
Chapter 3: System Design
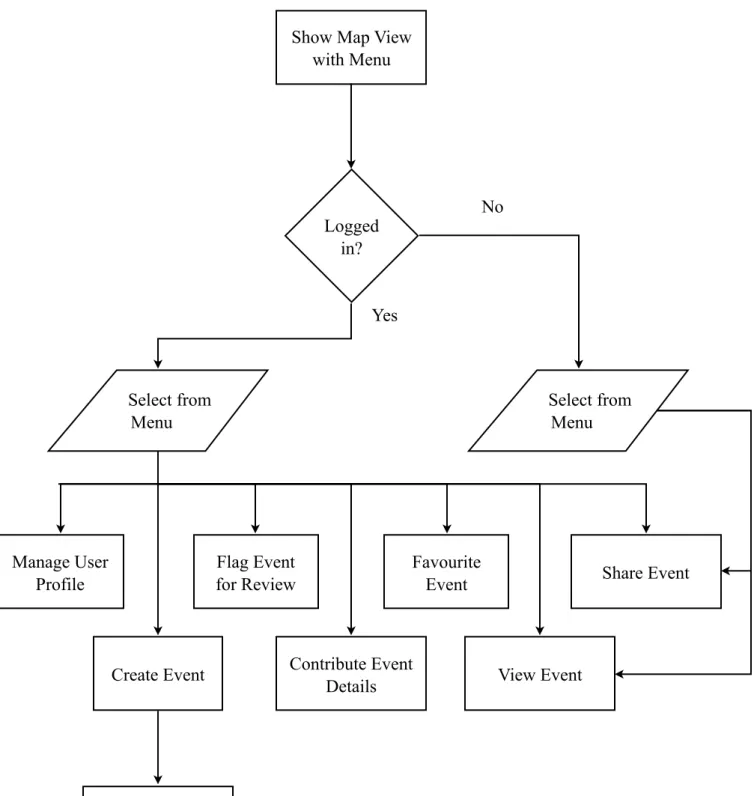
Figure 3.3: System flowchart of the Event Sharing module of UniCAT (Part 2) Show Map View
with Menu
View Event
Share Event
Create Event
Flag Event for Review Manage User
Profile
Add Event Details
Contribute Event Details Logged
in?
Select from Menu Yes
Select from Menu
No
Favourite Event
Chapter 3: System Design 3.2.3 Sequence Diagram
Server-Client Data Synchronisation
Figure 3.4: Sequence Diagram of Client-Server Data Synchronisation of UniCAT
User UniCAT client API
Login
Authorise user
Request event data Transfer event data
Request event info
Display event info
Request event info
Display event info
Local Storage (Mobile)
Check authentication Authentication result
Request user data Transfer user data
Store data into mobile
Retrieve data Return data
Update data
Retrieve data Return data
Update data
Chapter 3: System Design 3.2.4 Database Design
Figure 3.5: Entity-Relationship Diagram for Event Sharing
Note that Figure 3.5 only includes database schema for the event sharing module and interest system, there are other tables related to UniCAT which have been omitted in the diagram above. Figure 3.4 depicts the server-client data synchronisation model
Chapter 3: System Design
3.3 User Interface Design
All UI designs adheres to the iOS HIG which is a requirement for iOS apps to be accepted in the App Store as stated in the App Store Review Guidelines (Apple, 2015)
3.3.1 Map Module
Figure 3.6: Map Module and Side Menu UI
Due to limited screen estate available on mobile devices, the map will span across the full display, as illustrated in Figure 3.6 (a), to ease the navigation of the map. A navigation bar that allows access to the side menu is placed on top of the map, at the top of the display. Map annotations that label the venues are placed onto the map and the number of event that is happening at the venue is shown inside each annotation, alongside the name of the venue. User is able to pan and zoom into the map, and as the user interact with the map, the annotations show and hide to avoid overlapping and confusing the user. When the user tapped any of the annotation, they are sent to the Building Detail View, which is shown in Figure 3.6 (b).
In the Building Detail View, the parallax effect for the building photo at the top allows user to have a better look at the building, in order to get a better sense on how the
(a) Map View (b) Building Detail View (c) Side Menu
Chapter 3: System Design
venue look like, if they so choose. The view contains short description of the venue and user has easy access to future events, events currently happening there and also all the past events that have happened at the location. Numbers of events that will be held there or are currently on-going will be displayed beside the button, as shown in Figure 3.6 (b). User can return to the map either through the “Show on Map” option, or with the back button at top left.
The side menu can be accessed by tapping the button on the top left of the root views, it is a symbol that contains three horizontal lines, as shown in Figure 3.6 (a) and Figure 3.7 (a). The side menu contains 5 main rows, which are user information, map, event, feedback and login, respectively. User profile, user interests and other settings can be updated by tapping the “Gear” icon, located at the first row of the menu. The
“Event” option will be explained in detail later. The “Map” option will navigate the user to the Map View (Figure 3.6 (a)) whereas “Feedback” will open a new email for the user to submit feedbacks regarding the application. The “Login” option will rotate between “Login” and “Log out” depending on the status of the user.
3.3.2 Event Module
(a) Event List View (b) Event Detail View (c) Action Sheet
Chapter 3: System Design
In the Event List View, important information such as event title, start time and date, along with its location are displayed, as shown in Figure 3.7. Events are sorted according to time, with events currently happening at the top. To update the event list, users may use the pull to refresh gesture, invented and popularised by the Twitter app made by Loren Brichter (Patel, 2013), to fetch the latest event list. This gesture is widely used by popular mobile applications such as Facebook and Twitter, and is utilised by Apple in stock applications such as the Mail app.
There are a total of four options for the Event section in the side menu as illustrated in Figure 3.6 (c), which are: Favourite, All Event, Past Event and Add Event. The first three options will navigate the user to the Event List View (Figure 3.7 (a)) and filter the event accordingly. The “Add Event” option will call the Event Editor View (Figure 3.8), which will be explained later. “Favourite” will only be available when the user is registered and logged in and the “Add Event” option is only available for user that is authorised to create and update event. “Favourite” will display events favourited by the user.
The Event Detail View contains an attendance bar which doubles as the favourite system as well. There are three options available: Going, Maybe and Not Interested.
When user selects “Going” or “Maybe”, this means that they’re interested in the event. For authorised users, the attendance bar will show the number of users that have clicked the 3 options. Many of the society organised events have their own Facebook page, therefore, there’s a Facebook bar that promotes the event’s Facebook page, that when tapped, user will be redirected to the event’s Facebook page. Aside from that, there’s an option to contact the event organiser for more information. User can call the organiser by tapping the phone row, the nickname of the organiser are displayed for the user’s information. The bottom toolbar contains two options. Users can get the interests of the event by tapping the “Heart” button on the left whereas the action button on the right allows the user, depending on whether they’re registered or not, to share and report events, as shown in Figure 3.7 (c). If the user is authorised to create and update events, the “Edit Event” will be shown here. The sub-events for events with sub-events are also accessible here.
Chapter 3: System Design
When creating or updating an event, the Event Editor View will be displayed, as illustrated in Figure 3.8. The user is given the option to include a cover photo to be displayed at the top of the event detail view and in the event list view, as shown in Figure 3.8 (A). The cover photo is optional however, and is designed to show a brief glimpse to the nature of the event at first glance. The basic details of the event: event name, description, venue, dates and time, contact details and event Facebook page, are to be filled into the event creation form. The “Next” key on the bottom right of the keyboard allows users to easily switch to the next field. Subtitle of the event (B) refers to the theme of the event, it can also be used for other purposes such as short description of the event or alternate name of the event. For event venue (C), user only need to key in the room number, for example, A001, and the system will know it’s in the Heritage Hall. If it’s a campus-wide event, user only has to put
“UTAR” as the venue. If the event is a sub-event to a major event campaign, user can set it as so through the “Sub event to” option (D). A list of existing events will be shown to the user, as illustrated in Figure 3.9.
A
B
C
D
Figure 3.8: Event Editor UI
Chapter 3: System Design
3.1.2 Interest System
Figure 3.10: Interest View and Choose Interest View
There are two view for displaying interests in the application, namely the Interest View and the Choose Interest View. The Interest View is used to show the interests of the user or the selected event. The Choose Interest View on the other hand allows the user to add or update the user or event interest. The interests are arranged in a grid view as shown in Figure 3.10. The interests are represented by icons to ease the understandings of each interest. This enable the user to skim through all available interests and select suitable ones within a short time. Selected interests are highlighted to signify the selection. To deselect any interest, just tap it again.
Figure 3.9: Picker View and Date Pickers
Chapter 3: System Design 3.4 Parse Core Setup
Figure 3.11: System Architecture Diagram
Figure 3.11 shows an overview of the system architecture and the relationship between each component. This project used Parse Core as its backend. Parse Core is the database component of Parse, a Mobile Backend as a service (MBaaS), a model of cloud computing, owned by Facebook, Inc (Cutler and Constine, 2013). The service handles and stores basic data types, which includes images and files in the cloud. It allows for custom server-side logic and scheduled recurring tasks using its SDKs.
First, a Parse app has to be created in the Parse web-based dashboard (http://
www.parse.com/apps). After creating the Parse app, a set of application and client keys will be generated for the app. These keys allow applications to connect to the correct Parse app. In order for the mobile application to connect to Parse Core, the aforementioned keys have to be added to the project file. In the Xcode project, open the AppDelegate.swift file and add both the application and client keys with the line of code as below to the application:didFinishLaunchingWithOptions function, this will allow the mobile application to connect to the UniCAT Parse app.
Parse.setApplicationId("7UFsHzCG5NRgycDbxVDDU0RZHhK81jWVWcBZHMOB", clientKey: "WpQjPL4eKx7SVhb097Tr8uAJZDqF6FS7z0Rjyw3k")
Chapter 3: System Design
The keys in the box are working as of the writing of this report. However, please note that the keys can be reset in the Parse web-based dashboard by anyone with access to the Parse app. Therefore, it is advisable to get the latest keys from the Parse web- based dashboard to avoid any unexpected errors.
Figure 3.12: Screenshot of Parse Core Import Data Window
The next step is to set up the classes in Parse Core. In the Parse web-based dashboard, select “Core” from the navigation bar. There’s an “Import” button that allows user to import existing classes and objects into Parse Core. Drag and drop the JSON files into the Import Data window, shown in Figure 3.12. There are a total of 8 JSON files needed to be imported: _User.json, Event.json, EventAttendance.json, EventView.json, Interest.json, EventInterest.json, UserInterest.json and InterestLevel.json. This will set up all the required classes and data for the event module of the mobile UniCAT system.
Chapter 4: Methodology and Tools 4.1 Project Methodology
This project will adopt the Evolutionary Prototyping methodology as its software development methodology.
For mobile application, interface design is an important factor towards its usability due to its limited screen size. Therefore, user input is extremely important for this project. In this methodology, prototypes are repeatedly presented to users for feedbacks and suggestions. Also, well-understood requirements will be implemented first. Other requirements are added later on after they are fully understood.
Figure 4.1: Flow chart of the Evolutionary Prototyping methodology Gather User
Requirements
Perform module design
Construct Prototype
Final Product
Refine Prototype
User Evaluation
Chapter 4: Methodology and Tools 4.1.1 General Work Procedures
Figure 4.2: Work flow diagram of the Evolutionary Prototyping methodology Study on UniCAT system
- Study and analyse the architecture of UniCAT.
- Understand the purpose of the system.
- Determine the problems of the existing system.
Scope and objectives planning
- Gathering requirements of the project.
- Determine the project scope.
- Setting objectives for the project.
- Setting project
workflow and milestone
Application analysis and Solution proposal
- Analyse the requirements.
- Refer to similar systems to determine a better solution.
Development phase 1 (API Implementation)
- Setup the back-end server to respond to web request Development phase 2
(Event sharing module)
- Develop a mobile UI skeleton
- Implement the event sharing services.
- Prepare room for Behaviour learning module.
Development phase 3
(Behaviour learning module)
- Implement the user
tracking and interest system into the system
User evaluation and testing
- User evaluates the prototype and gives feedbacks.
System deployment
- Initiate the service on the server
- Publish the mobile UniCAT application to users.
Chapter 4: Methodology and Tools 4.1.2 Work Procedure Elaboration
Before the planning stage, some research is performed on the existing UniCAT system which includes understanding its server-client architecture, the project background and contributions of previous developers. Problems in the UniCAT system are identified and the problem statement is constructed.
In the planning stage, the project scope is set based on the research and findings. The objectives and expected contribution are then derived from the project scope. Next, methods and project workflow are decided.
During the analysis and design stage, several existing systems that fit the project scope are reviewed. Strengths and limitations of said systems are recorded and analysed. The findings are then tabulated in a comparison table and with considerations of the findings and research done, a solution is proposed.
There are three phases in the development stage. The first phase is to setup the back- end server to respond to web requests. The application programming interface (API) is implemented. The second phase is to develop a mobile UI skeleton with room for the behaviour learning module. The event sharing services are implemented. The third phase is the development of the behaviour learning module, it includes the development of a simple algorithm that can collect user behaviours. Necessary modifications are made to ensure the contents are displayed correctly and able to work with the event sharing module.
A prototype is delivered to the user for evaluation and feedbacks at the end of every phase. If adjustments are needed, the prototype will be returned to the previous phase.
This will go on until the end of the third development phase. In the system deployment stage, a mobile application is built and distributed to users via the App Store TestFlight distribution channel. Feedbacks from users are then collected for maintenance purposes.
Chapter 4: Methodology and Tools
4.2 Tools Used 4.2.1 Software
Xcode IDE
A development software that is used to develop and debug the mobile application
Parse Core
A mobile-backend-as-a-service used as the project’s back-end database.
SQLite 3
An open-source mobile-first database used as the project’s embedded database.
Sublime Text 3
A text and source code editor used for the web component of the project.
Omni Graffle
A diagramming program used to document and organise ideas, processes, and system.
Sketch
A vector drawing software used to design the user interface component of the project.
Affinity Designer
A design software used to enhance the graphical component of the project.
GitHub Desktop
A git software used for distributed revision control and source code management (SCM) of the project.
OS X v10.10 Yosemite
OS X is the operating system that will be used during the project.
Chapter 4: Methodology and Tools
4.2 Hardware
Computer
System type: Laptop
Processor: 2.3 GHz Intel Core i5
Installed memory: 8 GB 1333 MHz DDR3
Smartphone
A 32 GB iPhone 5C running iOS version 8.0 is used to test the application functionality and actual performance.
4.3 Timeline 4.3.1 Gantt Chart
Figure 4.3: Gantt Chart
ID Task Name Start Finish Duration
Q1 2015 Q2 2015 Q3 2015
Jan Feb Mar Apr May Jun Jul Aug Sep 1 Study existing system 12-Jan-15 25-Jan-15 2w
2 Planning 26-Jan-15 8-Feb-15 2w
3 Requirement analysis 9-Feb-15 15-Feb-15 1w 4 System design 16-Feb-15 1-Mar-15 2w 5 System development 2-Mar-15 16-Aug-15 24w
6 Phase 1 2-Mar-15 29-Mar-15 4w
7 Phase 2 30-Mar-15 7-Jun-15 10w
8 Phase 3 7-Jun-15 16-Aug-15 10w
9 System Deployment 17-Aug-15 13-Sep-15 4w
10 Report 1 12-Jan-15 1-Mar-15 7w
11 Report 2 1-Jun-15 23-Aug-15 12w
Chapter 5: Implementation and Testing
5.1 Implementation 5.1.1 Event Module
In the Event List View, important event information such as event title, start time and date, along with its location are wrapped inside the UIVisualEffectView component with Vibrancy applied. Vibrancy is an on-screen visual effect introduced by Apple alongside the frosted glass effect introduced in iOS 8 (Nystrom, 2014). Figure 5.1 illustrates two sets of label and button, one with no vibrancy and another with vibrancy enabled. This design allows the event information to blend with the event cover photos in the background, while making the content more vivid, grabbing the attention of the user. This also minimises the height of the row of events without sacrificing the amount of information displayed.
The event will signify that it’s happening now with the date showing “Now” if the event is currently happening, as shown in Figure 5.2 (c), where the campus-wide Anti- Polystyrene Campaign is on-going. The “Favourite” event list view, as shown in Figure 5.2 (b), included additional ribbons at the right side to signify the choice made by the user for the event, which are either “Going” or “Maybe”. The “Going” label will change to “Went” for events that have passed. Events with interests that matches the user interests will show up here with “Suggestion” ribbon.
Figure 5.1: Comparison of the Vibrancy Effect
Chapter 5: Implementation and Testing
Figure 5.2: Screenshots of Event List View
The Event Detail View, as shown in Figure 5.3 (a), is implemented with the UITableViewController with self-sizing cells that was introduced in iOS 8. The self- sizing cells is introduced to support the dynamic type accessibility setting that allows for text in apps to enlarge dynamically to ease visually impaired users and those with special needs (Ng, 2014). This allowed the event description section to automatically scale according to the length of the description. The Attendance Bar (Figure 5.3 (b)) contains three options, which are “Going”, “Maybe” and “Not Interested”. When user selects “Going” or “Maybe”, this means that they’re interested in the event. The system will then record that the user is interested in the event, adding the event to the favourite list. Other options will be greyed out when the attendance is set, as shown in Figure 5.3 (c). The number of users that are attending, maybe attending or are not interested are shown to authorised users. With these information, the authorised users, which includes event planners, are able to estimate the number of people that will be attending the events.
(a) Past Event (b) Favourite (c) All Event
Chapter 5: Implementation and Testing
Figure 5.3: Screenshots of Event Detail View and Attendance Bar States
In the event editor, for event venue, user only need to key in the room number, for example, with input of A001, the system will know that it’s in the Heritage Hall. If it’s a campus-wide event, user only has to put “UTAR” as the venue. This is made possible with the implementation of a building class that accepts input of room number and detects the building from it. Venue names are also accepted in addition to room number. In the event that the input venue is not a room number, the class will return the original input. When the Save button is tapped, the system validates the form by checking if the mandatory fields, which are the event name and event description are left blank. If any of the two fields are blank, a Warning alert will be shown, highlighting the blank fields, prompting the user to complete the form. If the validation returned no error, the event information are saved and a Success alert is shown before the event editor is dismissed.
(a) Event Detail (Part 1) (b) Event Detail (Part 2) (c) Attendance Set
Chapter 5: Implementation and Testing 5.1.2 Interest System
Figure 5.4: Screenshots of Interest and Choose Interest View
As shown in Figure 5.4, each interest is represented by an icon for easy visualisation and understanding of the interests. The UICollectionView component is used to display the various interests in a grid view. UICollectionView allows for multiple selections, which is required for the interest system.
The interest system is implemented for both events and users. Each event is tagged with relevant interests that describes the nature of the event. For example, a competitive marathon would be tagged with the “Sports” and “Competition” interests.
These event interests can be added or updated through the “Heart” button at the bottom left of the Event Detail View, as shown in Figure 5.3. User interests are selected when the user first registered. These user selected interests are static at the beginning and can be updated through the user profile. As the user interact with the events by rating, favouriting and sharing them, the user interests are adjusted accordingly. Over time, the user interests becomes dynamic, reflecting the actions of the user, and their current interests. A research student is currently doing the research
Chapter 5: Implementation and Testing
The Attendance Bar, shown in Figure 5.3 (b, c), which doubles as the favourite system in the Event Detail View, allows the system to know whether the user is interested in the event or not. The system will record the user’s interests in the event by adjusting the user interests weightage accordingly, in addition to adding the event to the user’s favourite list.
5.1.3 Report Generation
Figure 5.5: Screenshot of the Sample Reports web page
The UniCAT system compiles the user data from time to time, potentially it’ll be a big data and may need analysis. These reports are generated to display the collected user data and preferences. The graphs and charts of the sample reports are implemented using the Chart.js javascript library. The reports are then embedded into HTML documents as shown in Figure 5.5. The chart data are retrieved from Parse Core with its Javascript SDK. The report data are not generated in real time however, instead, the data are updated by scheduled server side scripts for Parse called cloud code which runs in Parse Cloud. This is to lessen the burden of the server due to large amount of data processing and also to improve the load time of the web-based report documents.
Chapter 5: Implementation and Testing 5.1.4 Others
Figure 5.6: Screenshots of the Map Module
The map view is implemented using the JCTiledScrollView library, developed by Jesse Collis. The library is a set of classes that wrap the UIScrollView component and the CATiledLayer library to enable panning and zooming of the map at multiple zoom scales. The map itself is a portable document format (PDF) file which is loaded progressively by CATiledLayer to improve the loading speed. Map annotations are then programmatically placed onto the map to mark each building. The database is queried for the events for each building and the event count is shown inside the map annotations for each building, as shown in Figure 5.6 (a).
Building view is implemented with the ParallaxBlur library to achieve the parallax image effect. The library is developed by Software for Good. It wraps the UITableViewController component with a parallax header that is blurred dynamically with the FXBlurView library. The library allows for a fixed 60 pixels area, which displays the name of the building at the top of the display as the user scrolls through the building view, as shown in Figure 5.6 (c). This design allows the user to always (a) Map View (b) Building Detail (Part 1) (c) Building Detail (Part 2)
Chapter 5: Implementation and Testing
Figure 5.7: Screenshots of the Side menu
To implement the slide-out side menu, the SWRevealViewController library is used.
The library is developed by John Lluch. Several menu options will show and hide according to the user status. When the user is logged in as a normal user, “Favourites”
will show up, as shown in Figure 5.7 (b). If the user is an authorised user, with the ability to add and update events, in addition to the previous options, “Add Event” will be shown (Figure 5.7 (c)). All the menu options are loaded dynamically, this allows for more fluid menu changes between user status. Also, as more modules are added to the system in the future, menu option additions to the menu will be a breeze.
For the user tracking system, user actions, which includes view, favourite, add, update and share event, are recorded into the system database in real time as the aforementioned actions are performed by the user. The record includes the user identification, event identification, the action type and the date and time for when the action is performed. There are many uses for this data, for example, this data can be used by system administrators to trace any culprit that has spread fake information in the system. Besides that, this data can be used for data analysis purposes.
(a) Not logged in (b) Logged in (c) Authorised user
Chapter 5: Implementation and Testing
5.2 Black Box Testing 5.2.1 Event Module
Table 5.2.1: Event Module Test Case
Event Module
Case Test Action Test Result Status
1 Tap on Event option in side menu.
Event List View appeared.
Pass
2 Tap on one of the event in event list.
Event Detail View appeared, showing all the event information and description.
Pass
3 Tap on the event venue in event detail.
Building Detail View appeared, showing information on the event venue.
Pass
4 Tap on the contact bar in event detail.
A call alert showing the contact number appeared to confirm calling the number.
Pass
5 Tap on the Facebook bar in event detail.
The Safari web browser appeared and loaded the event Facebook page.
Pass
6 Tap on “Going” at the attendance bar in event detail.
The “Maybe” and
“Not Interested”
buttons greyed out.
Pass
7 After case 6, tap on
“Maybe”.
The “Going” greyed out and “Maybe”
return to blue colour.
Pass
8 After case 7, navigate back to event list and tap the same event.
The attendance bar shows the “Going”
and “Not Interested”
buttons as greyed out.
Pass
9 After case 8, tap on Favourite option in side menu.
The event showed up correctly and has a ribbon showing
Pass
Chapter 5: Implementation and Testing
5.2.2 Event Editor
Table 5.2.2: Event Editor Test Case
Event Editor
Case Test Action Test Result Status
1 Tap on Add Event option in side menu.
Event List View appeared, then the Event Editor pop out.
Pass
2 Select an end date and time that is before the start date and time
The end date date picker reverted back to a date and time that is after the start date
Pass
3 Select an end date and time that is after the start date and time
The selected end date shows correctly in the end date field.
Pass
4 Tap on Save button with all the input fields left blank
Warning alert is shown as mandatory field must be filled.
The blank mandatory fields are highlighted in red.
Pass
5 Tap on Save button with mandatory input fields left blank
Warning alert is shown as mandatory field must be filled.
The blank mandatory fields are highlighted in red.
Pass
6 Tap on Save button with optional input fields left blank
Success alert is shown as changes are saved successfully and the Event Editor closed.
Pass
7 Tap on Save button after filling all the input fields
Success alert is shown as changes are saved successfully and the Event Editor closed.
Pass
Chapter 6 : Conclusion
6.1 Project Review
This project strives to provide easy access to updated information on local events to the students, visitors and locals in Kampar, Perak while on the go. The event sharing module of the UniCAT client for mobile, in the form of a mobile application, allows the target users to easily create, share and discover the events and happenings, directly on the device in the palm of their hands. With this, event planners can promote their events to the correct audience. Additionally, as authorised users are able to create, update and contribute to events information, this enables the system to have an updated event list and details. The final system successfully meets the project objective of developing an information sharing module using mobile solution which allows user to create, share and discover local events.
This project also marks the first time UniCAT entering the mobile platform, opening the way for more interactions between new users and its existing users alike, enabling them to access it at anytime, anywhere. And with more interactions and higher usage, UniCAT can better understand its users’ behaviours and interests. The implemented interest system and user tracking form the simple behaviour learning mechanisms for the system. The dynamic user interests allows the system to understand the user’s interests and deliver better content to the user.
Chapter 6 : Conclusion
6.2 Impact, significance and contribution
UniCAT has taken its first step into the mobile platform. It now has a new way of collecting user behaviours without disrupting the user experience through user tracking and interest system. Local event information are usually scattered around various social networks, web portals, or spread through emails, this has made it hard for students, visitors and locals to search for events. By solving this problem, students, visitors and locals alike will be able to get up-to-date knowledge of the latest events and happenings around them with ease, and in one place. And as a plus, the UniCAT system will be populated with local events complete with details.
6.3 Future Work
The iOS platform is chosen as the initial deployment platform of the mobile UniCAT system due to the platform’s highly accessible development tools and stable environment. Thus, it is suitable for a project without any mobile precedent as reference which in turn requires quite an amount of prototyping efforts. With that said, studies have shown that the Android platform is the most widely used mobile platform in the world, dominating the market share of smartphone OS with an 82.8%
share in 2015, with iOS only taking 13.9% (International Data Corporation, 2015).
Therefore, with the system design finalised, the next step for UniCAT should be to develop a native Android version to cater to the larger user base.
Besides that, the area coverage of the system could be enlarged. The desktop client for UniCAT contained maps for Eastlake Kampar, the mobile client should implement support for other areas in Kampar, which include Westlake, Eastlake, New Town and Old Town Kampar, and possibly expand to other domains in the future. New maps that matches the aesthetics of the current UTAR map should be illustrated for these areas for consistency sake. With the addition of these new areas, it would appeal to more users as the system will not be limited to events organised in the university.
Bibliography
Amitech Business Solutions 2014, All Events in City. Available from: <http://
allevents.in> [9 August 2014].
Apple 2015, App Store Review Guidelines. Available from: <https://
developer.apple.com/app-store/review/guidelines/> [30 August 2015].
Cutler, K and Constine, J, Facebook Buys Parse To Offer Mobile Development Tools As Its First Paid B2B Service. Available from: <http://techcrunch.com/
2013/04/25/facebook-parse/> [30 August 2015].
Eventbrite 2014, Eventbrite App. Available from: <http://www.eventbrite.com/
eventbriteapp/> [9 August 2014].
Google 2012, The New Multi-screen World: Understanding Cross-platform Consumer Behavior, Google. Available from: <http://services.google.com/fh/files/misc/
multiscreenworld_final.pdf>. [10 August 2014].
Hangtime 2014, Hangtime. Available from: <http://www.hangtime.com> [9 August 2014].
International Data Corporation 2015, Smartphone OS Market Share, 2015 Q2.
Available from: <http://www.idc.com/prodserv/smartphone-os-market- share.jsp> [30 August 2015].
Lawler, R 2012, Eventbrite Now Recommends Events To 20 Million Users, Boosting Ticket Sales Along The Way. Available from: <http://techcrunch.com/
2012/08/03/eventbrite-recommendations/>. [9 August 2014].
Ng, S 2014, Understanding Self Sizing Cells and Dynamic Type in iOS 8. Available from: <http://www.appcoda.com/self-sizing-cells/>. [30 August 2015].
Nystrom, R 2014, UIVisualEffectView Tutorial: Getting Started. Available from
<http://www.raywenderlich.com/84043/ios-8-visual-effects-tutorial>. [30 August 2015]
Patel, N 2013, Twitter Granted patent on pull-to-refresh, promises to only use it defensively. Available from <http://www.theverge.com/2013/5/21/4350826/
twitter-pull-to-refresh-patent-innovators-patent-agreement-announced>. [29 August 2015]
Shieh, YX 2014, Re-engineering and performance optimization of university cyber agent (UniCAT) system, p.4, Final Year Project, UTAR. Available from: UTAR Institutional Repository. [10 August 2014].
S t u m b l e U p o n I n c . 2 0 1 4 , S t u m b l e U p o n. Av a i l a b l e f r o m : < h t t p s : / / www.stumbleupon.com/mobile> [9 August 2014].
Tech-ICT.com Limited n.d., Evolutionary Prototyping. Available from: <http://
www.teach-ict.com/as_a2_ict_new/ocr/A2_G063/331_systems_cycle/
prototyping_RAD/miniweb/pg3.htm> [11 August 2014].
Vamos & Friends UG 2014, Vamos. Available from: <http://www.getvamos.com> [9 August 2014].
Appendix
The New Multi-screen World:
Understanding Cross-platform Consumer Behavior (Slide 20 and 21)
another device. Please select which device you started and then continued on. If you have not done this, select “I have not done this”. 20
60%
4%
45%
3%
58%
5%
56%
3%
61%
4%
58%
8%
48%
8%
Continued on a PC
Continued on a tablet
Planning
a Trip Managing Finances Social
Networking Searching
for Info Browsing
the Internet Watching an
Online Video Shopping
Online
Smartphones are the most common starting place for online activities
65% 63% 65% 47% 59% 66% 56%
Started on smartphone
another device. Please select which device you started and then continued on. If you have not done this, select “I have not done this”. 21 Continued on
a smartphone
Searching for Info
23%
6%
31%
7%
24%
6%
29%
6%
19%
5%
27%
4%
24%
10%
Continued on a tablet
Planning
a Trip Managing Finances Social
Networking Browsing
the Internet Watching an
Online Video Shopping
Online
PCs are most often a starting point for more complex activities
29% 30% 25% 34% 30% 34%
Started on a
PC/laptop 38%