ENERGY
BALANCE
2019
PUBLISHED BY:
SURUHANJAYA TENAGA (ENERGY COMMISSION) No. 12, Jalan Tun Hussein,
Precinct 2, 62100 Putrajaya, Malaysia
Tel • +603 8870 8500 Fax • +603 8888 8637 www.st.gov.my
https://meih.st.gov.my ISSN NO.: 0128 – 6323
ST Publication No.: ST (P) 02/02/2022
information or matter (expressed or implied) arising out of, contained in or derived from, or for any missions from the information in this publication, or in respect of a person’s use of the information (including any reliance on its currency, accuracy, reliability or completeness) contained in this publication.
© All rights reserved. Reproduction of all or any part of this publication via electronic, photocopy, mechanical, recording or other medium is strictly prohibited without prior written consent from the Energy Commission.
For any excerpt of the content of this publication, the following should be quoted:
“Source: Energy Commission”.
76 ENERGY
FLOW CHART NOTES ON ENERGY BALANCE
80
CONVERSION
COEFFICIENTS AND EQUIVALENCE
81 DEFINITION
78 79 79 79 80
Energy Balance Format Notes on Electricity Notes on Coal Notes on GDP Notes on GNI
KEY ENERGY STATISTICS
TABLE OF CONTENTS
ELECTRICITY
50 51 51
52 53
Table 10: Installed Capacity as of 31 December 2019, in MW Figure 26: Share of Installed Capacity
as of 31 December, 2019 Table 11: Available Capacity as of
31 December 2019, in MW
Figure 27: Share of Available Capacity as of 31 December, 2019 Table 12:
54
55 55 55
56
Table 13: Installed Capacity of Mini Hydro Power Stations, 2019
Table 14: Transmission Network in Circuit – kilometres, 2019 Table 15: Distribution Network in
Circuit – kilometres, 2019 Table 16: Gross Generation,
Consumption, Available Capacity, Peak Demand and Reserve Margin for Electricity in Malaysia, 2019
Figure 28: Energy Input in Power Stations, 2019
56 57 57 58 59
60
Figure 29: Generation Mix by Fuel Type, 2019
Table 17: Electricity Consumption by Sectors in GWh, 2019 Figure 30: Electricity Consumption
by Sectors in 2019 Figure 31: Electricity Consumption
by Sectors in 2019 Table 18: Electricity Generation
and Installed Capacity of Renewable Energy by Public Licensees by Region in 2019 Table 19: Electricity Generation
and Installed Capacity of Renewable Energy by Private Licensees by Region in 2019
62 63 64 65 66
Table 20: Table 21: Table 22: Table 23: Table 24:
Primary Energy Supply in ktoe
Net Import and Export of Energy in ktoe
Conversion in Gas Plants in ktoe
Conversion in Refineries in ktoe
Conversion in Power Stations (exclude co- generation & private licensed plants) in ktoe
67 68 69
70
72
Table 25: Table 26: Table 27:
Table 28:
Table 29:
Final Energy Consumption by Sectors in ktoe
Final Energy Consumption by Type of Fuel in ktoe Final Consumption for Petroleum Products in ktoe
Selected Energy and Economic Indicators (1990-2019)
Energy Balance Table in 2019 (kilotonnes of oil equivalent)
Installed Capacity of Major Hydro Power Stations, 2019
Table 1:
Table 2:
Figure 1:
Figure 2:
Figure 3:
Figure 4:
Figure 5:
Figure 6:
Figure 7:
Figure 8:
Figure 9:
Figure 10:
Figure 11:
Figure 12:
12 13 16
17
18 19
20 21 22 23 24 25 26 27
28
29 30 31
OIL COAL
34 34 34
35 36 37 38
40
40 41
42 43
46
46 47 48
KEY ECONOMIC AND ENERGY
DATA
TABLE OF CONTENTS
NATURAL
GAS ELECTRICITY
Key Economic and Energy Data
Key Economic and Energy Data by Region
Trends in GDP, Primary Energy Supply and Final Energy Consumption Primary Energy Supply, Electricity Consumption and Final Energy Consumption per Capita Trends in GDP and Electricity Consumption Annual Growth Rates of GDP, Primary Energy Supply, Final Energy Consumption and Electricity Consumption Primary and Final Energy Intensity
Electricity Intensity Final Energy and Electricity Elasticity Primary Energy Supply Final Energy Consumption by Sectors
Final Energy Consumption by Fuel Type
Official Selling Prices of Malaysian Crude Oil Ex-Singapore Prices of Major Petroleum Products
Figure 13:
Figure 14:
Figure 15:
Figure 16:
Annual Liquefied Petroleum Gas (LPG) Contract Prices – Arab Gulf
Average Annual Prices of Natural Gas in Malaysia Final Energy Consumption per Capita in ASEAN Final Energy Intensity in ASEAN
Resources and Production of Oil as of 1 January, 2019 Refinery Licensed Capacity, 2019
Breakdown on Sales of Petroleum Products in Thousand Barrels, 2019 Net Export of Crude Oil Export and Import of Petroleum Products Production of Petroleum Products from Refineries Final Consumption for Petroleum Products Table 3:
Table 4:
Table 5:
Figure 17:
Figure 18:
Figure 19:
Figure 20:
Table 6:
Table 7:
Figure 21:
Figure 22:
Figure 23:
Resources and Production of Natural Gas as of 1 January, 2019 Consumption of Natural Gas in MMscf, 2019 Export and Import of Piped Natural Gas and LNG
Natural Gas Consumption by Sectors
Conversion in Gas Plants
Table 8:
Table 9:
Figure 24:
Figure 25:
PREFACE
INTRODUCTION
DATA COMPILATION EXECUTIVE SUMMARY 6 7
8 9
Resources and Production of Coal as of 31 December, 2019
Consumption of Coal in
Metric Tonnes, 2019
Net Import of Coal
Coal Consumption by
Sectors
76 ENERGY
FLOW CHART NOTES ON ENERGY BALANCE
80
CONVERSION
COEFFICIENTS AND EQUIVALENCE
81 DEFINITION
78 79 79 79 80
Energy Balance Format Notes on Electricity Notes on Coal Notes on GDP Notes on GNI
KEY ENERGY STATISTICS
TABLE OF CONTENTS
ELECTRICITY
50 51 51
52 53
Table 10: Installed Capacity as of 31 December 2019, in MW Figure 26: Share of Installed Capacity
as of 31 December, 2019 Table 11: Available Capacity as of
31 December 2019, in MW
Figure 27: Share of Available Capacity as of 31 December, 2019 Table 12:
54
55 55 55
56
Table 13: Installed Capacity of Mini Hydro Power Stations, 2019
Table 14: Transmission Network in Circuit – kilometres, 2019 Table 15: Distribution Network in
Circuit – kilometres, 2019 Table 16: Gross Generation,
Consumption, Available Capacity, Peak Demand and Reserve Margin for Electricity in Malaysia, 2019
Figure 28: Energy Input in Power Stations, 2019
56 57 57 58 59
60
Figure 29: Generation Mix by Fuel Type, 2019
Table 17: Electricity Consumption by Sectors in GWh, 2019 Figure 30: Electricity Consumption
by Sectors in 2019 Figure 31: Electricity Consumption
by Sectors in 2019 Table 18: Electricity Generation
and Installed Capacity of Renewable Energy by Public Licensees by Region in 2019 Table 19: Electricity Generation
and Installed Capacity of Renewable Energy by Private Licensees by Region in 2019
62 63 64 65 66
Table 20:
Table 21:
Table 22:
Table 23:
Table 24:
Primary Energy Supply in ktoe
Net Import and Export of Energy in ktoe
Conversion in Gas Plants in ktoe
Conversion in Refineries in ktoe
Conversion in Power Stations (exclude co- generation & private licensed plants) in ktoe
67 68 69
70
72
Table 25:
Table 26:
Table 27:
Table 28:
Table 29:
Final Energy Consumption by Sectors in ktoe
Final Energy Consumption by Type of Fuel in ktoe Final Consumption for Petroleum Products in ktoe
Selected Energy and Economic Indicators (1990-2019)
Energy Balance Table in 2019 (kilotonnes of oil equivalent)
Installed Capacity of Major Hydro Power Stations, 2019
Table 1:
Table 2:
Figure 1:
Figure 2:
Figure 3:
Figure 4:
Figure 5:
Figure 6:
Figure 7:
Figure 8:
Figure 9:
Figure 10:
Figure 11:
Figure 12:
12 13 16
17
18 19
20 21 22 23 24 25 26 27
28
29 30 31
OIL COAL
34 34 34
35 36 37 38
40
40 41
42 43
46
46 47 48
KEY ECONOMIC AND ENERGY
DATA
TABLE OF CONTENTS
NATURAL
GAS ELECTRICITY
Key Economic and Energy Data
Key Economic and Energy Data by Region
Trends in GDP, Primary Energy Supply and Final Energy Consumption Primary Energy Supply, Electricity Consumption and Final Energy Consumption per Capita Trends in GDP and Electricity Consumption Annual Growth Rates of GDP, Primary Energy Supply, Final Energy Consumption and Electricity Consumption Primary and Final Energy Intensity
Electricity Intensity Final Energy and Electricity Elasticity Primary Energy Supply Final Energy Consumption by Sectors
Final Energy Consumption by Fuel Type
Official Selling Prices of Malaysian Crude Oil Ex-Singapore Prices of Major Petroleum Products
Figure 13:
Figure 14:
Figure 15:
Figure 16:
Annual Liquefied Petroleum Gas (LPG) Contract Prices – Arab Gulf
Average Annual Prices of Natural Gas in Malaysia Final Energy Consumption per Capita in ASEAN Final Energy Intensity in ASEAN
Resources and Production of Oil as of 1 January, 2019 Refinery Licensed Capacity, 2019
Breakdown on Sales of Petroleum Products in Thousand Barrels, 2019 Net Export of Crude Oil Export and Import of Petroleum Products Production of Petroleum Products from Refineries Final Consumption for Petroleum Products Table 3:
Table 4:
Table 5:
Figure 17:
Figure 18:
Figure 19:
Figure 20:
Table 6:
Table 7:
Figure 21:
Figure 22:
Figure 23:
Resources and Production of Natural Gas as of 1 January, 2019 Consumption of Natural Gas in MMscf, 2019 Export and Import of Piped Natural Gas and LNG
Natural Gas Consumption by Sectors
Conversion in Gas Plants
Table 8:
Table 9:
Figure 24:
Figure 25:
INTRODUCTION
DATA COMPILATION EXECUTIVE SUMMARY 7 8
9
Resources and Production of Coal as of 31 December, 2019
Consumption of Coal in
Metric Tonnes, 2019
Net Import of Coal
Coal Consumption by
Sectors
PREFACE
In recent years, the energy landscape in Malaysia encountered rapid transformations, driven by the rise of renewable energy (RE), new technologies, and emphasis placed on energy efficiency, among others.
The current electricity regulation regime is also influenced by decarbonisation, digitisation and decentralisation where most developed countries are already advocating. All of these seem new to Malaysia, but developed countries have long advocated for these practices, therefore it is best that we learn from their best practices. In realising the Commission’s vision to be a world class regulator, numerous efforts need to be undertaken, especially in areas of research and study on the best regulatory and governance regimes that will propel us forward.
The energy sector is the biggest carbon dioxide emitter in Malaysia and therefore boosting the RE capacity could potentially offset the emission from fossil fuel plants on top of reducing energy usage and wastage. Solar photovoltaic capacity in Malaysia has increased tremendously since the launch of the Large Scale Solar (LSS) and Net Energy Metering (NEM) programmes in 2017. A lot have been accomplished since they were first introduced in 2012 under the Feed-in-Tariff scheme.
Altogether, Malaysia would be more than able to deliver its target of achieving 31% of RE in the total installed capacity by year 2025. This is also in line with our renewed commitment to reduce greenhouse gas (GHG) emission intensity by 45% unconditionally by 2030 from its 2005 level. Although RE seems like the ideal solution, there remain limitations on the national grid.
Numerous technologies are currently researched worldwide, to reduce GHG emission and one of them is Carbon Capture, Utilisation and Storage (CCUS). CCUS is basically focused on converting high concentrated carbon dioxide emitted by fossil fuel plants into a useful chemical that is commercially used or storing it permanently in geological formations, oceans or soil. CCUS is an effective way of removing carbon dioxide from the atmosphere but there are still limitations and constraints that could hinder its commercial implementation. Aside from CCUS, hydrogen fuel could potentially be an environmentally friendly alternative, substituting some of the conventional fuels still used in Malaysia. It is gaining popularity in Japan, and other ASEAN countries are most likely to follow suit.
For the time being, to integrate these new technologies mentioned above, such as hydrogen and CCUS into an energy statistics report such as the energy balance is a challenge. Hydrogen do not possess thermal characteristics thus the formulation of relevant energy units is impractical. Furthermore, there are no set standards for these fuels to be included in energy statistics. However, with the support from international agencies such as the International Energy Agency (IEA), United Nations Statistics Division (UNSD) and Asia Pacific Energy Research Centre (APERC) we hope that we can overcome this challenge and eventually devise a methodology to include these new technologies into the energy balance.
I would like to express my heartfelt gratitude to our honourable Prime Minister, Minister of Energy and Natural Resources, the Ministry of Energy and Natural Resources and the Economic Planning Unit (EPU) for their continuous support and guidance in realising the National Energy Balance (NEB) each year. My appreciation also goes out to all our stakeholders and data providers for their contributions especially the timely and systematic way data is provided to the Commission. It is my sincere belief that this report will be a useful guide for policy makers and authorities to make sound decisions for the future of the country’s energy landscape.
We look forward to working together again in the future.
Thank you.
Dato’ Azian Osman Chairman
Energy Commission Malaysia
In 2019, the economy grew at the rate of 4.3% (2018:
4.7%) and it is mainly driven by the private sector spending. It has been a rather challenging year globally and Malaysia had also not been spared. This circumstance was brought forth by issues such as unresolved trade tensions, slower investments and trading activities, coupled with geopolitical instabilities. Towards the end of 2019, the world is shocked by the Coronavirus disease (COVID-19) pandemic which had affected our country’s economic and social wellbeing. Nevertheless, amid all these challenges, the Malaysian economy managed to expand at a moderate growth.
Total primary energy supply (TPES) increased by 2.9%
(2018: 1.7%) compared to the previous year and this is primarily driven by an increase in the oil supply. Crude oil recorded a higher import of 10,306 ktoe compared to 9,239 ktoe in 2018. The TPES of coal on the other hand, reported a decline of 5.5% which resulted from lower imports as consumption for coal especially in the Peninsular Malaysia’s power plants has declined compared to the previous year. The trend for other fuels’
supply did not differ from the previous year. In 2019, natural gas and oil (which includes crude oil and petroleum products) constituted three-quarters of the total primary energy supply, followed by coal and renewable energy (RE) with shares of 21.4% and 3.4%
respectively.
Final energy consumption has also increased by 2.8% in 2019 (2018: 3.5%). The transport and commercial sector showed significant increase from the previous year, by 6.2% and 5.2% respectively. The industry sector’s energy consumption has declined slightly from 19,046 to 18,921 ktoe. Similarly, the residential sector’s consumption also has reduced slightly from 3,343 ktoe to 3,339 ktoe. The agriculture sector’s consumption reduced from 1,021 to 927 ktoe. With regards to its share, the transport and industry sector still dominate the top spots for the biggest energy consumer with each taking up 37.6% and 28.5% of the total energy consumption. This is followed by the non-energy sector at 20.5%, commercial sector at 7.0%, residential sector at 5.0% and the remainder 1.4%, which is consumed by agriculture.
Installed capacity recorded at the end of December 2019 was 36,121 MW. Natural gas plants had the biggest capacity in the country with a total of 14,403 MW, followed closely by coal plants with 13,284 MW. The total capacity of coal plants has increased with the commissioning of Jimah East power plant in Peninsular as well as Balingian power plant in Sarawak. The share of RE in the total installed capacity, as expected has risen from 7,597 MW to 7,773 MW or an increment of 2.3%.
Solar power shows the most significant increase, from 797.1 MW to 996.4 MW in the span of one year. This is
of RE in the capacity mix by year 2025. As of 2019, the RE capacity stands at 21.5% (including self-generation plants).
Electricity generation (excluding self-generation plants) increased by 5.1%, to 171,672 GWh. The generation mix showed coal as the largest source of fuel at 44.5%, followed by natural gas at 38.6%, hydro at 15.3%, RE at 1.2% and the remainder 0.5% in oil. Like electricity generation, the trend of electricity consumption also went up by 3.8%, from 152,866 GWh to 158,603 GWh. Industry sector was the largest electricity consumer with 78,427 GWh, followed by the commercial and residential sectors with 45,713 GWh and 33,322 GWh respectively. The remainder of the electricity was consumed by the transport and agriculture sectors. Although the transport sector only takes up about 0.3% of the total consumption, there is a notable increase in the value each year as the number of electric vehicles on the road has risen. Overall, all sectors showed a positive or negative growth with no remarkable difference noted.
Malaysia’s primary energy intensity declined by 1.5% while the final energy intensity also declined by 1.5%. The industry sector intensity shows an identical trend, with a decline of 1.8%. The decline in electricity intensity is a positive indication that energy efficiency has improved compared to the previous year. This goes to show that awareness campaigns on energy efficiency is paying off.
I would like to take this opportunity to extend my sincere appreciation to our honourable Prime Minister, Minister of Energy and Natural Resources and the Economic Planning Unit (EPU) for their invaluable efforts rendered to produce the National Energy Balance (NEB) 2019. I am also grateful to our Government Agencies, power utilities, independent power producers, oil and gas companies, iron and steel manufacturers, coal producers, cement manufacturers, and everyone involved for the continuous support in providing relevant and accurate data in a timely manner. We hope that this report will be a useful tool for reference and guidance in the formulation of policies, research, as well as energy planning for the future of our energy industry.
Ts Abdul Razib Dawood Chief Executive Officer Energy Commission Malaysia
INTRODUCTION
In recent years, the energy landscape in Malaysia encountered rapid transformations, driven by the rise of renewable energy (RE), new technologies, and emphasis placed on energy efficiency, among others.
The current electricity regulation regime is also influenced by decarbonisation, digitisation and decentralisation where most developed countries are already advocating. All of these seem new to Malaysia, but developed countries have long advocated for these practices, therefore it is best that we learn from their best practices. In realising the Commission’s vision to be a world class regulator, numerous efforts need to be undertaken, especially in areas of research and study on the best regulatory and governance regimes that will propel us forward.
The energy sector is the biggest carbon dioxide emitter in Malaysia and therefore boosting the RE capacity could potentially offset the emission from fossil fuel plants on top of reducing energy usage and wastage. Solar photovoltaic capacity in Malaysia has increased tremendously since the launch of the Large Scale Solar (LSS) and Net Energy Metering (NEM) programmes in 2017. A lot have been accomplished since they were first introduced in 2012 under the Feed-in-Tariff scheme.
Altogether, Malaysia would be more than able to deliver its target of achieving 31% of RE in the total installed capacity by year 2025. This is also in line with our renewed commitment to reduce greenhouse gas (GHG) emission intensity by 45% unconditionally by 2030 from its 2005 level. Although RE seems like the ideal solution, there remain limitations on the national grid.
Numerous technologies are currently researched worldwide, to reduce GHG emission and one of them is Carbon Capture, Utilisation and Storage (CCUS). CCUS is basically focused on converting high concentrated carbon dioxide emitted by fossil fuel plants into a useful chemical that is commercially used or storing it permanently in geological formations, oceans or soil. CCUS is an effective way of removing carbon dioxide from the atmosphere but there are still limitations and constraints that could hinder its commercial implementation. Aside from CCUS, hydrogen fuel could potentially be an environmentally friendly alternative, substituting some of the conventional fuels still used in Malaysia. It is gaining popularity in Japan, and other ASEAN countries are most likely to follow suit.
For the time being, to integrate these new technologies mentioned above, such as hydrogen and CCUS into an energy statistics report such as the energy balance is a challenge. Hydrogen do not possess thermal characteristics thus the formulation of relevant energy units is impractical. Furthermore, there are no set standards for these fuels to be included in energy statistics. However, with the support from international agencies such as the International Energy Agency (IEA), United Nations Statistics Division (UNSD) and Asia Pacific Energy Research Centre (APERC) we hope that we can overcome this challenge and eventually devise a methodology to include these new technologies into the energy balance.
I would like to express my heartfelt gratitude to our honourable Prime Minister, Minister of Energy and Natural Resources, the Ministry of Energy and Natural Resources and the Economic Planning Unit (EPU) for their continuous support and guidance in realising the National Energy Balance (NEB) each year. My appreciation also goes out to all our stakeholders and data providers for their contributions especially the timely and systematic way data is provided to the Commission. It is my sincere belief that this report will be a useful guide for policy makers and authorities to make sound decisions for the future of the country’s energy landscape.
We look forward to working together again in the future.
Thank you.
Dato’ Azian Osman Chairman
Energy Commission Malaysia
In 2019, the economy grew at the rate of 4.3% (2018:
4.7%) and it is mainly driven by the private sector spending. It has been a rather challenging year globally and Malaysia had also not been spared. This circumstance was brought forth by issues such as unresolved trade tensions, slower investments and trading activities, coupled with geopolitical instabilities. Towards the end of 2019, the world is shocked by the Coronavirus disease (COVID-19) pandemic which had affected our country’s economic and social wellbeing. Nevertheless, amid all these challenges, the Malaysian economy managed to expand at a moderate growth.
Total primary energy supply (TPES) increased by 2.9%
(2018: 1.7%) compared to the previous year and this is primarily driven by an increase in the oil supply. Crude oil recorded a higher import of 10,306 ktoe compared to 9,239 ktoe in 2018. The TPES of coal on the other hand, reported a decline of 5.5% which resulted from lower imports as consumption for coal especially in the Peninsular Malaysia’s power plants has declined compared to the previous year. The trend for other fuels’
supply did not differ from the previous year. In 2019, natural gas and oil (which includes crude oil and petroleum products) constituted three-quarters of the total primary energy supply, followed by coal and renewable energy (RE) with shares of 21.4% and 3.4%
respectively.
Final energy consumption has also increased by 2.8% in 2019 (2018: 3.5%). The transport and commercial sector showed significant increase from the previous year, by 6.2% and 5.2% respectively. The industry sector’s energy consumption has declined slightly from 19,046 to 18,921 ktoe. Similarly, the residential sector’s consumption also has reduced slightly from 3,343 ktoe to 3,339 ktoe. The agriculture sector’s consumption reduced from 1,021 to 927 ktoe. With regards to its share, the transport and industry sector still dominate the top spots for the biggest energy consumer with each taking up 37.6% and 28.5% of the total energy consumption. This is followed by the non-energy sector at 20.5%, commercial sector at 7.0%, residential sector at 5.0% and the remainder 1.4%, which is consumed by agriculture.
Installed capacity recorded at the end of December 2019 was 36,121 MW. Natural gas plants had the biggest capacity in the country with a total of 14,403 MW, followed closely by coal plants with 13,284 MW. The total capacity of coal plants has increased with the commissioning of Jimah East power plant in Peninsular as well as Balingian power plant in Sarawak. The share of RE in the total installed capacity, as expected has risen from 7,597 MW to 7,773 MW or an increment of 2.3%.
Solar power shows the most significant increase, from 797.1 MW to 996.4 MW in the span of one year. This is
of RE in the capacity mix by year 2025. As of 2019, the RE capacity stands at 21.5% (including self-generation plants).
Electricity generation (excluding self-generation plants) increased by 5.1%, to 171,672 GWh. The generation mix showed coal as the largest source of fuel at 44.5%, followed by natural gas at 38.6%, hydro at 15.3%, RE at 1.2% and the remainder 0.5% in oil. Like electricity generation, the trend of electricity consumption also went up by 3.8%, from 152,866 GWh to 158,603 GWh.
Industry sector was the largest electricity consumer with 78,427 GWh, followed by the commercial and residential sectors with 45,713 GWh and 33,322 GWh respectively.
The remainder of the electricity was consumed by the transport and agriculture sectors. Although the transport sector only takes up about 0.3% of the total consumption, there is a notable increase in the value each year as the number of electric vehicles on the road has risen. Overall, all sectors showed a positive or negative growth with no remarkable difference noted.
Malaysia’s primary energy intensity declined by 1.5%
while the final energy intensity also declined by 1.5%.
The industry sector intensity shows an identical trend, with a decline of 1.8%. The decline in electricity intensity is a positive indication that energy efficiency has improved compared to the previous year. This goes to show that awareness campaigns on energy efficiency is paying off.
I would like to take this opportunity to extend my sincere appreciation to our honourable Prime Minister, Minister of Energy and Natural Resources and the Economic Planning Unit (EPU) for their invaluable efforts rendered to produce the National Energy Balance (NEB) 2019. I am also grateful to our Government Agencies, power utilities, independent power producers, oil and gas companies, iron and steel manufacturers, coal producers, cement manufacturers, and everyone involved for the continuous support in providing relevant and accurate data in a timely manner. We hope that this report will be a useful tool for reference and guidance in the formulation of policies, research, as well as energy planning for the future of our energy industry.
Ts Abdul Razib Dawood
Chief Executive Officer
Energy Commission Malaysia
EXECUTIVE SUMMARY
ENERGY OVERVIEW
For decades, Malaysia has been self-sufficient where energy is concerned, and credit should be given to our Mother Nature for providing abundant natural resources in the country. The self-sufficiency rate is calculated by taking the ratio between the primary energy supply and final energy consumption. Although Malaysia have been heavily relying on oil for energy in the 90s, strategies were formulated to diversify the energy resources when the country was hit with the economic crisis in 1997. One of the strategies implemented was by adding coal and natural gas into the equation to ensure energy security.
Since then, the energy sector has evolved and now we are observing the rise of renewable energy (RE) in our system.
Our economy grew at a rate of 4.3% (2018: 4.7%), following a challenging economic environment and supply disruptions. Despite these challenges, the Malaysian economy managed to expand moderately.
Towards the end of 2019, the world was shaken by the widespread of the Coronavirus disease (COVID-19) pandemic. Economists projected a negative growth worldwide as countries battle with the pandemic and inevitable lockdown implementation which had push businesses to the brink of bankruptcy.
In 2019, the total primary energy supply increased by 2.9% (2018: 1.7%) and similarly, the total final energy consumption also increased by 2.8% (2018: 3.5%).
PRIMARY ENERGY SUPPLY
Primary energy supply marked an increase of 2.9% from the previous year’s level to register at 98,681 ktoe (2018:
95,909 ktoe). All fuels recorded an increase except for coal, where it showed a negative growth by 5.5%. This was due to lower imports of coal in 2019 compared to the previous year especially in Peninsular Malaysia.
Meanwhile in Sarawak, a fire accident which halted all operations at a power station during the second quarter of 2019 resulted in a lower coal supply for that year.
In terms of fuel share, the breakdown is almost similar to the previous year, where natural gas has the biggest share of 42.0%, followed by crude oil, petroleum products and others at 33.3%, coal and coke at 21.4%
and RE at 3.4%.
ENERGY TRANSFORMATION
Malaysia is blessed with ample energy resources such as oil and gas, therefore facilities have been built to transform these raw and crude primary energy sources into usable secondary energy sources. These secondary energy sources can be used locally or exported to other countries. In general, there are three (3) types of energy transformation facilities in the country, which are gas plants, oil refineries and power stations.
Generally, there are four (4) types of gas plants in Malaysia, namely Malaysia Liquified Natural Gas (MLNG) that transforms natural gas into Liquified Natural Gas (LNG), Gas Processing Plant – Liquified Petroleum Products (GPP-LPG) that transforms natural gas into Liquid Petroleum Gas (LPG), Middle Distillate Synthesis (MDS) plant that transforms natural gas into petroleum products and the Regasification Gas Terminal (RGT) that transforms LNG into natural gas.
The MLNG and FLNG produced a total of 27,802 ktoe of LNG and 30 ktoe of LPG which showed an increase of 7.2% from 2018. The MDS plant produced 425 ktoe of petroleum products where there was a reduction from 501 ktoe in the previous year. GPP-LPG and RGT plants both showed an increase in output production for 2019, registering at 2,107 ktoe and 1,954 ktoe respectively. As of 31 December 2019, Malaysia’s total refinery capacity is at 492 thousand barrels per day which excludes 74.3 thousand barrels per day of condensates splitter. 25,207 ktoe of crude oil was utilised in the refinery plant as feedstock to produce petroleum products such as petrol, diesel, kerosene, LPG, fuel oil, Aviation Turbine Fuel (ATF) & Aviation Gas (AV GAS), and other non-energy products. Out of the crude oil input, it produces secondary energy products with a total amount of 23,082 ktoe. The refinery input and output has slightly reduced compared to the previous year and this has to do with the demand of the product during that year. From the 23,082 ktoe total production, 36.8% is diesel, 23.0% is petrol, 16.1% is non-energy products, 15.0% is ATF & AV GAS, 6.0% is fuel oil, 2.4% is LPG while the
DATA COMPILATION
The first stage in compiling the overall energy balance is to rearrange the data to fit into a standard structure of commodity (or partial) balance. The commodity balance shows clearly the production, imports, exports, stock change and consumption for each energy commodity. The basic sequence adhered to in the overall balance is:-
Production + Imports - Exports +/- Stock Change = Apparent inland deliveries (or consumption)
In practice, however, “Apparent inland deliveries” deduced from supply statistics hardly ever match the actual sales data.
It is necessary, therefore, to include two “statistical discrepancies” - the first to account for the difference in apparent inland delivery of primary supply mainly due to the difficulties in obtaining the actual stock change data and difference in data compilation at source and the second is to account for the difference in secondary supply as the result of the transformation processes of one form of energy to another.
In addition, the statistical discrepancies also act as a balancing tool to minimise possible errors. In the case of oil and oil products, losses in transportation and distribution, as well as statistical errors are included in the statistical discrepancies. However, for electricity, distribution losses and the sector’s own use of electricity are accounted for under
“losses and own use”.
Stock changes are not fully accounted for in the balance. It is extremely difficult to obtain stocks of all energy commodities at the distributors’ and final users’ level. Only oil companies’ stocks are readily available, and these would include stocks at refineries and depots. The statistical discrepancy might thus also include unrecorded stock changes. Coal stocks at TNB power stations and at a producer in Sarawak are also considered in this report.
In summary, the flow of energy is represented by the following equations:-
Primary Energy Supply = Production + Imports - Exports - Bunkers +/- Stock Change
Energy Consumption = Gross inland consumption = Final energy consumption
+ Consumption of the energy transformation sector + Distribution losses
+ Non-energy consumption
ENERGY OVERVIEW
For decades, Malaysia has been self-sufficient where energy is concerned, and credit should be given to our Mother Nature for providing abundant natural resources in the country. The self-sufficiency rate is calculated by taking the ratio between the primary energy supply and final energy consumption. Although Malaysia have been heavily relying on oil for energy in the 90s, strategies were formulated to diversify the energy resources when the country was hit with the economic crisis in 1997. One of the strategies implemented was by adding coal and natural gas into the equation to ensure energy security.
Since then, the energy sector has evolved and now we are observing the rise of renewable energy (RE) in our system.
Our economy grew at a rate of 4.3% (2018: 4.7%), following a challenging economic environment and supply disruptions. Despite these challenges, the Malaysian economy managed to expand moderately.
Towards the end of 2019, the world was shaken by the widespread of the Coronavirus disease (COVID-19) pandemic. Economists projected a negative growth worldwide as countries battle with the pandemic and inevitable lockdown implementation which had push businesses to the brink of bankruptcy.
In 2019, the total primary energy supply increased by 2.9% (2018: 1.7%) and similarly, the total final energy consumption also increased by 2.8% (2018: 3.5%).
PRIMARY ENERGY SUPPLY
Primary energy supply marked an increase of 2.9% from the previous year’s level to register at 98,681 ktoe (2018:
95,909 ktoe). All fuels recorded an increase except for coal, where it showed a negative growth by 5.5%. This was due to lower imports of coal in 2019 compared to the previous year especially in Peninsular Malaysia.
Meanwhile in Sarawak, a fire accident which halted all operations at a power station during the second quarter of 2019 resulted in a lower coal supply for that year.
In terms of fuel share, the breakdown is almost similar to the previous year, where natural gas has the biggest share of 42.0%, followed by crude oil, petroleum products and others at 33.3%, coal and coke at 21.4%
and RE at 3.4%.
ENERGY TRANSFORMATION
Malaysia is blessed with ample energy resources such as oil and gas, therefore facilities have been built to transform these raw and crude primary energy sources into usable secondary energy sources. These secondary energy sources can be used locally or exported to other countries. In general, there are three (3) types of energy transformation facilities in the country, which are gas plants, oil refineries and power stations.
Generally, there are four (4) types of gas plants in Malaysia, namely Malaysia Liquified Natural Gas (MLNG) that transforms natural gas into Liquified Natural Gas (LNG), Gas Processing Plant – Liquified Petroleum Products (GPP-LPG) that transforms natural gas into Liquid Petroleum Gas (LPG), Middle Distillate Synthesis (MDS) plant that transforms natural gas into petroleum products and the Regasification Gas Terminal (RGT) that transforms LNG into natural gas.
The MLNG and FLNG produced a total of 27,802 ktoe of LNG and 30 ktoe of LPG which showed an increase of 7.2% from 2018. The MDS plant produced 425 ktoe of petroleum products where there was a reduction from 501 ktoe in the previous year. GPP-LPG and RGT plants both showed an increase in output production for 2019, registering at 2,107 ktoe and 1,954 ktoe respectively.
As of 31 December 2019, Malaysia’s total refinery capacity is at 492 thousand barrels per day which excludes 74.3 thousand barrels per day of condensates splitter. 25,207 ktoe of crude oil was utilised in the refinery plant as feedstock to produce petroleum products such as petrol, diesel, kerosene, LPG, fuel oil, Aviation Turbine Fuel (ATF) & Aviation Gas (AV GAS), and other non-energy products. Out of the crude oil input, it produces secondary energy products with a total amount of 23,082 ktoe. The refinery input and output has slightly reduced compared to the previous year and this has to do with the demand of the product during that year. From the 23,082 ktoe total production, 36.8% is diesel, 23.0% is petrol, 16.1% is non-energy products, 15.0% is ATF &
AV GAS, 6.0% is fuel oil, 2.4% is LPG while the The first stage in compiling the overall energy balance is to rearrange the data to fit into a standard structure of
commodity (or partial) balance. The commodity balance shows clearly the production, imports, exports, stock change and consumption for each energy commodity. The basic sequence adhered to in the overall balance is:-
Production + Imports - Exports +/- Stock Change = Apparent inland deliveries (or consumption)
In practice, however, “Apparent inland deliveries” deduced from supply statistics hardly ever match the actual sales data.
It is necessary, therefore, to include two “statistical discrepancies” - the first to account for the difference in apparent inland delivery of primary supply mainly due to the difficulties in obtaining the actual stock change data and difference in data compilation at source and the second is to account for the difference in secondary supply as the result of the transformation processes of one form of energy to another.
In addition, the statistical discrepancies also act as a balancing tool to minimise possible errors. In the case of oil and oil products, losses in transportation and distribution, as well as statistical errors are included in the statistical discrepancies. However, for electricity, distribution losses and the sector’s own use of electricity are accounted for under
“losses and own use”.
Stock changes are not fully accounted for in the balance. It is extremely difficult to obtain stocks of all energy commodities at the distributors’ and final users’ level. Only oil companies’ stocks are readily available, and these would include stocks at refineries and depots. The statistical discrepancy might thus also include unrecorded stock changes. Coal stocks at TNB power stations and at a producer in Sarawak are also considered in this report.
In summary, the flow of energy is represented by the following equations:-
Primary Energy Supply = Production + Imports - Exports - Bunkers +/- Stock Change
Energy Consumption = Gross inland consumption = Final energy consumption
+ Consumption of the energy transformation sector + Distribution losses
+ Non-energy consumption
ELECTRICITY
Total installed capacity in Malaysia for 2019 was 36,121 MW. Natural gas and coal dominate the chart making up three-quarters of the total installed capacity in Malaysia.
RE capacity totalled up to 21.5% with its energy capacity increased by 2.3% from the previous year. This is a good indication of achieving our national target of 31% RE in the capacity mix by 2025. To reach this target, we have ramped up our solar capacity with the launch of Large Scale Solar (LSS) 2.0 as well as Net Energy Metering (NEM) 2.0 with the quota uptake of 500 MW. From the total installed capacity, 78.4% is in Peninsular Malaysia, 15.8% is in Sarawak and the remaining 5.8% is in Sabah.
The peak demand, a point when the electricity consumption is at its highest at a time of a day, was recorded at 18,566 MW in Peninsular Malaysia which showed a 1.2% increase compared to 18,338 MW in 2018. In Sabah, the peak demand rose by 4.8% (955 MW to 1,001 MW) and in Sarawak, the peak demand rose by 7.8% (3,504 MW to 3,777 MW).
The total electricity generation (excluding self-generation plants) in 2019 was recorded at 171,672 GWh, an increase of 5.1% from 2018 level which was at 163,366 GWh. Coal remained the most used fuel to generate electricity with a total of 44.5% in the generation mix.
This was followed by natural gas at 38.6%, hydropower at 15.3%, renewables at 1.2% and oil at 0.5%. The total electricity consumption stood at 158,603 GWh in 2019, which showed an increase by 3.8% from the 2018 level.
From the total electricity consumption, Peninsular Malaysia tops the list at 79.0%, followed by Sarawak at 17.3% and Sabah at 3.8%. Almost half of Malaysia’s total electricity consumption was taken up by the industry sector at 49.4% or 78,427 GWh. The commercial sector consumed 28.8% of total electricity consumption while the residential sector consumed 21.0%. Out of the total consumption, the agriculture and transport sectors
FINAL ENERGY CONSUMPTION
In 2019, the total energy consumption was reported to be 66,483 ktoe, an increase by 2.8% from the previous year. Only the agriculture and industry sectors showed a downward trend in consumption whereas the other sectors showed an increase. The transportation sector posted the highest growth of 6.1% due to the higher growth of petrol and diesel at 6.4% and 4.3%
respectively. This was in line with the increment of new passenger vehicles registered in Malaysia by 3.2% in 2019. The agriculture and industry sectors’ consumption reduced slightly from the previous year by 9.2% and 0.7% respectively. In terms of share, the industry and transport sectors still dominate, constituting almost three-quarters of the total energy consumption in 2019.
This is followed by the non-energy sector, commercial, residential and agriculture sectors with their share of 20.5%, 7.0%, 5.0% and 1.4% respectively.
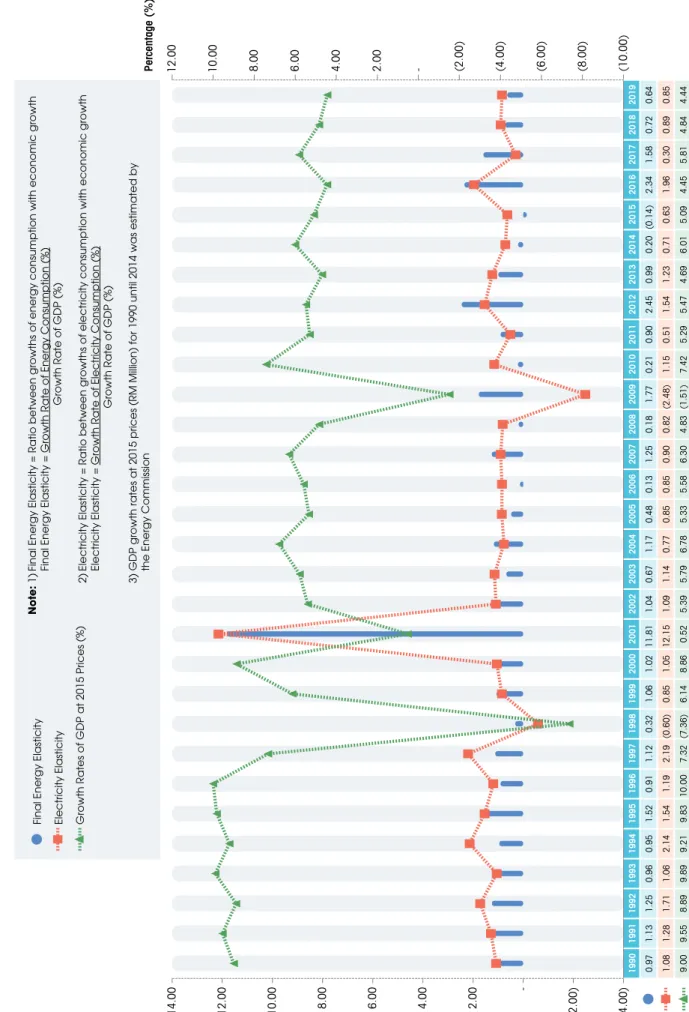
Malaysia’s final energy consumption per capita increased by 2.4% to settle at 2.04 toe per capita as compared to 2.00 toe per capita in 2018. However, the final energy intensity dropped from 47.41 toe/RM Million to 46.68 toe/RM Million. Electricity intensity also decreased at a rate of 0.9% from 0.112 GWh/RM Million to 0.111 GWh/RM Million, which indicates an improvement in efficiency. In 2019, better indication of elasticity is observed in the final energy with a value of 0.64, while electricity shows a value of 0.85.
CONCLUSION
Overall, Malaysia performed adequately well despite all the headwinds affecting the country’s economic growth.
The Coronavirus disease (COVID-19) pandemic is
expected to continue to affect the economy and as long as
herd immunity is not achieved through the country’s
vaccination programme, it will be challenging for the
economy to bounce back to its usual rate. The energy
sector is the backbone of a country, and with the
economic landscape getting more demanding each year,
it is vital that the energy sector promotes stability and has
a mechanism that can cushion the impact of any
disruptions such as the Coronavirus disease (COVID-19)
pandemic. More RE capacity is expected as the
Government ramps up its effort to achieve the national
target of 31% in the capacity mix by 2025.
KEY ECONOMIC AND ENERGY DATA
ELECTRICITY
Total installed capacity in Malaysia for 2019 was 36,121 MW. Natural gas and coal dominate the chart making up three-quarters of the total installed capacity in Malaysia.
RE capacity totalled up to 21.5% with its energy capacity increased by 2.3% from the previous year. This is a good indication of achieving our national target of 31% RE in the capacity mix by 2025. To reach this target, we have ramped up our solar capacity with the launch of Large Scale Solar (LSS) 2.0 as well as Net Energy Metering (NEM) 2.0 with the quota uptake of 500 MW. From the total installed capacity, 78.4% is in Peninsular Malaysia, 15.8% is in Sarawak and the remaining 5.8% is in Sabah.
The peak demand, a point when the electricity consumption is at its highest at a time of a day, was recorded at 18,566 MW in Peninsular Malaysia which showed a 1.2% increase compared to 18,338 MW in 2018. In Sabah, the peak demand rose by 4.8% (955 MW to 1,001 MW) and in Sarawak, the peak demand rose by 7.8% (3,504 MW to 3,777 MW).
The total electricity generation (excluding self-generation plants) in 2019 was recorded at 171,672 GWh, an increase of 5.1% from 2018 level which was at 163,366 GWh. Coal remained the most used fuel to generate electricity with a total of 44.5% in the generation mix.
This was followed by natural gas at 38.6%, hydropower at 15.3%, renewables at 1.2% and oil at 0.5%. The total electricity consumption stood at 158,603 GWh in 2019, which showed an increase by 3.8% from the 2018 level.
From the total electricity consumption, Peninsular Malaysia tops the list at 79.0%, followed by Sarawak at 17.3% and Sabah at 3.8%. Almost half of Malaysia’s total electricity consumption was taken up by the industry sector at 49.4% or 78,427 GWh. The commercial sector consumed 28.8% of total electricity consumption while the residential sector consumed 21.0%. Out of the total consumption, the agriculture and transport sectors
FINAL ENERGY CONSUMPTION
In 2019, the total energy consumption was reported to be 66,483 ktoe, an increase by 2.8% from the previous year. Only the agriculture and industry sectors showed a downward trend in consumption whereas the other sectors showed an increase. The transportation sector posted the highest growth of 6.1% due to the higher growth of petrol and diesel at 6.4% and 4.3%
respectively. This was in line with the increment of new passenger vehicles registered in Malaysia by 3.2% in 2019. The agriculture and industry sectors’ consumption reduced slightly from the previous year by 9.2% and 0.7% respectively. In terms of share, the industry and transport sectors still dominate, constituting almost three-quarters of the total energy consumption in 2019.
This is followed by the non-energy sector, commercial, residential and agriculture sectors with their share of 20.5%, 7.0%, 5.0% and 1.4% respectively.
Malaysia’s final energy consumption per capita increased by 2.4% to settle at 2.04 toe per capita as compared to 2.00 toe per capita in 2018. However, the final energy intensity dropped from 47.41 toe/RM Million to 46.68 toe/RM Million. Electricity intensity also decreased at a rate of 0.9% from 0.112 GWh/RM Million to 0.111 GWh/RM Million, which indicates an improvement in efficiency. In 2019, better indication of elasticity is observed in the final energy with a value of 0.64, while electricity shows a value of 0.85.
CONCLUSION
Overall, Malaysia performed adequately well despite all the headwinds affecting the country’s economic growth.
The Coronavirus disease (COVID-19) pandemic is
expected to continue to affect the economy and as long as
herd immunity is not achieved through the country’s
vaccination programme, it will be challenging for the
economy to bounce back to its usual rate. The energy
sector is the backbone of a country, and with the
economic landscape getting more demanding each year,
it is vital that the energy sector promotes stability and has
a mechanism that can cushion the impact of any
disruptions such as the Coronavirus disease (COVID-19)
pandemic. More RE capacity is expected as the
Government ramps up its effort to achieve the national
target of 31% in the capacity mix by 2025.
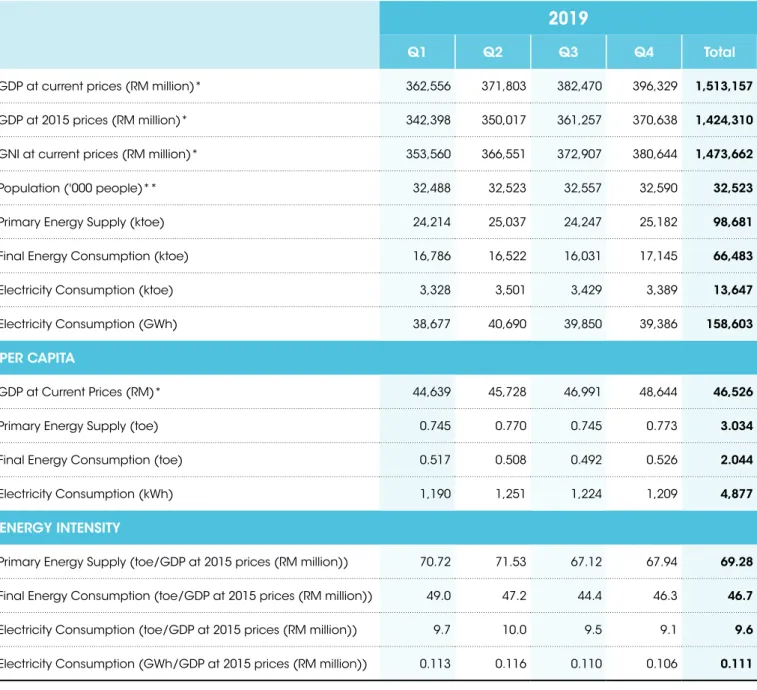
2019
Q1 Q2 Q3 Q4 Total
GDP at current prices (RM million)* 362,556 371,803 382,470 396,329 1,513,157
GDP at 2015 prices (RM million)* 342,398 350,017 361,257 370,638 1,424,310
GNI at current prices (RM million)* 353,560 366,551 372,907 380,644 1,473,662
Population ('000 people)** 32,488 32,523 32,557 32,590 32,523
Primary Energy Supply (ktoe) 24,214 25,037 24,247 25,182 98,681
Final Energy Consumption (ktoe) 16,786 16,522 16,031 17,145 66,483
Electricity Consumption (ktoe) 3,328 3,501 3,429 3,389 13,647
Electricity Consumption (GWh) 38,677 40,690 39,850 39,386 158,603
PER CAPITA
GDP at Current Prices (RM)* 44,639 45,728 46,991 48,644 46,526
Primary Energy Supply (toe) 0.745 0.770 0.745 0.773 3.034
Final Energy Consumption (toe) 0.517 0.508 0.492 0.526 2.044
Electricity Consumption (kWh) 1,190 1,251 1,224 1,209 4,877 ENERGY INTENSITY
Primary Energy Supply (toe/GDP at 2015 prices (RM million)) 70.72 71.53 67.12 67.94 69.28
Final Energy Consumption (toe/GDP at 2015 prices (RM million)) 49.0 47.2 44.4 46.3 46.7
Electricity Consumption (toe/GDP at 2015 prices (RM million)) 9.7 10.0 9.5 9.1 9.6
Electricity Consumption (GWh/GDP at 2015 prices (RM million)) 0.113 0.116 0.110 0.106 0.111
Note (*): Quarterly data from the Department of Statistics Malaysia (**): Mid-year population from the Department of Statistics Malaysia
TABLE 1: KEY ECONOMIC AND ENERGY DATA
PENINSULAR
MALAYSIA 2010 2011 2012 2013 2014 2015 2016 2017 2018 2019
GDP at Current Prices
(RM million)* 684,057 751,734 806,569 849,891 925,232 975,581 1,038,585 1,131,602 1,193,129 1,254,361 GDP at 2015
Prices
(RM million)* 744,624 784,737 833,245 873,486 928,517 975,581 1,020,869 1,080,017 1,137,581 1,192,112 Population
('000 people)** 22,753 23,099 23,417 23,868 24,281 24,669 24,995 25,303 25,593 25,713 Final Energy
Consumption
(ktoe) 35,593 35,968 36,683 41,859 42,470 43,011 45,872 46,520 47,446 48,085
Electricity Consumption
(ktoe) 8,145 8,427 8,791 9,108 9,315 9,531 10,026 10,004 10,378 10,776
Electricity Consumption
(GWh) 94,666 97,939 102,174 105,861 108,259 110,770 116,529 116,272 120,617 125,238
PER CAPITA GDP at Current
Prices (RM)* 30,064 32,544 34,444 35,608 38,105 39,547 41,551 44,722 46,619 48,783
Final Energy Consumption
(toe) 1.564 1.557 1.567 1.754 1.749 1.744 1.835 1.839 1.854 1.870
Electricity Consumption
(kWh) 4,161 4,240 4,363 4,435 4,459 4,490 4,662 4,595 4,713 4,871 ENERGY INTENSITY
Final Energy Consumption (toe/GDP at 2015 prices (RM million))
47.8 45.8 44.0 47.9 45.7 44.1 44.9 43.1 41.7 40.3
Electricity Consumption (toe/GDP at 2015 prices (RM million))
10.9 10.7 10.6 10.4 10.0 9.8 9.8 9.3 9.1 9.0
Electricity Consumption (GWh/GDP at 2015 prices (RM million))
0.127 0.125 0.123 0.121 0.117 0.114 0.114 0.108 0.106 0.105
Note (*): 1. GDP data by States from the Department of Statistics Malaysia
2. GDP for Peninsular Malaysia includes Supra State (Supra State covers production activities that beyond the centre of predominant economic interest for any state)
3. GDP data by States from 2010 until 2014 were estimated by the Energy Commission (**): 1. Mid-year population from the Department of Statistics Malaysia
Sabah 2010 2011 2012 2013 2014 2015 2016 2017 2018 2019 GDP at Current
Prices
(RM million)* 62,043 70,269 71,958 72,981 78,258 79,775 86,924 101,904 108,058 106,607 GDP at 2015
prices
(RM million)* 64,926 66,693 69,014 71,531 75,093 79,775 83,930 90,583 92,253 93,063
Population
('000 people)** 3,348 3,435 3,523 3,703 3,764 3,816 3,900 3,954 3,997 4,004 Final Energy
Consumption
(ktoe) 2,758 3,466 4,671 4,097 4,128 3,845 5,015 9,512 6,598 6,561
Electricity Consumption
(ktoe) 355 368 425 439 423 499 487 477 484 514 Electricity
Consumption
(GWh) 4,127 4,275 4,943 5,097 4,919 5,805 5,665 5,545 5,630 5,979
PER CAPITA GDP at Current
Prices (RM)* 18,530 20,457 20,424 19,709 20,793 20,908 22,291 25,776 27,032 26,627 Final Energy
Consumption
(toe) 0.824 1.009 1.326 1.106 1.097 1.008 1.286 2.406 1.651 1.639
Electricity Consumption
(kWh) 1,233 1,245 1,403 1,377 1,307 1,521 1,453 1,402 1,408 1,493 ENERGY INTENSITY
Final Energy Consumption (toe/GDP at 2015 prices (RM million))
42.5 52.0 67.7 57.3 55.0 48.2 59.8 105.0 71.5 70.5
Electricity Consumption (toe/GDP at 2015 prices (RM million))
5.5 5.5 6.2 6.1 5.6 6.3 5.8 5.3 5.3 5.5
Electricity Consumption (GWh/GDP at 2015 prices (RM million))
0.064 0.064 0.072 0.071 0.066 0.073 0.067 0.061 0.061 0.064
Note (*): 1. GDP data by States from the Department of Statistics Malaysia 2. GDP and population for Sabah includes WP Labuan
3. GDP data by States from 2010 until 2014 were estimated by the Energy Commission (**): 1. Mid-year population from the Department of Statistics Malaysia
Sarawak 2010 2011 2012 2013 2014 2015 2016 2017 2018 2019 GDP at Current
Prices
(RM million)* 88,935 104,840 108,833 112,650 121,323 121,585 124,189 138,804 146,264 149,724 GDP at 2015
prices
(RM million)* 99,653 106,023 107,524 112,186 117,070 121,585 124,513 130,169 132,981 136,279 Population
('000 people)** 2,487 2,528 2,570 2,643 2,664 2,702 2,739 2,766 2,792 2,806 Final Energy
Consumption
(ktoe) 3,125 4,086 5,358 5,628 5,612 4,951 6,331 6,458 10,614 11,838 Electricity
Consumption
(ktoe) 493 445 795 1,043 1,304 1,344 1,878 2,126 2,290 2,356 Electricity
Consumption
(GWh) 5,730 5,172 9,237 12,118 15,152 15,624 21,831 24,703 26,618 27,386 PER CAPITA
GDP at Current
Prices (RM)* 40,068 41,941 41,843 42,455 43,945 45,007 45,464 47,055 47,634 48,567 Final Energy
Consumption
(toe) 1.256 1.616 2.085 2.130 2.106 1.833 2.312 2.335 3.802 4.219 Electricity
Consumption
(kWh) 2,304 2,046 3,594 4,586 5,688 5,784 7,971 8,930 9,535 9,760 ENERGY INTENSITY
Final Energy Consumption (toe/GDP at 2015 prices (RM million))
31.4 38.5 49.8 50.2 47.9 40.7 50.8 49.6 79.8 86.9
Electricity Consumption (toe/GDP at 2015 prices (RM million))
4.9 4.2 7.4 9.3 11.1 11.1 15.1 16.3 17.2 17.3
Electricity Consumption (GWh/GDP at 2015 prices (RM million))
0.057 0.049 0.086 0.108 0.129 0.129 0.175 0.190 0.200 0.201
Note (*): 1. GDP data by States from the Department of Statistics Malaysia
2. GDP data by States from 2010 until 2014 were estimated by the Energy Commission (**): 1. Mid-year population from the Department of Statistics Malaysia
-
200,000
400,000
600,000
800,000
1,000,000
1,200,000
1,400,000
1,600,000 - 20,000 40,000 60,000 80,000 100,000
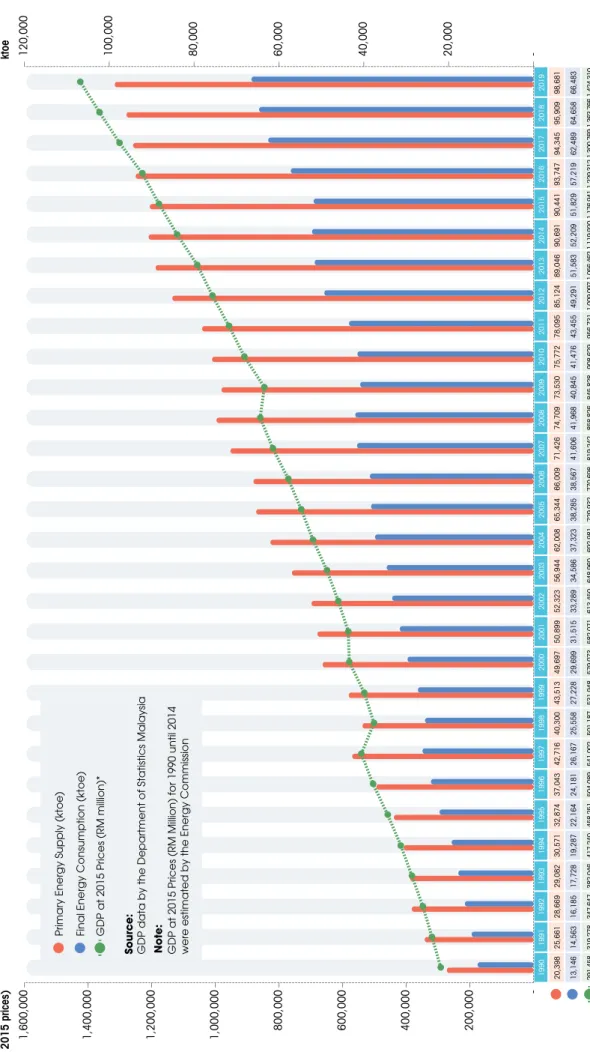
120,000ktoeRM Million (at 2015 prices) 199019911992199319941995199619971998199920002001200220032004200520062007200820092010201120122013201420152016201720182019 20,39825,66128,66929,08230,57132,87437,04342,71640,30043,51349,69750,89952,32356,94462,00865,34466,00971,42674,70973,53075,77278,09585,12489,04690,69190,44193,74794,34595,90998,681 13,14614,56316,18517,72819,28722,16424,18126,16725,55827,22829,69931,51533,28934,58637,32338,28538,56741,60641,96840,84541,47643,45549,29151,58352,20951,82957,21962,48964,65866,483 291,458319,278347,647382,046417,240458,251504,089541,002501,187531,948579,073582,071613,450648,960692,981729,932770,698819,242858,826845,828908,629956,7311,009,0971,056,4621,119,9201,176,9411,229,3121,300,7691,363,7661,424,310
Source: GDP data by the Department of Statistics Malaysia Note: GDP at 2015 Prices (RM Million) for 1990 until 2014 were estimated by the Energy Commission
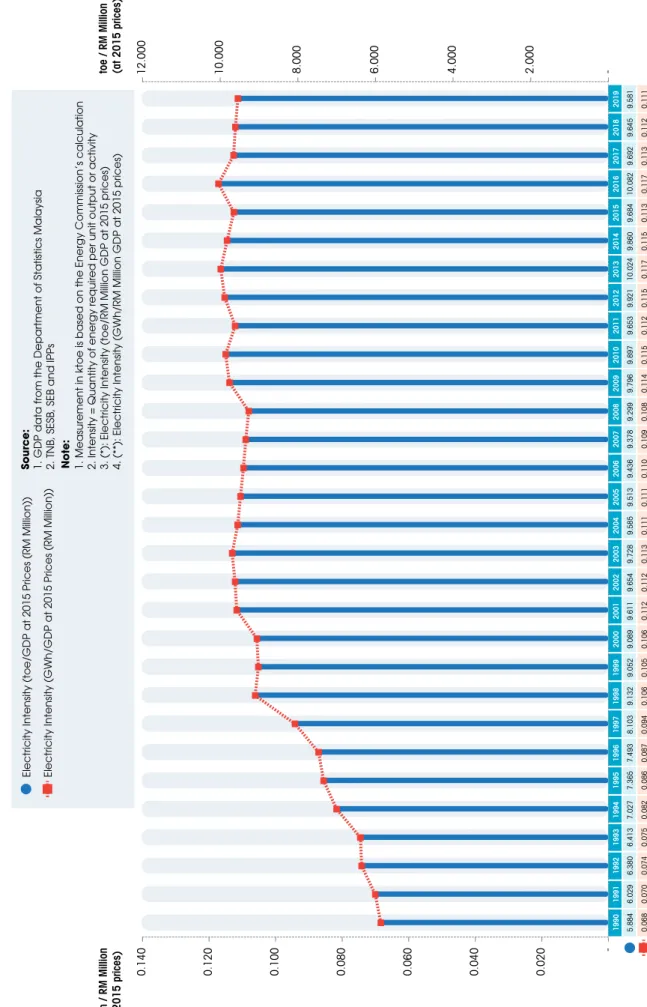
Primary Energy Supply (ktoe) Final Energy Consumption (ktoe) GDP at 2015 Prices (RM million)* 199019911992199319941995199619971998199920002001200220032004200520062007200820092010201120122013201420152016201720182019 1,1011,2061,3521,4531,6921,8972,0682,3412,3822,4432,6032,7052,8042,9303,0223,0993,1833,3003,3673,4293,6563,6933,9434,0744,1794,2484,5534,5764,7214,877 1.131.381.501.481.521.591.751.961.801.902.122.122.132.272.432.512.492.642.712.622.652.692.882.952.952.902.962.952.963.03 0.730.790.850.900.961.071.141.201.141.191.261.311.361.381.461.471.451.541.521.451.451.501.671.711.701.661.811.952.002.04
-
500
1,000
1,500
2,000
2,500
3,000
3,500
4,000
4,500
5,000 -
0.50
1.00
1.50
2.00
2.50
3.00
3.50
kWh toe Source: Population data from the Department of Statistics Malaysia Note: Based on the Energy Commission’s calculation
Electricity Consumption (kWh) Primary Energy Supply (toe) Final Energy Consumption (toe)
FIGURE 1: TRENDS IN GDP , PRIMAR Y ENERGY SUPPL Y AND FINAL ENERGY CONSUMPTION
-
200,000
400,000
600,000
800,000
1,000,000
1,200,000
1,400,000
1,600,000 - 20,000 40,000 60,000 80,000 100,000
120,000ktoeRM Million (at 2015 prices) 199019911992199319941995199619971998199920002001200220032004200520062007200820092010201120122013201420152016201720182019 20,39825,66128,66929,08230,57132,87437,04342,71640,30043,51349,69750,89952,32356,94462,00865,34466,00971,42674,70973,53075,77278,09585,12489,04690,69190,44193,74794,34595,90998,681 13,14614,56316,18517,72819,28722,16424,18126,16725,55827,22829,69931,51533,28934,58637,32338,28538,56741,60641,96840,84541,47643,45549,29151,58352,20951,82957,21962,48964,65866,483 291,458319,278347,647382,046417,240458,251504,089541,002501,187531,948579,073582,071613,450648,960692,981729,932770,698819,242858,826845,828908,629956,7311,009,0971,056,4621,119,9201,176,9411,229,3121,300,7691,363,7661,424,310
Source: GDP data by the Department of Statistics Malaysia Note: GDP at 2015 Prices (RM Million) for 1990 until 2014 were estimated by the Energy Commission
Primary Energy Supply (ktoe) Final Energy Consumption (ktoe) GDP at 2015 Prices (RM million)* 199019911992199319941995199619971998199920002001200220032004200520062007200820092010201120122013201420152016201720182019 1,1011,2061,3521,4531,6921,8972,0682,3412,3822,4432,6032,7052,8042,9303,0223,0993,1833,3003,3673,4293,6563,6933,9434,0744,1794,2484,5534,5764,7214,877 1.131.381.501.481.521.591.751.961.801.902.122.122.132.272.432.512.492.642.712.622.652.692.882.952.952.902.962.952.963.03 0.730.790.850.900.961.071.141.201.141.191.261.311.361.381.461.471.451.541.521.451.451.501.671.711.701.661.811.952.002.04
-
500
1,000
1,500
2,000
2,500
3,000
3,500
4,000
4,500
5,000 -
0.50
1.00
1.50
2.00
2.50
3.00
3.50
kWh toe Source: Population data from the Department of Statistics Malaysia Note: Based on the Energy Commission’s calculation
Electricity Consumption (kWh) Primary Energy Supply (toe) Final Energy Consumption (toe)
FIGURE 2: PRIMAR Y ENERGY SUPPL Y, ELECTRICITY CONSUMPTION AND FINAL ENERGY CONSUMPTION PER C APIT A
19901991199219931994199519961997199819992000200120022003200420052006200720082009201020112012201320142015201620172018