SURUHANJAYA TENAGA (ENERGY COMMISSION) No. 12, Jalan Tun Hussein, Precinct 2,
62100 Putrajaya, Malaysia.
T : (03) 8870 8500 F : (03) 8888 8637
NATIONAL
ENERGY
BALANCE
SURUHANJAYA TENAGA (ENERGY COMMISSION) No. 12, Jalan Tun Hussein, Precinct 2,
62100 Putrajaya, Malaysia.
T : (03) 8870 8500 F : (03) 8888 8637 W : www.st.gov.my
NATIONAL
ENERGY
BALANCE
SURUHANJAYA TENAGA (ENERGY COMMISSION) No. 12, Jalan Tun Hussein, Precinct 2,
62100 Putrajaya, Malaysia.
T : (03)8870 8500
NATIONAL ENERGY BALANCE
SURUHANJAYA TENAGA (ENERGY COMMISSION) No. 12, Jalan Tun Hussein, Precinct 2,
62100 Putrajaya, Malaysia.
T : (03) 8870 8500 F : (03) 8888 8637 W : www.st.gov.my
NATIONAL
ENERGY
BALANCE
The data and information contained in this yearly publication is prepared and provided for general information purposes only. While the Energy Commission made reasonable efforts to ensure that the information contained in this publication is accurate, the Energy Commission shall not have any liability (whether arising from negligence, negligent misstatement, or otherwise) for any statements, opinions, information or matter (expressed or implied) arising out of, contained in or derived from, or for any omissions from, the information in this publication, or in respect of a person’s use of the information (including any reliance on its currency, accuracy, reliability or completeness) contained in this publication.
© All rights reserved. Reproduction of all or any part of this publication via electronic, mechanical, recording or other medium is strictly prohibited without written consent from the Energy Commission.
PUBLISHED BY:
SURUHANJAYA TENAGA (ENERGY COMMISSION)
No. 12, Jalan Tun Hussein, Precinct 2, 62100 Putrajaya, Malaysia Tel: (03)8870 8500 Fax: (03)8888 8637
Toll Free Number: 1 – 800 – 2222 – 78 (ST) www.st.gov.my
https://meih.st.gov.my ISSN NO.: 0128 – 6323 ST(P) 1/06/2020
PRINTED IN MALAYSIA
SURUHANJAYA TENAGA (ENERGY COMMISSION) No. 12, Jalan Tun Hussein, Precinct 2,
62100 Putrajaya, Malaysia.
NATIONAL
ENERGY
BALANCE
TABLE OF CONTENTS
5 PREFACE
6 INTRODUCTION 7 DATA COMPILATION 8 EXECUTIVE SUMMARY
12 13 16
17
18 19
20 21 22 23 24 25
26 27
Table 1: Key Economic and Energy Data
Table 2: Key Economic and Energy Data by Region
Figure 1: Trends in GDP, Primary Energy Supply and Final Energy Consumption Figure 2: Primary Energy Supply,
Electricity Consumption and Final Energy Consumption per Capita Figure 3: Trends in GDP and
Electricity Consumption Figure 4: Annual Growth Rates
of GDP, Primary Energy Supply, Final Energy Consumption and Electricity Consumption Figure 5: Primary and Final Energy
Intensity
Figure 6: Electricity Intensity Figure 7: Final Energy and
Electricity Elasticity Figure 8: Primary Energy Supply Figure 9: Final Energy Consumption
by Sectors Figure 10: Final Energy
Consumption by Fuel Type
Figure 11: Official Selling Prices of Malaysian Crude Oil Figure 12: Ex-Singapore Prices
of Major Petroleum Products
34 34 34
35 36 37 38
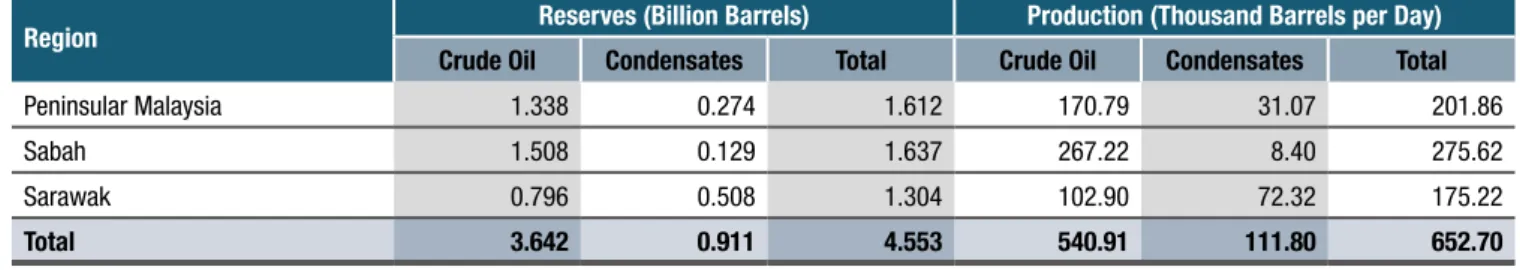
Table 3: Resources and Production of Oil as of 1 January, 2018 Table 4: Refinery Licensed Capacity,
2018
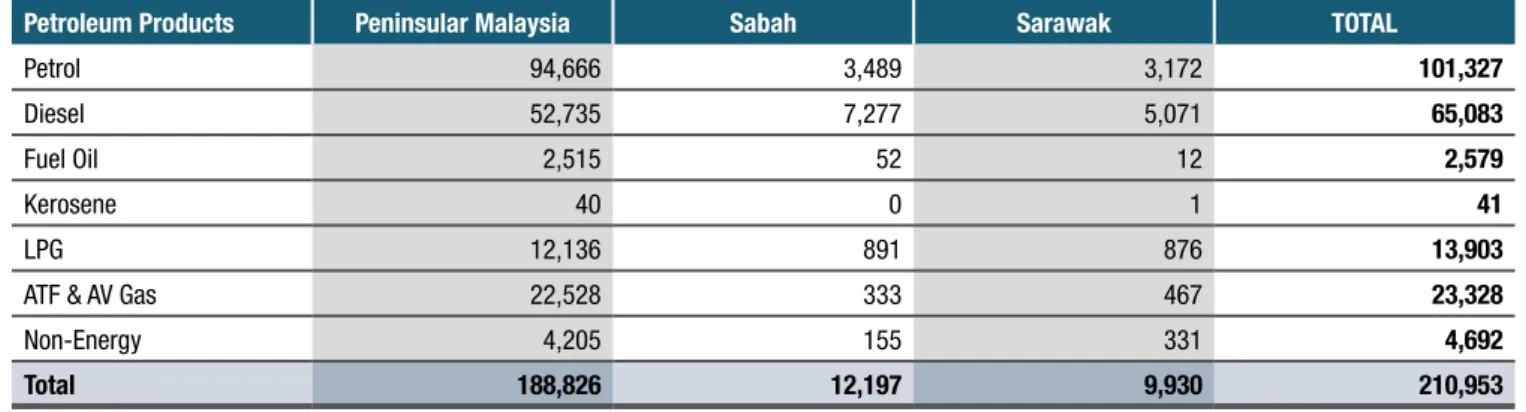
Table 5: Breakdown on Sales of Petroleum Products in Thousand Barrels, 2018 Figure 17: Net Export of Crude Oil Figure 18: Export and Import of
Petroleum Products Figure 19: Production of Petroleum
Products from Refineries Figure 20: Final Consumption for
2829 30
31
Figure 13: Annual Liquefied Petroleum Gas (LPG) Contract Prices – Arab Gulf
Figure 14: Average Annual Prices of Natural Gas in Malaysia Figure 15: Final Energy
Consumption per Capita in ASEAN
Figure 16: Final Energy Intensity in ASEAN
40
40 41 42 43
Table 6: Resources and Production of Natural Gas as of 1 January, 2018 Table 7: Consumption of Natural
Gas in MMscf, 2018 Figure 21: Export and Import of
Piped Natural Gas and LNG
Figure 22: Natural Gas Consumption by Sector
Figure 23: Conversion in Gas Plants
46
46 47 48
Table 8: Resources and Production of Coal as of
31 December, 2018 Table 9: Consumption of Coal in
Metric Tonnes, 2018 Figure 24: Net Import of Coal Figure 25: Coal Consumption by
Sector
OIL COAL
NATURAL KEY GAS
ECONOMIC
AND ENERGY
DATA
76 ENERGY FLOW CHART NOTES OF ENERGY
BALANCE
81 CONVERSION
COEFFICIENTS AND EQUIVALENCE
50
50 51
51 52
Table 10: Installed Capacity as of 31 December 2018, in MW Figure 26: Installed Capacity as of
31 December, 2018 Table 11: Available Capacity as of
31 December 2018, in MW
Figure 27: Available Capacity as of 31 December, 2018 Table 12: Installed Capacity of Major
Hydro Power Stations, 2018
62 63 64 65 66
Table 20: Primary Energy Supply in ktoe
Table 21: Net Import and Export of Energy in ktoe
Table 22: Conversion in Gas Plants in ktoe
Table 23: Conversion in Refineries in ktoe
Table 24: Conversion in Power Stations (exclude co-
67 68 69
70
Table 25: Final Energy Consumption by Sector in ktoe
Table 26: Final Energy Consumption by Fuel Type in ktoe Table 27: Final Consumption for
Petroleum Products in ktoe
Table 28: Selected Energy and Economic Indicators (1990-2018)
78 79 79 80 80
Energy Balance Format Notes on Electricity Notes on Coal Notes on GDP Notes on GNI 53
54 54 54
55
Table 13: Installed Capacity of Mini Hydro Power Stations, 2018
Table 14: Transmission Network in Circuit – kilometres, 2018 Table 15: Distribution Network in
Circuit – kilometres, 2018 Table 16: Gross Generation,
Consumption, Available Capacity, Peak Demand and Reserve Margin for Electricity in Malaysia, 2018
Figure 28: Energy Input in Power Stations, 2018
55 56 56 57 58
59
Figure 29: Generation Mix by Fuel Type, 2018
Table 17: Electricity Consumption by Sector in GWh, 2018 Figure 30: Electricity Consumption
by Sector, 2018 Figure 31: Electricity Consumption
by Sector
Table 18: Electricity Generation and Installed Capacity of Renewable Energy by Public Licensees by Region in 2018 Table 19: Electricity Generation
and Installed Capacity of Renewable Energy by Private Licensees by Region in 2018
ENERGY KEY
STATISTICS
ELECTRICITY
PREFACE
The year 2018 is what would be considered as the year of unprecedented changes. Nevertheless, our economy remained resilient; it expanded at a more moderate pace, is supported by strong fundamentals and policy flexibility. The energy sector’s performance remained strong and we are able to maintain the security and reliability of energy supply. As a regulator of the electricity and piped gas supply industry, the Commission strives to strike a balance between the consumers and providers of energy to ensure safe and reliable supply at reasonable prices.
National Energy Balance (NEB) is the official energy data in Malaysia. It is an important document, as reliable and timely monitoring of the supply and consumption of energy becomes indispensable for sound decision-making. The basic concept behind the NEB is that the energy flow within the country for any particular year have to be such that ‘Energy Supply’ is always equal to ‘Energy Consumption’. From this publication, we can see Malaysia’s energy structure from production until consumption, covering all types of energy that is available in the country, including primary energy and secondary energy. The period covered is from 1990 until 2018.
In 2018, there were various trends emerging with the advancement of technology. There were big talks on Industry 4.0 and Internet of Things (IoT) and how the energy sector could adapt to these changes. Digitalisation and Artificial Intelligence (AI) will be the future and Malaysia should not be left behind in applying them. The energy sector for one, should be more innovative in integrating these technologies. With these technologies in place the efficiency of resources will be greatly improved.
Energy market liberalisation is also one of the main agenda in the Malaysian energy sector. This is one of the key characteristics of a world-class energy regulator, and this is in line with the Commission’s vision. The energy sector has shown positive progress in opening up the market with the Third Party Access (TPA) framework, New Enhanced Despatch Arrangement (NEDA), implementation of subsidy rationalisation, utility accounts unbundling, generation capacity competitive bidding, and ringfencing of Single Buyer and Grid System Operator. Opening the electricity market fully from generation to distribution is the ideal, however, it will require a lot of studies and time to ensure that a balance is struck for both the suppliers and consumers.
In Southeast Asia, the potential of Renewable Energy (RE) is not as big as countries in Europe where they could have more than 60% of RE in their energy mix.
However, Malaysia’s geologically strategic position near the equator gives us vast opportunities for solar power. In Malaysia, we have integrated solar in most sectors, including the domestic, industry, commercial and who knows, soon our cars will be using solar PV panels. Besides that, we also have big potential for hydro power in the region of Sarawak, and consequently, the excess can be converted into hydrogen fuel.
I would like to express my heartfelt gratitude to the Honourable Minister and the Ministry of Energy and Natural Resources for their guidance and support for the annual publication of the NEB. I strongly believe that this publication will serve as a useful guide for policy makers and authorities to shape our energy industry to becoming world class. My sincere appreciation also goes out to our stakeholders for their contributions and we look forward to more collaborative efforts in the future.
Thank you.
Dato’ Azian bin Osman
Chairman
Energy Commission
INTRODUCTION
Renewable energy (RE) is now one of the main agenda in the country to reduce dependency on fossil fuels as well as to conserve the environment for climate change.
Currently, our RE mix (including large hydro) is at 22.9%
and is projected to increase further with initiatives led by the Government, including Feed in Tariff (FiT), Net Energy Metering (NEM) and Large-Scale Solar (LSS). Existing policies on RE in Malaysia need to be supported not only by the Government but also by the private sector.
Attractive and user-friendly mechanism of financing RE projects will be one of the main talking points in this area.
Energy efficiency will also play a vital role to combat climate change as many potential energy saving measures can be adopted in Malaysia. The Government of Malaysia is at the final stage of drafting the Energy Efficiency and Conservation Act (EECA) bill. This act will be instrumental for the mandatory implementation of energy efficiency initiatives, so that an improvement in energy intensity can be expected in the long run.
From time to time, we try to improve the quality of our energy data which includes a wider coverage, better segregation of fuel and sectors, and updating the NEB format based on the current energy development. Starting 2018, we have collected electricity consumption data for the road transport sector. Although the share of electric vehicles (EV) is still small at the moment, the values are expected to increase in the coming years.
On behalf of the Energy Commission, I would like to extend my sincere appreciation for all the contributions, cooperation and timely submission of data by the Government Agencies, oil and gas companies, public utilities, independent power producers (IPP), cement, iron and steel manufacturers and all relevant parties in making the production of NEB 2018 a reality. I hope that the NEB 2018 will serve its purpose by allowing its readers to further understand the trends and directions of our energy industry.
Thank you.
Abdul Razib bin Dawood
Chief Executive Officer Energy Commission
The Malaysian economy recorded slower growth rate of 4.8% in 2018 compared to the previous year at 5.8% due to global trade tensions and uncertainty of the economy. The change in policy focus, while imperative for long-term sustainability, entailed inevitable short-term economic growth trade- offs through lower public sector spending.
Malaysia continues to experience strong growth of energy supply and demand in 2018 despite the lower growth in economy. Total primary energy supply recorded an increase of 1.6% to settle at 99,873 ktoe. In tandem with economic growth, our final energy consumption continues to grow by 3.5% to register at 64,658 ktoe. Interestingly, our final energy consumption growth managed to remain below the Gross Domestic Product (GDP) growth rate. Final energy elasticity which is formulated as the growth rate of final energy consumption divided by the growth rate of GDP, was reported at 0.73 in 2018 compared to 1.58 in 2017. This indication showed that Malaysia managed to generate economy with less energy consumption.
DATA COMPILATION
The first stage in compiling the overall energy balance is to rearrange the data to fit into a standard structure of commodity (or partial) balance. The commodity balance shows clearly the production, imports, exports, stock change and consumption for each energy commodity. The basic sequence adhered to in the overall balance is: -
Production + Imports - Exports +/- Stock change = Apparent inland deliveries (or consumption)
In practice, however, “Apparent inland deliveries” deduced from supply statistics hardly ever match the actual sales data.
It is necessary, therefore, to include two “statistical discrepancies” - the first to account for the difference in apparent inland delivery of primary supply mainly due to the difficulties in obtaining the actual stock change data and difference in data compilation at source and the second is to account for the difference in secondary supply as the result of the transformation processes of one form of energy to another.
In addition, the statistical discrepancies also act as a balancing tool to minimise possible errors. In the case of oil and oil products, losses in transportation and distribution, as well as statistical errors are included in the statistical discrepancies.
However, for electricity, distribution losses and the sector’s own use of electricity are accounted for under “losses and own use”.
Stock changes are not fully accounted for in the balance because it is not possible to obtain accurate stock data of energy commodities at the distributors’ and users’ levels. Only oil companies’ stocks are readily available, and these would include stocks at refineries and depots. Therefore, the statistical discrepancy might also include unrecorded stock changes. Coal stocks at power stations and industry manufacturers are also considered in this report.
In summary, the flow of energy is represented by the following equations: -
Primary Energy Supply = Production + Imports - Exports - Bunkers +/- Stock change
Energy Consumption = Gross inland consumption
= Final energy consumption + Consumption of the energy transformation sector +
Distribution losses + Non-energy consumption
EXECUTIVE SUMMARY
PRIMARY ENERGY SUPPLY
Primary energy supply marked an increase of 1.6% from the 2017 level to register at 99,873 ktoe (2017: 98,298 ktoe). All fuels recorded an increase except for natural gas, as it dropped slightly by 0.6%. This was potentially due to the gas leak incident at Sabah-Sarawak Gas Pipeline (SSGP) located in Long Luping, Lawas, Sarawak on 10 January 2018. As a result of the incident, gas supply from the Sabah Oil and Gas Terminal (SOGT) to PETRONAS LNG Complex (PLC) in Bintulu has been stopped to ensure the safety of the incident site. Furthermore, the gross production of natural gas also experienced a downward trend of 4.1%. Coal and coke remained the biggest growth with 7.3%. Higher demand from the power sector had influenced the strong supply growth for coal and coke. Renewable Energy (RE) including large hydro registered an increase of 4.0% with larger output of hydro from Sarawak as well as more commissioning of RE projects under the Feed in Tariff (FiT), Net Energy Metering (NEM) and Large-Scale Solar (LSS) which was observed during 2018. Crude oil, petroleum products and others increased slightly to 29,429 ktoe or 0.2% (2017: 29,380 ktoe).
All the fuel shares in 2018 almost remain unchanged from 2017. Natural gas still dominates, with the share of 41.0%, followed by crude oil, petroleum products and others with 29.5%. The share of coal and coke increased to 22.3% (2017: 21.1%) and hydropower and renewable energy at 7.2% (2017: 7.1%).
ENERGY TRANSFORMATION
Malaysia is rich with energy resources such as oil and gas; hence we have the facilities that could transform the primary energy into secondary energy. Mainly, these secondary energy is consumed locally and exported to other countries. In general, there are three types of energy transformation process in the country and they are gas processing plants, oil refineries and power stations.
Generally, there are four types of gas processing plants in Malaysia, namely Malaysia Liquefied Natural Gas (MLNG) that transforms natural gas into Liquefied Natural Gas (LNG) for export purposes, Gas Processing Plant – Liquefied Petroleum Products (GPP-LPG) that transforms natural gas into Liquefied Petroleum Gas (LPG), Middle Distillate Synthesis (MDS) plant that transforms natural gas into petroleum products and Regasification Gas Terminal (RGT) that transforms LNG into natural gas. The MLNG output recorded a reduction of 8.9% from 2017 level to register at 25,920 ktoe due to lower supply of natural gas. MDS plants also showed a downtrend in terms of the output with negative growth of 1.0% to settle at 501 ktoe. However, the output from GPP-LPG plant increased by 3.3% and a higher LPG consumption by end-users was observed in 2018. The RGT supply into the country decreased by 23.1% to register at 1,383 ktoe.
As of 31 December 2018, Malaysia’s total refinery capacity is at 492,000 barrels per day excluding 74,300 barrels per day of condensates splitter. All of the oil refineries are located in Peninsular Malaysia. The total input of crude oil into the refineries was 25,533 ktoe, which declined by 6.2% from the previous year.
Majority of the crude oil input which constituted of 63.2% was locally sourced, while the remaining 36.8% was imported. The total output from oil refineries decreased by 9.4% to settle at 24,669 ktoe. Majority of the petroleum products share remained consistent from the previous year’s level with diesel and petrol representing 39.2% and 22.4% respectively. This was followed by Aviation Turbine Fuel (ATF) and Aviation (AV) Gas at 14.0%, non-energy products at 10.3%, fuel oil at 9.9%, LPG at 3.6%, refinery gas at 0.5% and kerosene at 0.1%.
ENERGY OVERVIEW
Malaysia is a sovereign nation that adopts the system with various races and religions living in harmony. Bountiful sources of energy such as oil, gas, hydro and biomass make Malaysia independent from external sources of energy. In fact, Malaysia is still considered as one of the major energy exporting countries in the world.
Following a robust growth in 2017, Malaysia’s economic growth was expected to normalise in 2018. The economy, however, was confronted with several external and domestic challenges during the year. Major policy and political shifts, arising partly from the global trade tensions and the historic change of government in Malaysia, became sources of uncertainty for the economy. Unanticipated supply disruptions in the commodity sectors adversely affected Malaysia’s economic performance, resulting in a larger-than- expected moderation in growth. Overall, the Malaysian economy recorded a respectable growth of 4.8% in 2018, demonstrating considerable resilience in the face of multiple headwinds.
The energy sector in 2018 showed lower growth rates compared to 2017, in tandem with lower growth rate of GDP. Total primary energy supply posted an increase of 1.6% to settle at 99,873 ktoe, while total final energy consumption growth was at 3.5% to register at 64,658 ktoe.
ELECTRICITY
Total installed capacity in Malaysia was 33,991 MW as of 31 December 2018.
Natural gas appeared as the biggest share with 43.7% followed by coal at 31.4%, hydro (major and mini) at 18.1%, diesel/MFO at 2.5%, solar power at 2.3%, biomass at 1.6%, biogas at 0.2%, and others at 0.2%. From the total installed capacity, 79.4% were in Peninsular Malaysia, while the rest were 15.0% in Sarawak and 5.6% in Sabah. The peak demand in Peninsular Malaysia was recorded at 18,338 MW on 15 August 2018, which was a 3.1% increase from 17,790 MW in 2017.
In Sabah, the peak demand rose by 1.8% (938 MW to 955 MW) and in Sarawak, the peak demand increased slightly by 0.4% from 3,489 MW to 3,504 MW. Peak demand is a point when the electricity consumption is at its highest, at a time of a day.
The types of power stations in Malaysia consist of hydro, thermal and self- generation plants. The total energy input in power stations (excluding self- generation) registered at 38,723 ktoe, an increase of 3.2% from the previous year.
Coal still dominates the fuel input in power stations with 52.9% followed by natural gas at 29.8%, hydropower at 16.1%, RE at 0.7% and the remaining 0.5% from oil. Total RE recorded a remarkable growth of 49.9% in 2018 compared to 2017 as more aggressive measures has been taken up to achieve the target of 20% of renewable energy capacity mix by 2025 set by the Government.
The total electricity generation (excluding self-generation) in 2018 was recorded at 163,415 GWh, an increase of 5.1% from 2017 level at 155,456 GWh. Coal remained as the highest fuel consumed to generate electricity with 47.3% of generation mix.
This was followed by natural gas at 35.7%, hydropower at 16.1%, renewables at 0.6% and oil at 0.3%. The total electricity consumption stood at 152,866 GWh in 2018, an increase by 4.3% from the 2017 level. From the total of electricity consumption, 78.9% of electricity was consumed in Peninsular Malaysia, followed by Sarawak at 17.4% and Sabah at 3.7%. Almost half of Malaysia’s total electricity was consumed by the industrial sector in 2018 at 49.8% or 76,096 GWh. The commercial sector consumed 29.0% of total electricity consumption while residential sector consumed 20.5%. Agriculture and transport sector consumed 0.4% and 0.3% of total electricity consumption, respectively.
FINAL ENERGY CONSUMPTION
In 2018, the total energy consumption was reported to be 64,658 ktoe, an increase by 3.5% from the previous year. All sectors showed an upward trend in 2018 except for the transport, residential and commercial sectors. The transport sector’s energy consumption declined by 2.0% to settle at 23,555 ktoe, while residential and commercial sector dropped to 7,773 ktoe. The agriculture sector (including fishery) recorded the highest growth with 51.5% followed by the industry sector which increased by 9.1% to settle at 19,046 ktoe. The non-energy sector which
uses energy as feedstock increased by 6.0% in 2018. The transport sector still dominates the share with 36.4%, followed by the industrial sector at 29.5%. 20.5% of total final energy consumption was consumed by non-energy use, 12.0% by residential and commercial and remaining 1.6% was consumed by the agriculture sector.
All fuel types recorded an increase in 2018 except for petroleum products, which declined by 1.3% to settle at 30,409 ktoe. The reduction was due to the lower petrol demand in the transport sector during the period. Natural gas consumption showed strong growth of 12.0% at 18,851 ktoe due to greater demand of natural gas for heating. Electricity consumption also recorded an increase with a growth of 4.3% to register at 13,153 ktoe. Final energy consumption of coal and coke increased slightly in 2018 at 0.2%
as demand for cement remained strong with more construction projects on site. Most of the coal and coke was consumed by cement manufacturers at 88.2% while the remaining 11.8% was consumed by iron and steel manufacturers.
Malaysia’s final energy consumption per capita increased by 2.3%
to settle at 2.0 toe per person. The final electricity consumption per capita followed suit, with a growth rate of 3.2% at 4,721 kWh per person in 2018. Improved efficiency was observed in 2018 as final energy intensity declined by 1.2% to register at 47.44 toe/
RM Million. Final electricity intensity also decreased by 0.4% to settle at 0.112 GWh/RM Million. As a result, Malaysia’s energy and electricity elasticity in 2018 were reported lower than 1.0 as our GDP growth rate is greater than energy and electricity consumption growth rates.
CONCLUSION
In 2018, Malaysia energy sector’s performance managed to continue its good momentum despite the political and economic uncertainties. Energy efficiency and RE became more significant as we try to strike a balance between the energy security, sustainability and equity or better known as the energy trilemma. Going forward, challenges will present itself, thus Malaysia needs to optimise its strength to overcome any shock or unwanted scenarios.
ECONOMIC KEY ENERGY AND
DATA
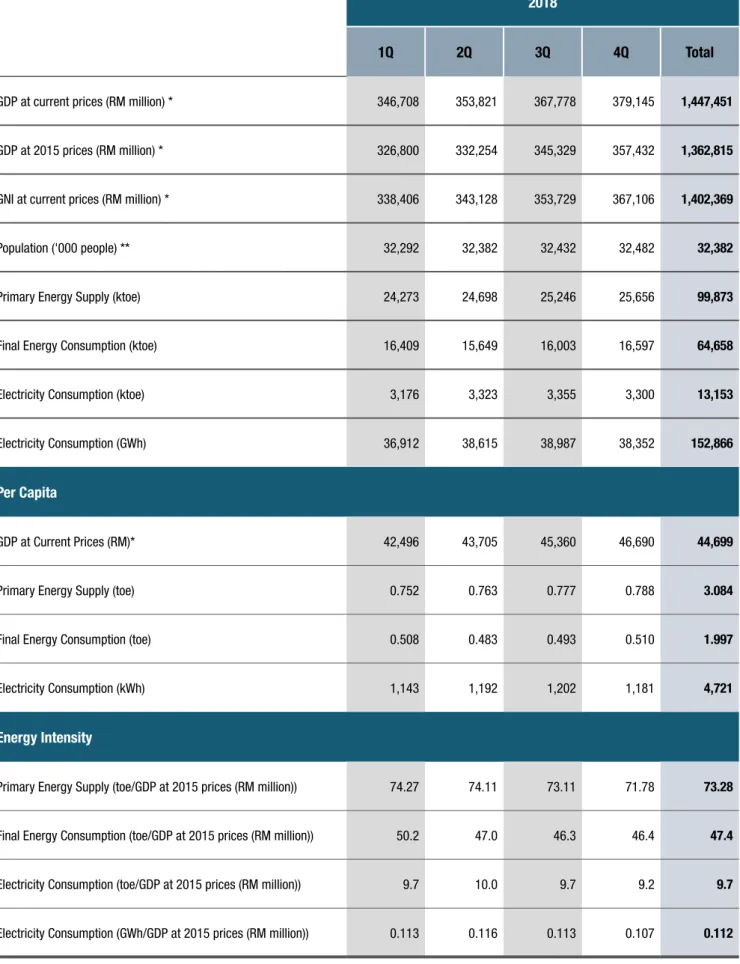
TABLE 1: KEY ECONOMIC AND ENERGY DATA
2018
1Q 2Q 3Q 4Q Total
GDP at current prices (RM million) * 346,708 353,821 367,778 379,145 1,447,451
GDP at 2015 prices (RM million) * 326,800 332,254 345,329 357,432 1,362,815
GNI at current prices (RM million) * 338,406 343,128 353,729 367,106 1,402,369
Population ('000 people) ** 32,292 32,382 32,432 32,482 32,382
Primary Energy Supply (ktoe) 24,273 24,698 25,246 25,656 99,873
Final Energy Consumption (ktoe) 16,409 15,649 16,003 16,597 64,658
Electricity Consumption (ktoe) 3,176 3,323 3,355 3,300 13,153
Electricity Consumption (GWh) 36,912 38,615 38,987 38,352 152,866
Per Capita
GDP at Current Prices (RM)* 42,496 43,705 45,360 46,690 44,699
Primary Energy Supply (toe) 0.752 0.763 0.777 0.788 3.084
Final Energy Consumption (toe) 0.508 0.483 0.493 0.510 1.997
Electricity Consumption (kWh) 1,143 1,192 1,202 1,181 4,721
Energy Intensity
Primary Energy Supply (toe/GDP at 2015 prices (RM million)) 74.27 74.11 73.11 71.78 73.28
Final Energy Consumption (toe/GDP at 2015 prices (RM million)) 50.2 47.0 46.3 46.4 47.4
Electricity Consumption (toe/GDP at 2015 prices (RM million)) 9.7 10.0 9.7 9.2 9.7
Electricity Consumption (GWh/GDP at 2015 prices (RM million)) 0.113 0.116 0.113 0.107 0.112
Note (*) : Quarterly data is from the Department of Statistics Malaysia (**) : Mid-year population data is from the Department of Statistics Malaysia
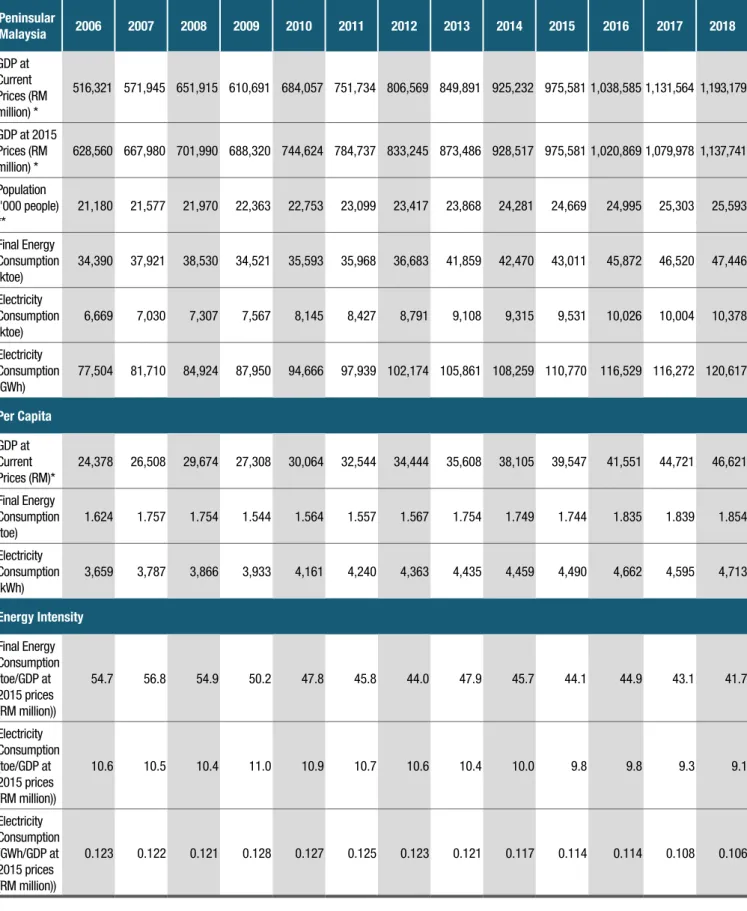
TABLE 2: KEY ECONOMIC AND ENERGY DATA BY REGION
Peninsular
Malaysia 2006 2007 2008 2009 2010 2011 2012 2013 2014 2015 2016 2017 2018
GDP at Current Prices (RM million) *
516,321 571,945 651,915 610,691 684,057 751,734 806,569 849,891 925,232 975,581 1,038,585 1,131,564 1,193,179
GDP at 2015 Prices (RM million) *
628,560 667,980 701,990 688,320 744,624 784,737 833,245 873,486 928,517 975,581 1,020,869 1,079,978 1,137,741 Population
('000 people)
**
21,180 21,577 21,970 22,363 22,753 23,099 23,417 23,868 24,281 24,669 24,995 25,303 25,593 Final Energy
Consumption (ktoe)
34,390 37,921 38,530 34,521 35,593 35,968 36,683 41,859 42,470 43,011 45,872 46,520 47,446 Electricity
Consumption (ktoe)
6,669 7,030 7,307 7,567 8,145 8,427 8,791 9,108 9,315 9,531 10,026 10,004 10,378 Electricity
Consumption (GWh)
77,504 81,710 84,924 87,950 94,666 97,939 102,174 105,861 108,259 110,770 116,529 116,272 120,617 Per Capita
GDP at Current Prices (RM)*
24,378 26,508 29,674 27,308 30,064 32,544 34,444 35,608 38,105 39,547 41,551 44,721 46,621 Final Energy
Consumption (toe)
1.624 1.757 1.754 1.544 1.564 1.557 1.567 1.754 1.749 1.744 1.835 1.839 1.854 Electricity
Consumption (kWh)
3,659 3,787 3,866 3,933 4,161 4,240 4,363 4,435 4,459 4,490 4,662 4,595 4,713 Energy Intensity
Final Energy Consumption (toe/GDP at 2015 prices (RM million))
54.7 56.8 54.9 50.2 47.8 45.8 44.0 47.9 45.7 44.1 44.9 43.1 41.7
Electricity Consumption (toe/GDP at 2015 prices (RM million))
10.6 10.5 10.4 11.0 10.9 10.7 10.6 10.4 10.0 9.8 9.8 9.3 9.1
Electricity Consumption (GWh/GDP at 2015 prices (RM million))
0.123 0.122 0.121 0.128 0.127 0.125 0.123 0.121 0.117 0.114 0.114 0.108 0.106
Note (*): 1. GDP data by State is from the Department of Statistics Malaysia
2. GDP for Peninsular Malaysia including Supra State (Supra State covers production activities that beyond the centre of predominant economic interest for any state)
3. GDP data by State from 2006 until 2014 were estimated by the Energy Commission (**): Mid-year population is from the Department of Statistics Malaysia
Sabah 2006 2007 2008 2009 2010 2011 2012 2013 2014 2015 2016 2017 2018 GDP at Current
Prices (RM million) *
40,997 48,541 60,829 55,574 62,043 70,269 71,958 72,981 78,258 79,775 86,924 101,953 108,212 GDP at 2015
prices (RM million) *
53,354 55,130 60,190 63,076 64,926 66,693 69,014 71,531 75,093 79,775 83,930 90,598 92,284 Population
('000 people) ** 3,045 3,116 3,190 3,267 3,348 3,435 3,523 3,703 3,764 3,816 3,900 3,954 3,997 Final Energy
Consumption (ktoe)
2,587 2,879 3,068 3,046 2,758 3,466 4,671 4,097 4,128 3,845 5,015 9,512 6,598 Electricity
Consumption (ktoe)
255 285 299 329 355 368 425 439 423 499 487 477 484
Electricity Consumption (GWh)
2,969 3,317 3,474 3,818 4,127 4,275 4,943 5,097 4,919 5,805 5,665 5,545 5,630
Per Capita GDP at Current
Prices (RM)* 13,464 15,580 19,071 17,009 18,530 20,457 20,424 19,709 20,793 20,908 22,291 25,788 27,071 Final Energy
Consumption (toe)
0.850 0.924 0.962 0.932 0.824 1.009 1.326 1.106 1.097 1.008 1.286 2.406 1.651 Electricity
Consumption (kWh)
975 1,065 1,089 1,169 1,233 1,245 1,403 1,377 1,307 1,521 1,453 1,402 1,408
Energy Intensity Final Energy Consumption (toe/GDP at 2015 prices (RM million))
48.5 52.2 51.0 48.3 42.5 52.0 67.7 57.3 55.0 48.2 59.8 105.0 71.5
Electricity Consumption (toe/GDP at 2015 prices (RM million))
4.8 5.2 5.0 5.2 5.5 5.5 6.2 6.1 5.6 6.3 5.8 5.3 5.2
Electricity Consumption (GWh/GDP at 2015 prices (RM million))
0.056 0.060 0.058 0.061 0.064 0.064 0.072 0.071 0.066 0.073 0.067 0.061 0.061
Note (*) : 1. GDP data by State is from the Department of Statistics Malaysia 2. GDP for Sabah includes WP Labuan
3. GDP data by State from 2006 until 2014 were estimated by the Energy Commission (**) : Mid-year population data is from the Department of Statistics Malaysia
Sarawak 2006 2007 2008 2009 2010 2011 2012 2013 2014 2015 2016 2017 2018 GDP at Current
Prices (RM million) *
67,634 76,287 93,639 80,309 88,935 104,840 108,833 112,650 121,323 121,585 124,189 138,793 146,060 GDP at 2015
prices (RM million) *
89,707 97,176 97,455 95,524 99,653 106,023 107,524 112,186 117,070 121,585 124,513 130,193 132,789 Population
('000 people) ** 2,325 2,366 2,408 2,451 2,487 2,528 2,570 2,643 2,664 2,702 2,739 2,766 2,792 Final Energy
Consumption (ktoe)
3,330 3,461 3,302 3,277 3,125 4,086 5,358 5,628 5,612 4,951 6,331 6,458 10,614 Electricity
Consumption (ktoe)
348 368 380 391 493 445 795 1,043 1,304 1,344 1,878 2,126 2,290
Electricity Consumption (GWh)
4,045 4,277 4,416 4,544 5,730 5,172 9,237 12,118 15,152 15,624 21,831 24,703 26,618
Per Capita GDP at Current
Prices (RM)* 38,585 41,070 40,465 38,977 40,068 41,941 41,843 42,455 43,945 45,007 45,464 47,064 47,566 Final Energy
Consumption (toe)
1.432 1.463 1.371 1.337 1.256 1.616 2.085 2.130 2.106 1.833 2.312 2.335 3.802 Electricity
Consumption (kWh)
1,740 1,808 1,834 1,854 2,304 2,046 3,594 4,586 5,688 5,784 7,971 8,930 9,535
Energy Intensity Final Energy Consumption (toe/GDP at 2015 prices (RM million))
37.1 35.6 33.9 34.3 31.4 38.5 49.8 50.2 47.9 40.7 50.8 49.6 79.9
Electricity Consumption (toe/GDP at 2015 prices (RM million))
3.9 3.8 3.9 4.1 4.9 4.2 7.4 9.3 11.1 11.1 15.1 16.3 17.2
Electricity Consumption (GWh/GDP at 2015 prices (RM million))
0.045 0.044 0.045 0.048 0.057 0.049 0.086 0.108 0.129 0.129 0.175 0.190 0.200
Note (*) : 1. GDP data by State is from the Department of Statistics Malaysia
2. GDP data by State from 2006 until 2014 were estimated by the Energy Commission (**) : Mid-year population data is from the Department of Statistics Malaysia
Source: GDP data is from the Department of Statistics Malaysia Note: GDP at 2015 Prices (RM Million) for 1990 until 2014 was calculated by the Energy Commission
FIGURE 1: TRENDS IN GDP , PRIMAR Y ENERGY SUPPL Y AND FINAL ENERGY CONSUMPTION
19901991199219931994199519961997199819992000200120022003200420052006200720082009201020112012201320142015201620172018 21,47126,33529,29129,92531,66233,87937,84043,17340,99644,53450,71051,97953,19657,56562,83666,21167,02172,38976,03274,58376,80979,28986,49590,73092,48792,67796,52598,29899,873 13,14614,56316,18517,72819,28722,16424,18126,16725,55827,22829,69931,51533,28934,58637,32338,28538,56741,60641,96840,84541,47643,45549,29151,58352,20951,82957,21962,48964,658 291,458319,278347,647382,046417,240458,251504,089541,002501,187531,948579,073582,071613,450648,960692,981729,932770,698819,242858,826845,828908,629956,7311,009,0971,056,4621,119,9201,176,9411,229,3121,300,7691,362,815-
10,000
20,000
30,000
40,000
50,000
60,000
70,000
80,000
90,000
100,000 -
200,000
400,000
600,000
800,000
1,000,000
1,200,000
1,400,000
ktoeRM Million (at 2015 prices)
Primary Energy Supply (ktoe) Final Energy Consumption (ktoe) GDP at 2015 Prices (RM million)*
Source: Population data is from the Department of Statistics Malaysia Note: Based on the Energy Commission’s calculations
FIGURE 2: PRIMAR Y ENERGY SUPPL Y, ELECTRICITY CONSUMPTION AND FINAL ENERGY CONSUMPTION PER CAPIT A
19901991199219931994199519961997199819992000200120022003200420052006200720082009201020112012201320142015201620172018 1,1011,2061,3521,4531,6921,8972,0682,3412,3822,4432,6032,7052,8042,9303,0223,0993,1833,3003,3673,4293,6563,6933,9434,0744,1794,2484,5534,5764,720 1.191.421.541.531.571.641.781.981.841.942.162.162.172.302.462.542.522.682.762.662.692.732.933.003.012.973.053.073.08 0.730.790.850.900.961.071.141.201.141.191.261.311.361.381.461.471.451.541.521.451.451.501.671.711.701.661.811.952.00-
500
1,000
1,500
2,000
2,500
3,000
3,500
4,000
4,500 -
0.50
1.00
1.50
2.00
2.50
3.00
3.50
kWhtoe
Electricity Consumption per capita (kWh) Primary Energy Supply per capita (toe) Final Energy Consumption per capita (toe)
Source: GDP data is from the Department of Statistics Malaysia Note: GDP at 2015 Prices (RM Million) for 1990 until 2014 was calculated by the Energy Commission
FIGURE 3: TRENDS IN GDP AND ELECTRICITY CONSUMPTION
19901991199219931994199519961997199819992000200120022003200420052006200720082009201020112012201320142015201620172018 291,458319,278347,647382,046417,240458,251504,089541,002501,187531,948579,073582,071613,450648,960692,981729,932770,698819,242858,826845,828908,629956,7311,009,091,056,461,119,921,176,941,229,311,299,891,361,53 19,93222,37325,77828,47434,07639,22543,89750,95253,19555,96161,16865,01568,82773,37177,19580,70584,51789,29492,81596,302104,519107,331116,350123,079128,333132,464144,042146,521152,86615,000
35,000
55,000
75,000
95,000
115,000
135,000
155,000 -
200,000
400,000
600,000
800,000
1,000,000
1,200,000
1,400,000
GWhRM Million (at 2015 prices)
GDP at 2015 Prices (RM million)* Electricity Consumption (GWh)
Source: GDP data is from the Department of Statistics Malaysia Note: GDP growth rates at 2015 Prices (RM Million) for 1990 until 2014 was calculated by the Energy Commission
FIGURE 4: ANNU AL GRO WTH RA TES OF GDP , PRIMAR Y ENERGY SUPPL Y, FINAL ENERGY CONSUMPTION AND ELECTRICITY CONSUMPTION
19901991199219931994199519961997199819992000200120022003200420052006200720082009201020112012201320142015201620172018 9.009.558.899.899.219.8310.007.32(7.36)6.148.860.525.395.796.785.335.586.304.83(1.51)7.425.295.474.696.015.094.455.744.74 8.9022.6511.222.165.807.0011.6914.09(5.04)8.6313.872.502.348.219.165.371.228.015.03(1.91)2.983.239.094.901.940.214.151.841.60 8.7010.7811.149.538.7914.929.108.21(2.33)6.539.086.115.633.907.912.580.747.880.87(2.68)1.544.7713.434.651.21(0.73)10.409.213.47 9.7012.2415.2210.4619.6715.1111.9116.074.405.209.306.295.866.605.214.554.725.653.943.768.532.698.405.784.273.228.741.724.33(10)
(5) -
5 10
15
20
25(%)
GDP at 2015 Prices Primary Energy Supply Final Energy Consumption Electricity Consumption
Source: GDP data is from the Department of Statistics Malaysia Note: 1. Measurement in ktoe is based on the Energy Commission’s calculations 2. Intensity = Quantity of energy required per unit output or activity 3. (*): Final Energy Consumption (including non-energy use) / GDP at 2015 prices 4. (**): Industry Energy Consumption / Industry GDP at 2015 prices 5. (***) Primary Energy Supply / GDP at 2015 prices
FIGURE 5: PRIMAR Y AND FINAL ENERGY INTENSITY
19901991199219931994199519961997199819992000200120022003200420052006200720082009201020112012201320142015201620172018 45.1045.6146.5646.4046.2348.3747.9748.3750.9951.1951.2954.1454.2753.2953.8652.4550.0450.7948.8748.2945.6545.4248.8548.8346.6244.0446.5548.0747.49 35.8638.0040.9443.4642.3146.2041.6142.9046.3142.1842.5545.4847.2645.2645.6945.9745.1347.1446.0446.5341.6944.2249.2346.3141.2040.1247.2354.8258.10 73.6782.4884.2678.3375.8873.9375.0779.8081.8083.7287.5789.3086.7288.7090.6790.7186.9688.3688.5388.1884.5382.8785.7285.8882.5878.7478.5275.6273.3535
45
55
65
75
85
95
toe/RM Million (at 2015 prices)
Final Energy Intensity (toe/RM Million at 2015 Prices)* Industrial Energy Intensity (toe/RM Million at 2015 Prices)** Primary Energy Intensity (toe/GDP at 2015 Prices)***
Sources: 1.GDP data is from the Department of Statistics of Malaysia 2. TNB,SESB,SEB,KUS, IPPs Note: 1. Measurement in ktoe is based on the Energy Commission’s calculations 2. Intensity = Quantity of energy required per unit output or activity 3. (*): Electricity Intensity (toe/RM Million GDP at 2015 prices) 4. (**): Electricity Intensity (GWh/RM Million GDP at 2015 prices)
FIGURE 6: ELECTRICITY INTENSITY
19901991199219931994199519961997199819992000200120022003200420052006200720082009201020112012201320142015201620172018 0.0680.0700.0740.0750.0820.0860.0870.0940.1060.1050.1060.1120.1120.1130.1110.1110.1100.1090.1080.1140.1150.1120.1150.1170.1150.1130.1170.1130.112 5.8846.0296.3806.4137.0277.3657.4938.1039.1329.0529.0899.6119.6549.7289.5859.5139.4369.3789.2999.7969.8979.6539.92110.0249.8609.68410.0829.6989.660-
2.000
4.000
6.000
8.000
10.000
12.000 -
0.020
0.040
0.060
0.080
0.100
0.120
0.140
toe / RM Million (at 2015 prices
GWh / RM Million (at 2015 prices)
Electricity Intensity (GWh/GDP at 2015 Prices (RM Million)) Electricity Intensity (toe/GDP at 2015 Prices (RM Million))
Note: 1) Final Energy Elasticity = Ratio between growths of energy consumption with economic growth Final Energy Elasticity = Growth Rate of Energy Consumption (%) Growth Rate of GDP (%) 2) Electricity Elasticity = Ratio between growths of electricity consumption with economic growth Electricity Elasticity = Growth Rate of Electricity Consumption (%) Growth Rate of GDP (%) 3) GDP growth rates at 2015 prices (RM Million) for 1990 until 2014 was estimated by the Energy Commission
FIGURE 7: FINAL ENERGY AND ELECTRICITY ELASTICITY
19901991199219931994199519961997199819992000200120022003200420052006200720082009201020112012201320142015201620172018 0.971.131.250.960.951.520.911.120.321.061.0211.811.040.671.170.480.131.250.181.770.210.902.450.990.20(0.14)2.341.600.73 1.081.281.711.062.141.541.192.19(0.60)0.851.0512.151.091.140.770.850.850.900.82(2.48)1.150.511.541.230.710.631.960.300.91 9.009.558.899.899.219.8310.007.32(7.36)6.148.860.525.395.796.785.335.586.304.83(1.51)7.425.295.474.696.015.094.455.744.74(10.00)
(8.00)
(6.00)
(4.00)
(2.00)
-
2.00
4.00
6.00
8.00
10.00
12.00 (4.00) (2.00)
-
2.00
4.00
6.00
8.00
10.00
12.00
14.00
Percentage (%)
Final Energy Elasticity Electricity Elasticity Growth Rates of GDP at 2015 Prices (%)
Source: Government agencies, oil and gas companies, power utilities, and IPPs