PROSPECT OF BIOMASS ENERGY FOR ELECTRICITY
GENERATION IN INDONESIA
Agus Sugiyono and Agus Nurrohim
Agency for the Assessment and Application of Technology Jl. M.H. Thamrin 8, Jakarta, Indonesia
Email: [email protected]
ABSTRACT
Indonesia endowed with variety of energy resources both fossil and renewable. Renewable energy such as biomass has advantage in term of clean and environmentally sustainable. But utilization of biomass for electricity generation is still very small because of non-economic energy prices. The paper will present a brief result of EAEF study especially for the prospect of biomass energy in Indonesia. In the BAU scenario, coal is expected dominating as a source for electricity generation. The share of fossil fuels for electricity generation declines in the TECH scenario when compared to the BAU scenario. Biomass technology such as combustion and BIGCC contributes about 100 TWh in 2030.
1. INTRODUCTION
Indonesia endowed with variety of energy resources both fossil and renewable. The main resources for electricity generation are fossil energy such: as oil, gas, coal and renewable energy such as: hydropower and geothermal. In spite of domestic used, fossil energy also as a feedstock and export commodity. While renewable energy is used only for domestic energy supply. Renewable energy utilization for electricity generation is still very small because the investment cost is still high compare with fossil energy. But an increasing oil price will make renewable energy such as biomass have prospect to utilize as a fuel for electricity generation in the near future.
On the other side, fossil energy utilization have more impact on environmental than renewable energy. Technically, electricity generation using renewable energy is environmental friendly and in line with sustainable development concept. Regarding this, State Ministry of Environment released a regulation for emission standard for the power plant as state in KEP-13/MENLH/3/1995. Emission for coal steam power plant in the year 2000 and above should not exceed the maximum standard, i.e.: particulate emission is 150 mg/m3, SO2 emission is 750 mg/m3, NO2 emission is 850 mg/m3 and opacity is 20%.
Interest in biomass for electricity generation in Indonesia is increasing since the early 1990's. ESMAP (1990) studied potential for biomass fuelled gasification to substitute for petroleum fuel consumption. The study evaluate possibility for utilizing waste product such as forest and wood industry residue to replace consumption of diesel and fuel oil in small-scale electricity and process heat generation especially in rural area. Abdullah (2003) estimated that Indonesia produces 146.7 million tons of biomass per year, equivalent to about 470 GJ/y. The source of biomass energy is scattered all over the country, but the big potential in concentrated scale can be found in Kalimantan, Sumatera, Papua and Sulawesi. Prospect of biomass energy for electricity generation should analyze as a whole of energy system with consider techno-economic and environmental aspect.
Environment Institute, Sweden; Agency for the Assessment and Application of Technology (BPPT), Indonesia; Institute of Energy, Vietnam and Department of Energy, Philippines. The study has been partly funded by the European Commission (EC) through the EC-ASEAN Energy Facility (EAEF). The paper will present a brief result of the study especially for the prospect of biomass energy in Indonesia.
2. ENERGY AND ELECTRICITY IN INDONESIA
2.1. Energy Resources
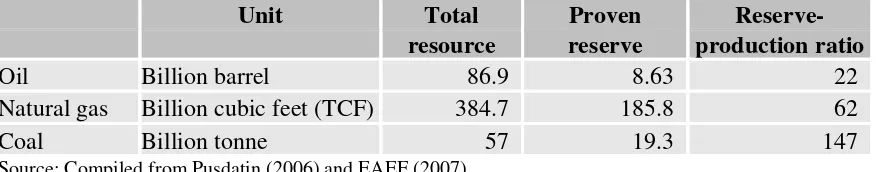
Indonesia has variety of energy resources such as oil, natural gas, coal, hydropower, geothermal, solar, wind, and biomass, presented in Table 1 and Tabel.2. Total of oil resources estimated about 86.9 billion barrels, in which about 8.63 billion barrels are proven reserves. By assumption an average annual production around 386 million barrel, the reserves will be depleted in about 22 years, if there is no new discoveries. Total gas resources were estimated about 384.7 TCF, in which 185.8 TCF was classified as proven reserves. More than 60 % of gas reserves are located in off-shores. Most of Indonesian natural gas was exported to North East Asia. Reserve production ratio of natural gas was 62 years. Total coal resources are located mainly in Kalimantan and Sumatera that estimated about 57 billions tons, in which 19.3 billion tons are measured as proven reserves. Reserve production ratio of coal was 147 years. Regarding the reserve production ratio, coal has an opportunity as a main fuel supply for electricity generation in the long term.
Table 1. Fossil fuel resources and reserves
Unit Total Proven Reserve-
resource reserve production ratio
Oil Billion barrel 86.9 8.63 22
Natural gas Billion cubic feet (TCF) 384.7 185.8 62
Coal Billion tonne 57 19.3 147
Source: Compiled from Pusdatin (2006) and EAEF (2007)
Indonesia has a large hydropower potential of 75.67 GW, however only 5.55% of the total hydropower potential or 4.2 GW has been utilized. Hydropower potential is distributed into 1,210 locations with a total electricity estimated production around 6,851 GWh. Despite large hydro, Indonesia also has mini and microhydro potency around 500 MW. The total geothermal potential has been estimated about 27 GW but only 3% has been utilized. Solar energy potential can be estimated from solar radiation. Solar radiation is estimate about 4.8 kWh/m2/day. Based on the locations, the islands such as Sulawesi, Papua, Nusa Tenggara, and Maluku have the highest average solar radiation. However, the application of solar energy in a certain area in Indonesia is not only depended on solar potential but also depended on the availability of others energy resources and its initial costs.
available in outside Jawa. While, biomass potential in Jawa is limited as a result of an increase of the population that need more land for housing, roads, and other infrastructure.
Table 2. Potential for renewable energy sources
Unit Potential Installed capacity
Hydropower GW 75.67 4.2
2.2. Electricity Production and Demand
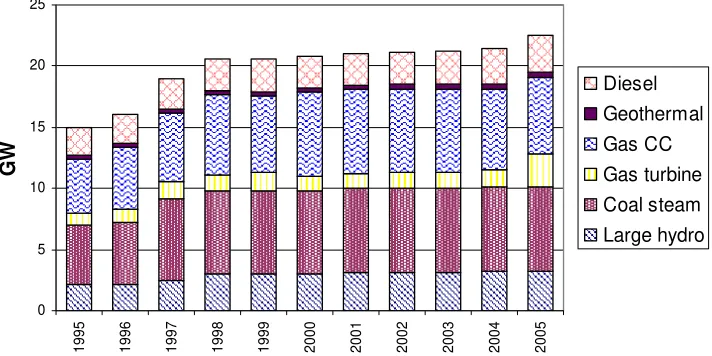
The electricity generation has supplied by State Electricity Company (PLN included interconnected system and decentralize system), Independent Power Producer (IPP) and auto-generation (captive power). The PLN installed capacity in Indonesia increase from 9.27 GW in 1990 to 21.57 GW in 2005, or increase in average of 5.78% per year. While, the IPP and auto-generation installed capacity increases from 0.83 GW in 1990 to 6.62 GW in 2005 or increase in average of 14.81% per year. The main electricity production comes from PLN with the production increases from 32.29 TWh to 101.28 TWh. during that time or increases about 7.92% per year.
Figure 1 shows the installed capacity of PLN in 1995 to 2005. In 2005, installed capacity is mainly contributed by coal steam power plant, it is about 30.65% of the total installed capacity. Gas combined cycle power plant is the second largest electric generation plant that contributes about 27.90% of the total installed capacity. The rests of the installed capacity are contributed by large hydropower plant (14.31%), diesel power (13.30%), gas turbine (about 12.10%), and geothermal plant (1.75 %). Fossil fuels remain the primary source for electricity generation, while contribution of renewable energy is still small.
0
1995 1996 1997 1998 1999 2000 2001 2002 2003 2004 2005
GW
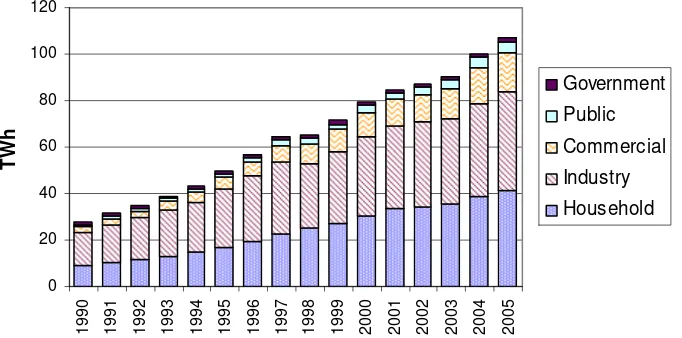
The demand sectors of electricity are household, industry, commercial, public and government sector. The electricity demand increase about 9.43% per year in the period 1990 - 2005. Total demand of electricity in 2005 was 107 TWh. Industry and household sector is the most demand for electricity with shares about 39.66% and 38.48% of the total electricity demand. While commercial, public and government sector have share about 15.90%, 4.35% and 1.61% respectively. Figure 2 shows the electricity demand in Indonesia. Between 1997 and 1999, the demand remaining more or less at the same level because of financial crisis,
0
1990 1991 1992 1993 1994 1995 1996 1997 1998 1999 2000 2001 2002 2003 2004 2005
TW
Figure 2. Electricity demand in Indonesia (Pusdatin, 2006)
3. BIOMASS ENERGY PROSPECT
The electricity demand has been projected base on population and Gross Domestic Product (GDP) growth. Planning for the electricity supply has been performed by optimization method with the period 2005 - 2030. The MARKAL model is used to make the optimization based on a linear optimisation approach. In the model, optimization problem was formulated as an energy system network. The model can be used to analyse a diverse range of policy and technical options. To determine the prospect of biomass energy, two scenarios were created. The first scenario is the BAU (Business As Usual) representing the consequences of continuation of the current trends of population, economy, technology and human behavior. The other scenario is the TCH (Technology) scenario representing the condition that the. model is allowed to make use of an expanded list of state-of-the-art technologies options for electricity generation in order to quantify their possible impact.
3.1. Electricity Demand Projection
Table 3 shows the assumed population and GDP growth projection used in the study. Population growth is decreasing step by step in the long term due to success of family planning program. GDP growth was projected about 6.5% per year in the long term.
Table 3: Projection of annual growth rate for population and GDP (%)
2003-05 2005-10 2010-15 2015-20 2020-25 2025-30
Taken into account the population and GDP growth, the total final energy demand is expected to increase at a slightly lower rate of 5.8% per year. But the electricity demand is increasing by a factor of more than 10 from 107 TWh in 2005 to 1,202 TWh in 2030 or increase at 10.9% per year.
3.2. Electricity Supply
Biomass energy has advantage in term of clean and environmentally sustainable. There technology already exist in the R&D stage to mature stage which are not necessarily more expensive than fossil fuels if all costs are internalised. A number of technologies are available to produce electricity from biomass energy such as:
• Biomass combustion power
• Biomass combined heat and power (CHP)
• Biomass cofiring
• Biomass integrated gasification combined cycle (BIGCC)
Biomass combustion technology is a mature technology and widely used to produce electricity from agro-waste, forest products, and municipal waste. In CHP operation, a portion of the steam is extracted to provide process heat. Using a boiler to produce both heat and electricity improves overall system efficiency to as much as 85 percent. Co-firing is the simultaneous combustion of different fuels in the same boiler. Co-firing increases the efficiency of the energy conversion range from 30% to 38% which is very much higher than in a biomass combustion plant (typically about 15% to 20%). Gasification is the main alternative to combustion for electricity generation. There are many examples of biomass gasification projects in the R&D stage, although the only technologies commercially deployed are CFB (Circulating Fluidised Bed) atmospheric pressure.
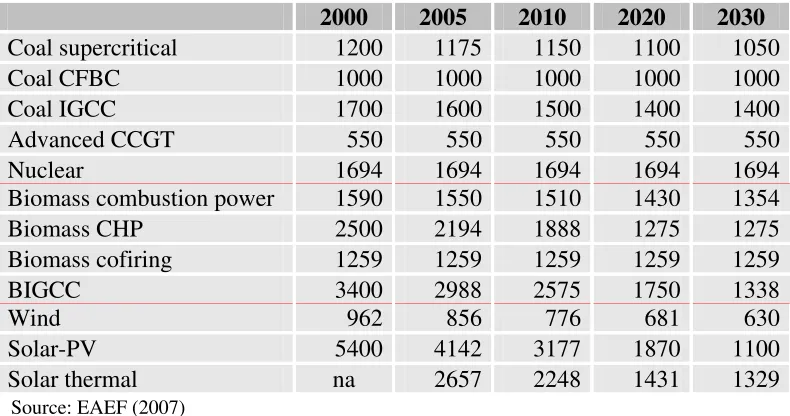
In the MARKAL model, each technology is represented by a number of technical and economical parameter, such as: life time, capacity factor, capital cost, fixed and variable O&M costs. Table 4 show the capital cost of each electricity generation technology. Realistic assumptions on future techno-economic parameter of these technologies are critical to an accurate analytical study.
Table 4: Overnight capital cost (€2004/kW)
2000 2005 2010 2020 2030
Coal supercritical 1200 1175 1150 1100 1050
Coal CFBC 1000 1000 1000 1000 1000
Coal IGCC 1700 1600 1500 1400 1400
Advanced CCGT 550 550 550 550 550
Nuclear 1694 1694 1694 1694 1694
Biomass combustion power 1590 1550 1510 1430 1354
Biomass CHP 2500 2194 1888 1275 1275
Biomass cofiring 1259 1259 1259 1259 1259
BIGCC 3400 2988 2575 1750 1338
Wind 962 856 776 681 630
Solar-PV 5400 4142 3177 1870 1100
Solar thermal na 2657 2248 1431 1329
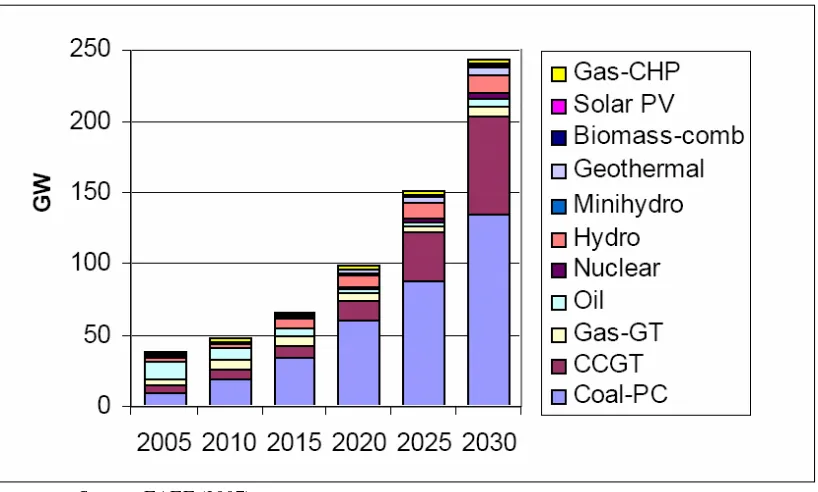
Figure 3 has shown electricity supply projection in BAS Scenario. Coal, which is plentiful domestically and relatively cheap, is dominating as the source for electricity generation. Gas (gas combined cycle and gas turbine) is the second choice as a source for electricity generation, with having share of 30% in 2030. Nuclear will penetrate from 2020 and will contribute about 18 TWh in both 2025 and 2030. The remaining is covered by renewable energy (large hydro, geothermal and other renewables). Among renewables, geothermal penetrates rapidly by increasing generation from 5 TWh at present to 35 TWh by 2030. Biomass (combustion) and solar PV make some contribution particularly in small islands.
Source: EAEF (2007)
Figure 3. Electricity generation capacity by technology (BAU)
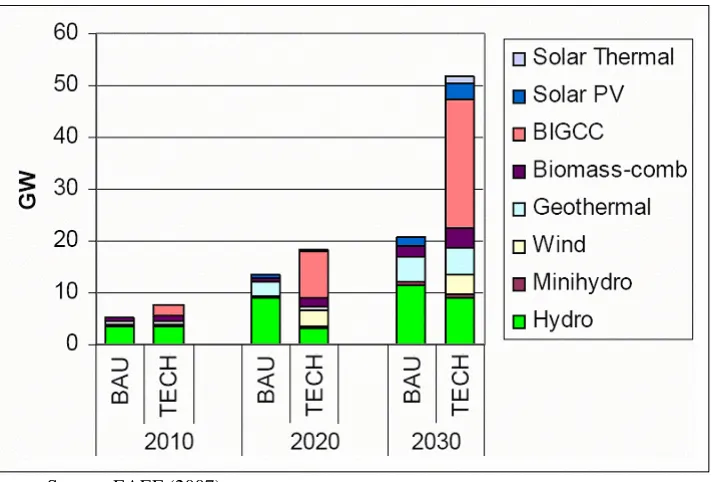
The share of fossil fuels for electricity generation declines in the TECH scenario when compared to the BAU scenario. The share of generation from large hydro and geothermal declines as well since a number of other renewable options become competitive, including wind, biomass combustion, BIGCC, solar PV and solar thermal power. A large part of it is captive generation, particularly in decentralised system. Biomass technology such as combustion and BIGCC contributes about 100 TWh in 2030 (See Figure 4).
Source: EAEF (2007)
Figure 4. Electricity generation capacity from renewable energy (BAU and TECH scenario)
Table 5. Long-run marginal cost of electricity supply to the Java consumers (€/MWh)
Scenario Time slice 2010 2020 2025 2030
BAU Intermediate 56.94 57.19 73.6 103.34
TECH Intermediate 58.06 41.74 41.4 46.03
BAU Summer 152.07 197.18 208.34 260.16
TECH Summer 121.71 99.34 109 101.01
BAU Winter 68.52 119.5 117.96 133.33
TECH Winter 75.89 92.18 54.36 46.03
Source: EAEF (2007)
4. CONCLUSION AND RECOMMENDATION
Electricity demand growth is higher than the demand growth for other final energy carriers, i.e. 9.6% per year. from 107 TWh in 2005 to 1,070 TWh in 2030. These growths need a large expansion of the power infrastructure. To meet the large demand increase, Indonesia will deploy fossil fuels, primarily coal since it is relatively cheap and is domestically available.
Taking into account the potency of biomass energy, the model show that biomass energy for electricity generation bring several benefits such as reduction in:
• fossil energy requirement
• investment in electricity sector
• petroleum fuel import bill, and
Government policy and regulation on green energy and being implemented in the form of distributed electricity generation program may provide a greater opportunity for biomass energy for electricity generation.
Non-economic energy prices continue to be one of the most important constraints to the promotion of biomass gasification. Increasing international crude oil price and removing petroleum fuel price subsidy gradually seem as an incentive for biomass energy development. CDM is foreseen as another vehicle that will bring biomass energy technology as well as required investment to Indonesia.
REFERENCES
Abdullah, K. (2003) Biomass Energy Potentials and Utilization in Indonesia, Technical Report, Department of Agricultural Engineering, Bogor Agricultural Institute.
EAEF (2007) Analysis of the impact of enhanced use of renewable and advanced fossil fuel technologies for power generation in selected ASEAN countries and development of
appropriate policies and institutional frameworks, Final Report, EC-ASEAN Energy
Facility.
ESMAP (1990) Indonesia Biomass Gasifier Pre-Investment Study, Report No. 124A/90. The Joint UNDP/World Bank Energy Sector Management Assistance Programme. Pusdatin (2006) Handbook of Energy Economy Statistics Indonesia 2005, In Indonesian,