i SCREENING, TESTING AND THE DEVELOPMENT
OF A QUALITY STANDARD FOR BITUMEN
By
MUHAMMAD SYUKRI BIN MD JAMIL
Dissertation Submission in Partial Fulfilment of the Requirements for the Degree
Bachelor of Engineering (Hons.) Civil Engineering
MAY 2012
Universiti Teknologi PETRONAS Bandar Seri Iskandar
31750 Tronoh Perak Darul Ridzuan
ii CERTIFICATION OF APPROVAL
SCREENING, TESTING AND THE DEVELOPMENT OF A QUALITY STANDARD FOR BITUMEN
by
MUHAMMAD SYUKRI B MD JAMIL
A project dissertation submitted to the Civil Engineering Programme University Teknologi PETRONAS In partial fulfillment of the requirement for the
BACHELOR OF ENGINEERING (Hons) (CIVIL ENGINEERING)
Approved by,
……….
(Associate Professor Ir Dr Ibrahim Kamaruddin)
UNIVERSITI TEKNOLOGI PETRONAS TRONOH, PERAK
MAY 2012
iii CERTIFICATION OF ORIGINALITY
This is to certify responsible for the work submitted in this project, that the original work is my own except as specified in the references and acknowledgements, and that the original work contained herein have not been undertaken or done by unspecified sources or persons.
_____________________________
MUHAMMAD SYUKRI B MD JAMIL
iv
ABSTRACT
Today bitumen is the most widely used as paving material. The characteristics and properties of bitumen should meet international standard and specification. The testing and grading of bitumen has progressively been improved to meet the demanding needs for quality standard of bitumen. This study investigated the rheological and morphological properties of 80/100 penetration grade bitumen obtained from various sources which were from PETRONAS and SHELL refinery process. One of PETRONAS bitumen was manually blended in refinery that gives much different of properties compared to normal refinery process. The fundamental characteristics of bitumen has been determined using conventional tests such as Penetration, Softening Point, Ductility, Solubility in Trichloroethylene, Specific Gravity, Spot Test, Water in Bitumen and Flash Point. Rheological properties of the sample bitumen are analyzed by use of bitumen tests such as Brookfield Viscosity, Rotational Viscosity (RV), Loss on Heating and Dynamic Shear Rheometer (DSR).
Morphology properties are analyzed by use of bitumen tests such as Atomic Force Microscopy (AFM), Field Emission Scanning Electron Microscopy (FESEM) and X- Ray Diffraction (XRD). In addition, the short and long term ageing properties of bitumen are analyzed, with the ageing process simulated by the Pressure Ageing Vessel (PAV). The results indicate the fundamental properties and morphology of the bitumen is dependent on the type of bitumen content. The results reveal that bitumen with manually blended is the hardest compared to bitumen from normal refinery process. PETRONAS bitumen show that they exhibit higher vapor content compared to SHELL bitumen. In addition, SHELL bitumen exhibit better ageing properties as compared to PETRONAS bitumen.
v ACKNOWLEDGMENT
Firstly, the author would like to express his gratitude to Allah s.w.t, for His guidance and blessings, and giving the strength in completing the final year project in the Civil Engineering Department of Universiti Teknologi PETRONAS.
A lot has transpired during the experimentation and data analysis and the author is in debt to so many people who has made this project a success. My deepest gratitude goes to Assoc. Prof. Ir. Dr. Ibrahim Kamaruddin, my supervisor who has guided me through the theory and experimental works. The author also would like to express his gratitude to the lecturer and technicians especially Mr Azran and Mr Iskandar in Civil Engineering Department as well as the Research Officers, Ms Noorfakriah and Ms Ita Athirah for their helps during conducting the experiments.
Furthermore, a token of appreciation were given to all author colleagues who had involved directly or indirectly in making the project done successfully with their assistance.
Last but not least, the author would like to give special thanks to his family members for giving the support when facing with difficulties and financial problems. Again, many thanks for all of the support received.
vi TABLE OF CONTENTS
CERTIFICATION OF APPROVAL……… ii
CERTIFICATION OF ORIGINALITY……….. iii
ABSTRACT……… iv
ACKNOWLEDGEMENT………. v
CHAPTER 1: INTRODUCTION……….. 1
1.1 Background of Study……… 1
1.2 Problem Statement……… 2
1.3 Objective & Scope of Study………. 2
CHAPTER 2: LITERATURE REVIEW……….. 3
2.1 Introduction………. 3
2.2 Bitumen Chemistry and Structure………. 4
2.3 Type of Bitumen………... 6
2.4 Properties of Bitumen……… 6
2.5 Conventional Bitumen Test and Their Significance……... 7
2.6 Advanced Test on Bitumen and Their Significance……… 10
CHAPTER 3: METHODOLOGY……….. 13
3.1 Material………. 13
3.2 Laboratory Testing……… 13
CHAPTER 4: RESULT AND DISCUSSION……… 22
4.1 Standard Properties of Base Bitumen……… 22
4.2 Result of Bitumen Tests……… 22
CHAPTER 5: CONCLUSION……… 39
REFERENCES………... 40
APPENDICES………. 42
vii LIST OF FIGURES
Figure 2.1 Distillation of Bitumen (courtesy from Nynas,2012) ... 5
Figure 3.1 The Process of Penetration Test ...13
Figure 3.2 The Process of Softening Point Test ...14
Figure 3.3 The Process of Ductility Test ...15
Figure 3.4 The Process of Solubility test ...15
Figure 3.5 Brookfield Viscometer for Viscosity Test ...17
Figure 3.6 The RV Test setup ...17
Figure 3.7 The Water in Bitumen Test Setup ...18
Figure 3.8 The Atomic Force Microscopy Setup ...19
Figure 3.9 Field Emission Scanning Electron Microscopy ...20
Figure 4.1 Spot test without nuclei indicates negative result ...26
Figure 4.2 Combination of Viscosity vs Shear Rate for all ...27
Figure 4.3 Sample Petronas 1; 3D phase ...31
Figure 4.4 Sample Petronas 1; 2D Phase ...31
Figure 4.5 Sample Petronas 2; 3D phase ...31
Figure 4.6 Sample Petronas 2; 2D phase ...31
Figure 4.7 Sample Shell; 3D phase ...31
Figure 4.8 Sample Shell; 2D phase ...31
Figure 4.9 The Internal Morphology of Sample P1 ...32
Figure 4.10 The Internal Morphology of Sample P2 ...33
Figure 4.11 The Internal Morphology of Sample S ...33
Figure 4.12 XRD result for bitumen ...34
viii LIST OF TABLE
Table 4.1 Standard Properties of 80/100 Penetration Grade Bitumen ...22
Table 4.2 Summary Result of Penetration Test ...22
Table 4.3 Summary Result of Softening Point Test ...23
Table 4.4 Penetration Index for P1, P2, and Shell bitumen ...24
Table 4.5 Ductility after adding sodium chloride ...24
Table 4.6 Summary Result of Solubility Test ...25
Table 4.7 Summary Result of Specific Gravity Test ...25
Table 4.8 Viscosity at shear rate 4000/s ...27
Table 4.9 Viscosity for PETRONAS 1 bitumen ...28
Table 4.10 Viscosity for PETRONAS 2 bitumen ...28
Table 4.11 Viscosity for SHELL bitumen ...28
Table 4.12 Water content (%) for all samples ...29
Table 4.13 Results for Flash Point Test for all samples ...29
Table 4.14 Mass Loss/ Gain after RTOF for P1 and P2 bitumen ...30
Table 4.15 Mass Loss/Gain after RTOF for SHELL bitumen ...30
Table 4.16 Intensity (count), FWHM, d-spacing, and crystallite size of the obtained peaks.35 Table 4.17 Summary of Dynamic Shear Rheometer Result ...35
Table 4.18 Average penetration before and after PAV ...36
Table 4.19 Average Softening Point before and after PAV (°C) ...37
Table 4.20 Average reading of RV before and after PAV (cP)...37
1
CHAPTER 1 INTRODUCTION
1.1 Background of Study
Billions are spend to build new roads and maintain thousands of kilometers of existing roads each year in the world. The bitumen industry is gradually involved in improving the product and its performance due to the dominant importance of the road network in the economic development and social structure of each country.
These industries had influence the public bitumen research and establish cooperation with public institutions on research projects of common interest vary from country to country.
Bitumen is a construction material and fundamental element in road construction and maintenance. It is most common used in asphalt pavement with requirement of standard quality and consistency. Bitumen experiences a variety of thermo mechanical demand as a binder for road paving. The characteristics and properties of bitumen should meet the requirement of international standard in order to market bitumen.
Currently, bitumen is graded according to a number of traditional and often empirical tests in most countries in the world. For example, penetration and softening point have been the basis of the grading system in the UK. This test has been widely used around the world to set the quality standard of bitumen. By the way, fundamental properties such as viscosity have also been specified. For the past year, these specifications have provided a dependable means of classifying binders and are familiar to authorities, specifiers, binder suppliers and road contractors. To comply with these specifications, binder suppliers must have built up experience of how
2 different binders based on these properties. This has included developing the expertise to manufacture good quality bitumen from a diversity of crude oils.
1.2 Problem Statement
The testing and grading of bitumen has progressively been improved to meet the demanding needs for quality standard of bitumen. The characteristics and properties of bitumen are different even the bitumen has same penetration grade. The differences of characteristic of bitumen have affected the bitumen quality. Thus, the bitumen should meet the requirement of international standard.
Besides that, the roads have faced the climate condition and extreme environment such as high heat, heavy rains and load of traffics. The unmodified bitumen could not satisfy the requirement. This will lead to several failures such as deformation at high service temperatures, fatigue at intermediate service temperatures and brittle fracture at low service temperatures. Hence, we need to develop bitumen with a higher level of performance.
In order to improve and develop the bitumen quality, this study is conducted using conventional and advanced test on bitumen.
1.3 Objective
The main objectives of this study is therefore to research the fundamental properties, physical and mechanical characteristic of bitumen that is obtained from different sources and refinery processes in order to extend the existing knowledge of bitumen with a view to using the increased understanding for quality determination.
These objectives are divided into the following:
1) To develop quality standard and conduct product testing for 80/100 penetration grade bitumen obtained from various sources
2) To determine the properties of bitumen from different sources using conventional and advanced tests.
3
CHAPTER 2
LITERATURE REVIEW
2.1 Introduction
The demands for stronger and more durable road pavements have steadily increased by the increasing in traffic flow, higher axle loads and tyre pressure on road. Sengoz and Isikyakar (2007) stated the conventional bituminous materials have been used satisfactorily in most highway pavement and airfield runaway applications. However during the last decade increase in axle roads, heavy traffic, severe climatic conditions and construction failure lead to a need to enhance the properties of the base bitumen.
For many years, researchers and development chemist actively participate to produce and enhance the modified and unmodified bitumen mainly for the industrial usage. In 1997, a very different binder grading system was introduced in the USA. This was one of the principal outputs from the Strategic Highway Research Program (SHRP) and is based on a number of fundamental, rheological properties of binders. Within this system, rather than a binder being classified by for example penetration at 25oC (e.g 70 or 100 pen), it is classified by two number (e.g. “64-28”, “58-22” etc). The first of these numbers is an indication of the binder‟s high temperature performance and the second relates to its low temperature performance. This performance grade (PG) may be thought of as a type of „plasticity‟ range for the binder. Such a fundamental grading system should have the benefit of being applicable to both unmodified bitumen and speciality products such as Polymer Modified Bitumens (PMBs) (Claxton and Green, 1996).
4 Many studies have been conducted on bitumen in which grade have been determined for a number of bitumen that produced from a variety of crude oils by different refinery source and covering from many grades to see how they fit into this grading system. The comparison for unmodified bitumen is made for grading system by three different methods which are (1) grading by penetration at 25oC, (2) grading by absolute viscosity at 60oC, and (3) grading by absolute viscosity of aged asphalt residue after the rolling thin oven test (RTFOT) procedure.
2.2 Bitumen Chemistry and Structure 2.2.1 Definition
Bitumen is a non-crystalline viscous material, black or dark brown, derived from petroleum either by natural or refinery processes which is substantially soluble in carbon disulphide (CS2), possessing adhesive and water-proofing qualities. It consists essentially of hydrocarbons and would typically comprise at least 80 % carbon and 15 % hydrogen, the remainder being oxygen, sulphur, nitrogen and traces of various metals (Whiteoak, 2003). Basically, bitumen is a “viscous-elastic‟ material depending on temperature and rate of loading in existence of purely viscous, purely elastic or a combination between both (Mouillet, 2008).
2.2.2 Bitumen Manufacture
Bitumen is manufactured from crude oil. According to Whiteoak (2003), the crude oil originates from the remains of marine organism and vegetable matter deposited with mud and fragments of rock on the ocean bed. Conversion of the organisms and vegetable material into the complex of hydrocarbon is result from the application of heat within the Earth‟s crust and pressure from upper layer of sediment.
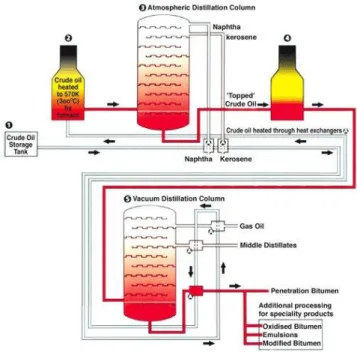
5 Research revealed that the first process in the manufacture of bitumen is atmospheric distillation (Nicholls, 1998). The first process take place is separating the light components from the crude oil by atmospheric distillation at typically 350oC as shown in Figure 2.1. Then, at higher temperature (350-425oC), the residue from atmospheric distillation is further refined. The vacuum distillation residue, also called „vacuum residue‟, is the basic produced in the refining process. It is known as
„residual‟ or „straight-run bitumen‟.
Figure 2.1 Distillation of Bitumen (courtesy from Nynas,2012)
Air blowing develop in the late 19th century was the first process that led to the manufacture of bitumen from otherwise too fluid crude source (Lesueur, 2008). The bitumen is heating in high temperature (200-275oC) for a few hours, sometimes in the present of catalyst, such as cooper sulphate or zinc ferric. It will produce the air blown bitumen or called as oxidize bitumen.
6 2.3 Type of bitumen
Bitumen can be classified into four types which are characterized by a combination of penetration, softening point and viscosity. There are:
Penetration bitumen, characterized by penetration and softening point Oxidized and hard bitumen, characterized by softening point and penetration Cutback bitumen, characterized by viscosity
Blown bitumen
2.4 Properties of Bitumen
There are some 250 uses of bitumen (Asphalt Institute, 1989). It has been categorized in many field including agriculture, buildings, hydraulics and erosion control, industrial, paving, railways and recreation. With this multipurpose used of bitumen, it is clear that the bitumen is an important material in road design, construction and maintenance. The properties of bitumen are (Asphalt Institute, 1991):
i. Durability – Ability of bitumen to resist the effects of water, ageing and temperature variations
ii. Adhesion and cohesion – Adhesion is the ability to bind aggregate in bituminous pavement mixture together while cohesion is the ability to hold the aggregate particles firmly in place in the finished pavement.
iii. Temperature Susceptibility – All bitumen are thermoplastic that is they become harder as their temperature decrease and softer as their temperature increase. This property is important for determining the temperature of a mixture of bitumen and aggregate and to determine the appropriate compaction temperature.
iv. Hardening and Aging – The rate of bitumen hardening when mixed with hot aggregate and the aging that occurred during the life of the pavement due to environmental conditions.
7 2.5 Conventional Bitumen Test and Their Significance
The purpose and significance of the conventional tests on bitumen are described in this section.
2.5.1 Penetration Test
The consistency (hardness) of bitumen is measured by penetration test (ASTM D5, ASTM 2001). In this test, a needle of specified dimensions is allowed to penetrate into a sample of bitumen under known load (100g), at a fixed temperature (25oC), for a known time (5s). The distance, the needle penetrates in units of 0.1 mm is termed penetration. Therefore the greater is the penetration; the softer is the bitumen, while harder bitumen will have a lower penetration. The penetration test can be used to designate grades of bitumen and to measure changes in hardness due to age hardening or change in temperature.
2.5.2 Softening Point Test
The softening point test or ring and ball test (ASTM D36) is measured the temperature in which bitumen changes from solid to liquid. The harder of bitumen will result in higher softening point temperature. The softening point temperature can be used along with the penetration to measure the temperature susceptibility of bitumen. The penetration index indicates a quantitative measure of the temperature susceptibility of bitumen. A lower penetration index indicates high temperature susceptibility. The typical value for penetration index for conventional paving bitumen is between -2 and +2.
2.5.3 Ductility
The ductility test (ASTM D113) is to determine the distance at which bitumen elongates before it breaks at a constant temperature (25 °C) at standard stretching rate (5cm/min). It is generally considered that bitumen with a higher ductility value indicates higher adhesive properties when used with aggregates in bituminous mixture and thus good performance in service.
8 2.5.4 Solubility Test
The solubility test is a measure of the purity of the bitumen. The bitumen content of a bituminous material that is soluble in trichloroethylene represents the active cementing constituents. A small sample of bitumen is dissolved in 100 ml of carbon disulfide and the solution is filtered through a filtering mat in a filtering crucible. The material retained on the filter is then dried and weighed, and used to calculate the bitumen content as a percentage of the weight of the original bitumen.
Solubility in trichloroethylene is regularly used as designated in ASTM D 2042. The solubility test is used to detect contamination in bitumen. Specifications for bitumen normally require a minimum solubility in trichloroethylene of 99.5 percent.
2.5.5 Specific Gravity
The specific gravity test is done to determine the density of semi-solid bituminous materials. The test is conducted using pycnometer method (ASTM D70). The principle is that it is the ratio of mass of a given volume of bitumen to the mass of an equal volume of water, both taken at a specified temperature. Specific gravity tests are useful in making volume correction based on temperature. A typical specific gravity is ranges from 1.02 to 1.05. The specific gravity at 15.6oC (60oF) is commonly used when buying or selling bitumen.
2.5.6 Spot Test
The spot test is used to screen the bitumen whether has been damaged or not during processing due to overheating. The cracked or damaged bitumen tend to be less ductile and more susceptible to ageing effects. The method of spot test is using AASHTO T 102. Normally, the spot test is a form of paper chromatography. A small drop of bitumen is dropped onto a filter paper. The brown color indicates the test is negative while the brown with a black center shows positive result.
2.5.7 Viscosity Test
The viscosity test measures the viscosity of bitumen. The consistency of bitumen can be determined by viscosity test and penetration test at some specified temperature and both test are used to designate grades of bitumen. The using of viscosity test compared to penetration test give advantage because the viscosity test measures the
9 fundamental physical property rather than empirical value. Bitumen must remain sufficiently fluid, or workable, at the high temperature necessary during plant mixing, field placement and compaction of hot bituminous mixture (Roberts, et al., 1996).
Viscosity is defined as the ratio between the applied shear stress and induced shear rate of fluid. The relationship can be expressed as
Shear Rate (1/sec) = Shear Stress (Pa) / Viscosity (Pa-sec)
One Pascal-second is equal to 10 Poises. The lower the viscosity of bitumen, the faster the bitumen will flow under same stress. There are two methods to define the viscosity. The test will be described below.
2.5.7.1 Brookfield Viscometer Test
The test method is using the Brookfield Viscometer. A drop of bitumen sample is placed on the plate below spindle. The spindle rotated based on the specified shear rate. The reading will be displayed after the test run.
2.5.7.2 Brookfield Rotational Viscometer Test
The Brookfield rotational viscometer test as specified by ASTM D4402 for use in measuring the viscosity of bitumen at elevated temperatures to ensure that the bitumen are sufficiently fluid when being pumped and mixed at the hot mix plants. In the Brookfield rotational viscometer test, the test binder sample is held in a temperature-controlled cylindrical sample chamber, and a cylindrical spindle, which is submerged in the sample, is rotated at a specified constant speed. The torque that is required to maintain the constant rotational speed is measured and used to calculate the shear stress according to the dimensions of the sample chamber and spindle.
Similarly, the rotational speed is used to calculate the shear rate of the test. Viscosity is then calculated by dividing the computed shear stress by the computed shear rate.
For Superpave bitumen specification purpose, the rotational viscosity test is to be run on the original bitumen at 135 °C. The maximum allowable viscosity at this condition is 3 Pa-s.
10 2.5.8 Water in Bitumen
Water in bitumen test is to determine the amount of water content in bitumen. The knowledge of water content in bitumen is important in the refining, purchase, sale and transfer of product. It is desirable that the bitumen contains minimum water content to prevent foaming of bitumen when it is heated above the boiling point of water. The standard method for this test is using Water in Petroleum Products and Bituminous Materials by Distillation (ASTM D95). The bitumen is heated under reflux with water-immiscible solvent (xylene), which co-distills with the water in the bitumen. Condensed solvent and water are continuously separated in a trap, the water settling in the graduated section of the trap and the solvent returning to the still.
2.5.9 Flash Point Test
The flash point bitumen is the lowest temperature at which the application of a test flame causes the vapors from the material to momentarily catch fire in the form of a flash. The method of Cleveland Open Cup (ASTM D92) is used for flash point above 79oC. The bitumen is heated in an open cup at a specified rate and the temperature will be determined at which a small flame passing over the surface of the cup and cause the vapors from the bitumen sample temporarily to ignite or flash. The hardening potential of bitumen can be related to the flash point test result. A high flash point of bitumen is more likely to have a lower hardening potential in field.
2.6 Advanced Test on Bitumen and Their Significance
The Superpave (Superior PERforming asphalt PAVEments) system was developed by the Strategic Highway Research Program (SHRP). The Superpave binder tests and specifications have been standardized by the American Association of State Highway and Transportation Officials (AASHTO). The significance of advanced tests is discussed in this section.
11 2.6.1 Pressure Aging Vessel
The Pressure Aging Vessel (PAV) provides simulated long term aged bitumen for physical property testing. Bitumen is exposed to heat and pressure to simulate in- service aging over a 7 to 10 year period. The basic PAV procedure (AASHTO Designation PP1-98) takes RTFOT aged bitumen samples, places them in stainless steel pans and then ages them for 20 hours in a heat vessel pressurized to 2.1 ± 0.1 MPa. The climate condition of the area where bitumen will be applied will determine the PAV temperature that will be used in this test which is ranging around 90 - 100oC. A pressure test was desired for simulating long term bituminous binder aging because (Bahia and Anderson, 1995):
Volatile loss is minimized
Aging can be accomplished without high temperatures
Large enough sample sizes can be accommodated
Field climate conditions can be approximated
Laboratory use is practical
2.6.2 Dynamic Shear Rheometer Test
The dynamic shear rheometer is used to characterize the viscous and elastic behavior of bitumen at medium to high temperatures. The DSR determines the indication of the rutting resistance of bitumen immediately following construction. Resistance to rutting at high service temperature in the early stages of pavement life is also evaluated. The DSR also provides an indication of the resistance to fatigue cracking at immediate service temperature in the last stages of service life. The basic DSR test is conducted using the standard method AASHTO Designation TP5-98. DSR tests are conducted on unaged, RTFO aged and PAV aged bitumen samples (Robert, et al, 1996).
12 2.6.3 Loss on Heating Test
The loss on heating test is to determine the degree to which it may have been „cut‟ by a low molecular weight flux. It is also to control the volatility of bitumen. This test is conducted using the Rolling Thin Film Oven Test (RTFOT) (AASHTO T240-09) which is simulates the effect of heating in a hot mix plant. The vitality of bitumen will be lost and get hardened when it is heated. The sample is weighed and heated to a temperature of 163oC for 5 hours in a specified oven designed for this test. The sample specimen is weighed again after the heating period and loss in weight is expressed as percentage by weight of the original sample. Bitumen used in pavement mixes should not indicate more than 1% loss in weight.
2.6.4 Atomic Force Microscopy (AFM)
The phase detection Atomic Force Microscopy (AFM) is an analysis of the microstructure of bitumen. The phase detection and topographic AFM images, displayed three different types of microstructure; the so-called catana phrase domains (bee-like structures) dispersed in the peri-phase are present in most of the cases;
para-phase domains are also observed in the neighbourhood of catana and peri- phases (Costa,E.R et al,2008). Differences in three dimensional images are indicative that the concentration of asphaltene may vary with different bitumen from different crude sources.
2.6.5 Field Emission Scanning Electron Microscopy (FESEM)
The Field Emission Scanning Electron Microscopy (FESEM) test is used to study the internal morphology of the bitumen by visual assessment. Morphology of bitumen is included the shape, size, texture and phase distribution of bituminous element in bitumen. FESEM also is used to determine the consistency of surface featured in bitumen material and provide extremely detailed image.
2.6.6 X-Ray Diffraction (XRD)
The X-Ray Diffraction (XRD) test is used to analyze the dispersion structure in the bitumen. The XRD test produce diffractogram that indicate stability and degree of impurities in bitumen sample tested. This test is reveal information about crystal structure, chemical composition and physical properties of bitumen.
13
CHAPTER 3 METHODOLOGY
3.1 Material
The materials used in this study are as listed
1) PETRONAS Bitumen 80/100 (Sample P1)
The sample is obtained from normal refinery process 2) PETRONAS Bitumen 80/100 (Sample P2)
The sample is blended in refinery 3) SHELL Bitumen 80/100 (Sample S) 3.2 Laboratory Testing
3.2.1 Penetration Test (ASTM D5)
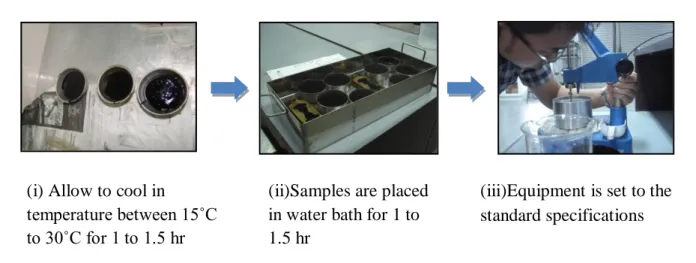
The objective of this test is to determine the consistency (hardness) of penetration bitumen. In this test, a needle of specified dimensions is allowed to penetrate into a sample of bitumen under a known load (100g), at fixed temperature (25 oC), for a known time (5 seconds). The test is performed for every specimen in order to classify into standard penetration ranges. Figure 3.1 shows steps during the penetration test.
(i) Allow to cool in
temperature between 15˚C to 30˚C for 1 to 1.5 hr
(ii)Samples are placed in water bath for 1 to 1.5 hr
(iii)Equipment is set to the standard specifications
Figure 3.1 The Process of Penetration Test
14 3.2.2 Softening Point (ASTM D36)
Softening point test is to determine the consistency of the bitumen, which represent the temperature at which a change of phase from solid to liquid. In this test, a steel ball (3.5g) is placed on a sample of specimen contained in a brass ring which will be suspended in a water or glycerol bath. The bath temperature is raised at 5oC per minute, the specimen softens and eventually deforms slowly with the ball through the ring. At the moment the specimen and steel ball touched a base plate 25 mm below the rim, the temperature of the water is recorded.
The test is performed in duplicate and the mean of the two measured temperatures reported to the nearest 0.2oC. The difference should not exceed 1oC; otherwise the test must be repeated. The steps during test are described as in Figure 3.2.
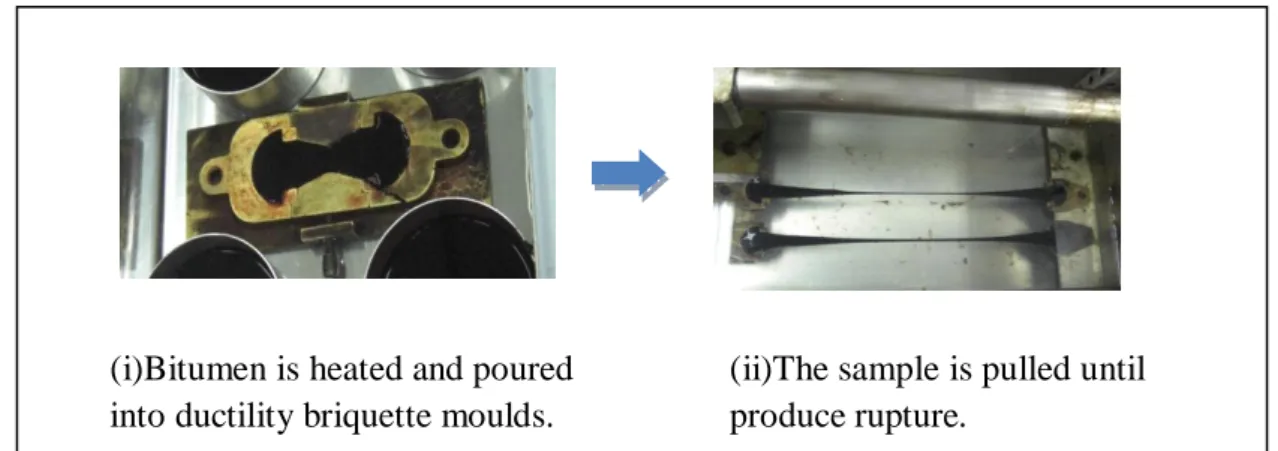
3.2.3 Ductility Test (ASTM D113)
The ductility test is the method to determine the basic cohesive strength of the bitumen. In this test the mould contain of specimen are immersed in a water bath with a standard test temperature of 25oC and measure the distance in centimeters through which the clips have been pulled to produce rupture. Figure 3.3 show the step during the ductility test.
(ii)Water bath is heated and stirred for
temperature rises 5±0.5˚C per minute
(i)Sample is filled in rings and cooled in air 30 minutes
(iii)Temperature reading is taken when the ball
touched the bottom plate Figure 2.2 The Process of Softening Point Test
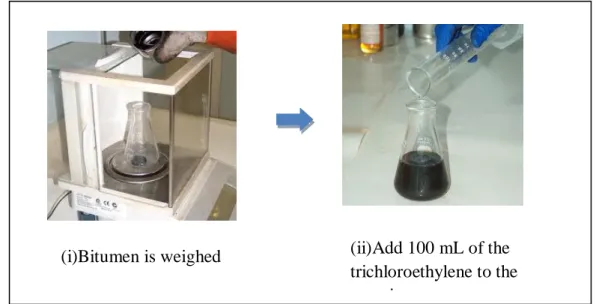
15 3.2.4 Solubility Test (ASTM D2042)
The objective of this test is to measure of the solubility of bitumen in trichloroethylene. The portion that is soluble in trichloroethylene represents the active cementing constituents. A small sample of bitumen is dissolved in 100 ml of trichloroethylene and the solution is filtered through a filtering mat in a filtering crucible. The material retained on the filter is then dried and weighed, and used to calculate the bitumen content as a percentage of the weight of the original bitumen.
The steps during test are described as in Figure 3.4.
(ii)The sample is pulled until produce rupture.
(i)Bitumen is heated and poured into ductility briquette moulds.
(i)Bitumen is weighed (ii)Add 100 mL of the trichloroethylene to the container
Figure 3.3 The Process of Ductility Test
Figure 3.4 The process of solubility test
16 3.2.5 Specific Gravity (ASTM D70)
The objective of this test is to determine the relative density and density of bitumen.
Values of density are used for correcting measured volumes from the temperature of measurement to a standard temperature. A small sample of bitumen is placed in a calibrated pycnometer. The pycnometer and sample are weighed, then the remaining volume is filled with water. The filled pycnometer is brought to test temperature, and weighed. The density of the sample is calculated from its mass and the mass of water displaced by the sample in the filled pycnometer.
3.2.6 Spot Test (AASHTO T 102)
The spot test is used to determine whether or not a sample of bitumen has been damaged during processing due to overheating. This test is conducted by dissolving a small amount of bitumen in a solvent and dotted on a filter paper. A positive spot is seen as a ring of dark material deposited as the solvent bitumen blend is absorbed and spreads out on the filter paper.
3.2.7 Viscosity Test
The objective of this test is to measure the viscosity of bitumen. This test will be conducted in two methods which are described below.
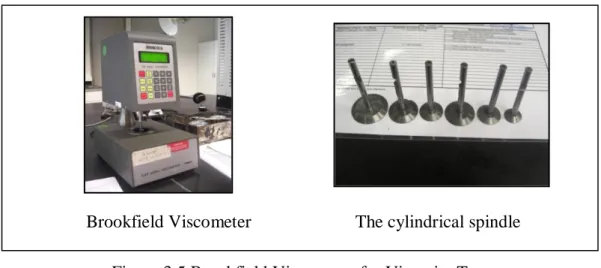
3.2.7.1 Brookfield Viscometer Test (ASTM D2171)
The test method is by using the Brookfield Viscometer. The apparatus is shown in Figure 3.5. The mean of values is reported from the three reading that will be taken.
The value of viscosity is observed at 135oC. This test is conducted by placing a drop of sample on the plate below spindle. The spindle rotated based on the specified shear rate. Value is reported based on the reading displayed after the test run.
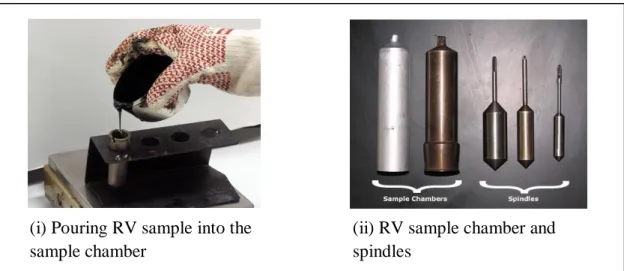
17 3.2.7.2 Rotational Viscometer (RV) Test (ASTM D4402)
Before start the test, spindle, sample chamber and viscometer environmental chamber is preheated to 275oF (135oC). The unaged bitumen sample is poured into sample chamber. The sample size varies according to the selected spindle and equipment manufacturer. The sample chamber is inserted into rotational viscometer temperature controller unit and carefully lower spindle into sample. Sample is brought to the desired test temperature (typically 275oF (135oC)) within approximately 30 minutes and allowed it to equilibrate at test temperature for 10 minutes. Spindle is rotated at 20 rpm, making sure the percent torque as indicated by the RV readout remains between 2 and 98 percent. Once the sample has reached temperature and equilibrated, take 3 viscosity readings from RV display, allowing 1 minute between each reading. Viscosity is reported as the average of 3 readings.
Figure 3.6 show the RV test setup.
The cylindrical spindle Brookfield Viscometer
(ii) RV sample chamber and spindles
(i) Pouring RV sample into the sample chamber
Figure 3.5 Brookfield Viscometer for Viscosity Test
Figure 3.6 The RV Test setup
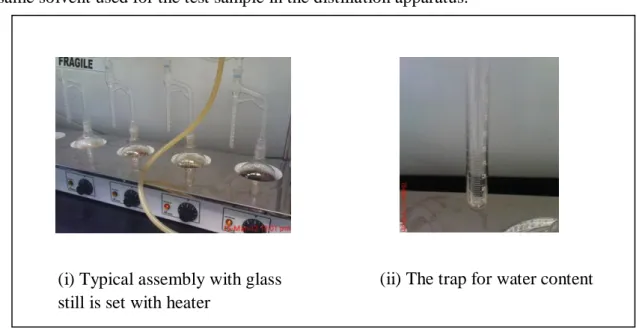
18 3.2.8 Water in Bitumen Test (ASTM D95)
In this test, the sample of bitumen is heated under reflux with water-immiscible solvent, which co-distills with the water in sample. Figure 3.7 shows the setup of water in bitumen test. Xylene is used as solvent. Xylene and sample is measured at suitable amount. Sample of bitumen is weighed directly into the still and 100ml of Xylene is added. A loose cotton plug is inserted in the top of condenser to prevent condensation of atmospheric moisture inside it. Cold water is circulated through the jacket of the condenser. The heat is applied to the still; the rate is adjusted so that condensed distillate discharges from the condenser at the rate of two to five drops per second. Continue distillation until no water is visible in any part of the apparatus except in trap and the volume of water in the trap remains constant for 5 minutes.
The volume of the water in the trap is read to the nearest scale division. The water content of solvent should be determined by distilling an equivalent amount of the same solvent used for the test sample in the distillation apparatus.
3.2.9 Flash Point Test (ASTM D92)
The flash point test is to define the lowest temperature at which application of a test flame causes the vapors above the surface of liquid to ignite. The test performed is the Cleveland Open Cup Flash Point. An open cup of bitumen is heated at a specified
(i) Typical assembly with glass still is set with heater
(ii) The trap for water content
Figure 3 The Water in Bitumen Test Setup Figure 3.7 The Water in Bitumen Test Setup
19 rate. At temperature intervals, a small gas flame is passed over the surface of the bitumen. A minimum flash temperature is required for each type of bitumen.
3.2.10 Loss on Heating Test (AASHTO T240-09)
This test method is useful in characterization certain bitumen by the determination of their loss of mass upon heating under standardized condition. About 50gm of the sample is weighed and heated to a temperature of 163oC for 5 hours in a specified oven designed for this test. The sample specimen is weighed again after the heating period and loss in weight is expressed as percentage by weight of the original sample.
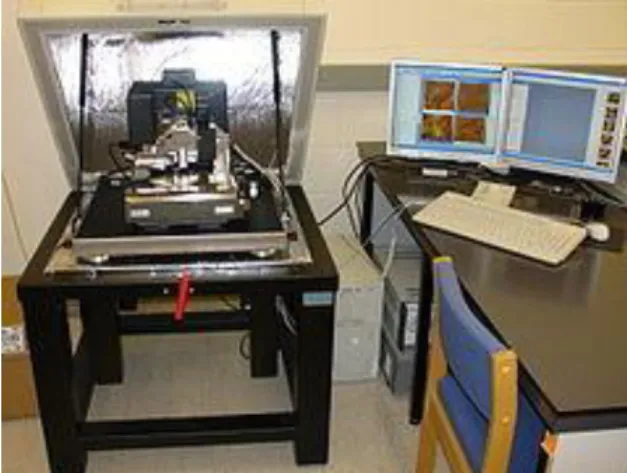
3.2.11 Atomic Force Microscopy (AFM)
The Atomic Force Microscopy test is to analyze the microstructure of bitumen. The AFM raster-scans the probe over a small area of the bitumen sample to acquire an image, measuring the local property simultaneously. AFM images give information in three dimensional topography and phase. Figure 3.8 shows the AFM test setup.
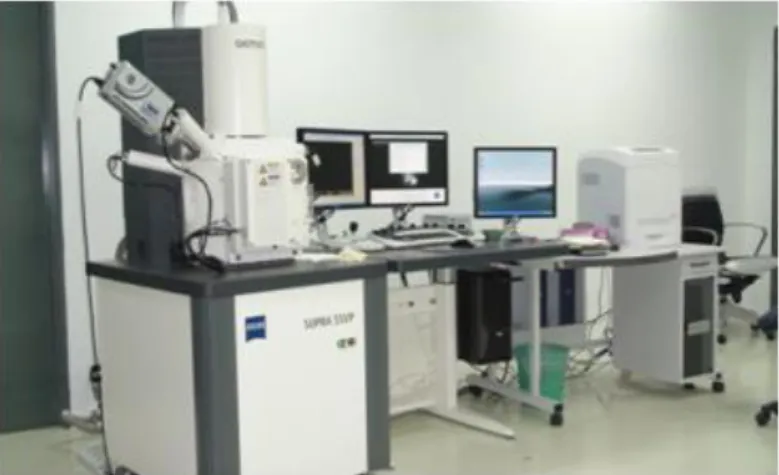
3.2.12 Field Emission Scanning Electron Microscopy
This test is to study the internal morphology of the bitumen. Scanning Electron Microscopy (SEM) emits a focused electron beam across a sample surface, providing high resolution and long depth of field images of the sample surface. Figure 3.9 shows the FESEM equipment.
Figure 3.8 The Atomic Force Microscopy Setup
20 3.2.13 X-Ray Diffraction (XRD)
The X-Ray Diffraction (XRD) test is used to analyze the dispersion structure in the bitumen. The radiation interacts with the electrons in atoms when X-ray radiation passes through matter resulting in scattering of the radiation. If the atoms are organized in planes and the distances between the atoms are of the same magnitude as the wavelength of the X-rays, constructive and destructive interference will occur.
3.2.14 Dynamic Shear Rheometer (DSR) Test (AASHTO TP5)
The viscoelastic properties of bitumen are determined by evaluating the behavior of bitumen sample when subjected to oscillatory stresses. The AASHTO TP5 standard test method requires that a thin of bitumen sample be sandwiched between two parallel metal plates held in a constant temperature medium. One plate remains fixed while the other oscillates, at an angular frequency of 10 radians per second for 10 cycles, with respect to the other. The dynamic shear rheometer evaluates the specimen‟s response to the sinusoidal stresses and calculates the bitumen‟s complex shear modulus and phase angle.
Figure 3.9 Field Emission Scanning Electron Microscopy
21 3.2.15 Pressure Ageing Vessel (PAV) Test (AASHTO PP1)
The Pressure Aging Vessel (PAV) simulates the age hardening of bitumen during the first 7-10 years of pavement service life (Roberts, et al., 1996). The AASHTO PP1 standard test method requires that the PAV expose RTFO aged residue to high pressure, 2.1 MPa, and high temperature over a 20 hour period to achieve accelerated hardening of the bitumen. The temperature should ranges from 90oC to 110oC. Ten bitumen specimens, 50 grams each, can be conditioned with each PAV run. The residue from the PAV is degassed in vacuum oven immediately following conditioning.
22
CHAPTER 4
RESULTS AND DISCUSSIONS
4.1 Standard Properties of Base Bitumen
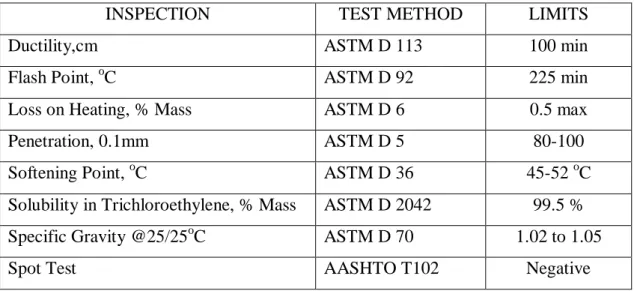
The standard properties based on Malaysian Standard MS124 1973 is tabulated in Table 4.1.
Table 4.1 Standard Properties of 80/100 Penetration Grade Bitumen
INSPECTION TEST METHOD LIMITS
Ductility,cm ASTM D 113 100 min
Flash Point, oC ASTM D 92 225 min
Loss on Heating, % Mass ASTM D 6 0.5 max
Penetration, 0.1mm ASTM D 5 80-100
Softening Point, oC ASTM D 36 45-52 oC
Solubility in Trichloroethylene, % Mass ASTM D 2042 99.5 %
Specific Gravity @25/25oC ASTM D 70 1.02 to 1.05
Spot Test AASHTO T102 Negative
4.2 Result of Bitumen Test 4.2.1 Penetration Test
Test is conducted for all samples. The result is as detail in Appendix 1 and summarize in Table 4.2.
Table 4.2 Summary Result of Penetration Test
Sample Average Penetration (mm)
P1 91.4
P2 69.2
S 73.1
23 The penetration value for sample P1 is 91.4 mm which is within limit of specification for 80/100 penetration grade. The values lie in upper range of specified grade which is softest bitumen compared to others. The penetration value for sample P2 is 69.2 mm which is harder than designated grade. It is because sample P2 is manually blended in refinery that may affect the hardness of bitumen. Whilst sample S contended that bitumen grade was 80/100 penetration, test reveal that sample S is harder than designated grade. The penetration value shows that sample P2 is hardest bitumen while sample P1 is softest bitumen.
4.2.2 Softening Point Test
The result obtained from the ring and ball test is as detailed in Appendix 2 and summarized in Table 4.3.
Table 4.3 Summary Result of Softening Point Test
Sample Average softening point (oC)
P1 44.3
P2 47.2
S 46.6
The softening point for sample P2 and S are within the limit of standard properties of bitumen. Sample P1 has been the lowest softening point which is in line with penetration test, as result became softest bitumen. Sample P2 also has the highest softening point. Increasing in softening point is favorable since it more resistance to permanent deformation (rutting) and low temperature cracking.
4.2.2.1 Penetration Index
The Penetration Index (PI) is a measure of temperature susceptibility for bitumen. It is a measure of the changes in hardness of the bitumen with changes in temperature.
The low value of PI indicates it has high temperature susceptibility. Penetration Index for P1, P2 and Shell bitumen are shown in Table 4.4. Nomograph for PI is shown in Appendix 3.
24 Table 4.4 Penetration Index for P1, P2, and Shell bitumen
Sample Softening Point (°C) Penetration Penetration Index
P1 44.3 91.4 -1.17
P2 47.2 69.2 -1.00
S 46.6 73.1 -1.83
The PI for all sample are within range of typical conventional paving bitumen which is between -2 and +2 (Whiteoak, D., 2003). The values above indicate that the Shell bitumen is most susceptible and P2 is least susceptible to temperature changes. The PI can be used to give a good approximation of the behavior to be expected.
4.2.3 Ductility Test
Due to machine constraint, the maximum length that could be determined is 157 mm, however, during the test, the sample did not rupture. Therefore, the ductility of the three samples was unobtainable under the conditions of the test.
If the bitumen came in contact with the surface of the water or the bottom of the bath, the test shall not be considered normal. The specific gravity of the bath should be adjusted by addition of either methyl alcohol or sodium chloride so that the bitumen either comes to the surface of the water, not touches the bottom of the bath at any time during the test. Since the thread in the test is sagging down, the water density was rose by adding salt, and the result is shown in Table 4.5.
Table 4.5 Ductility after adding sodium chloride
Sample Ductility (mm)
P1 130
P2 153.3
S 123.5
The entire samples meet the ASTM requirement for ductility which is more than 100 mm. Sample P2 exhibit the best ductility properties while sample S exhibit the worst ductility properties. It is quite easier to mix material with high ductility than mixing with low ductility. High ductility material is also easier to move from plant than the
25 one with low ductility. The lower the ductility, the probability of segregation problem is present, which leads to low durability because of unsuitable coating and high permeability.
4.2.4 Solubility in Trichloroethylene Test
The result obtained from the solubility test is as detailed in Appendix 4 and summarized in Table 4.6.
Table 4.6 Summary Result of Solubility Test
Sample % Soluble
P1 99.83
P2 99.95
S 99.93
In this test, the bitumen content should be retained for 80/100 penetration grade bitumen is more than 99.5 % of mass. Based on the result, all sample of bitumen has passed the ASTM requirement. The results obtain from the test is very little variation. Sample P2 exhibit least impurity while sample P1 exhibit highest impurity in the sample tested. Sample S and P2 are nearly to zero contamination.
4.2.5 Specific Gravity Test
The result obtained from the specific gravity test is as detailed in Appendix 5 and summarized in Table 4.7.
Table 4.7 Summary Result of Specific Gravity Test
Sample Relative Density Density (kg/m3)
P1 1.0275 1024.5
P2 1.0255 1023.0
S 1.0345 1031.5
The expected values for specific gravity are ranges from 1.02 to 1.05 according to ASTM requirement. From the test, all sample of bitumen are within the range of expected values. Sample S has a highest relative density, mean it is most dense compared to the sample P1 and P2.
26 4.2.6 Spot Test
The result obtain from the test is negative for all bitumen samples. The samples turn to produce brownish color after it was dropped onto the filter paper. It showed that all bitumen samples have not been damaged during processing due to overheating.
The undamaged bitumen tends to be more ductile and less susceptible to ageing effects. Figure 4.1 shows the result of spot test.
4.2.7 Viscosity Test
4.2.7.1 Brookfield Viscosity Test
The results obtain from the Brookfield viscosity test is as detailed in Appendix 6 and summarized in Table 4.8.
For this test, the viscosity reading should be ranged from 0.5 Pa*s to 0.8 Pa*s. It is concluded that the appropriate shear rate for this test condition is 4000/s as shows in Figure 4.2. Based on the result, it showed that the spindle 2 was the best spindle because all the readings were in the viscosity range.
Figure 4 Spot test without nuclei indicates negative result
27 Table 4.8 Viscosity at shear rate 4000/s
Viscosity (Pa*s)
No. Spindle P1 P2 S
1 0.522 0.52
2 0.532 0.779 0.559
3 0.968 0.823 0.65
4 X X X
5 X X X
6 X X X
Figure 5 Combination of Viscosity vs Shear Rate for all
The highest viscosity readings are sample P2, 0.779 Pa*s, followed by sample S, 0.559 Pa*s and least viscous is sample P1 with 0.532 Pa*s. Sample P2 exhibit highest viscosity while sample P1 exhibit lowest viscosity at shear rate 4000/s. The results show that it is in line with both penetration and softening point test. The high value of viscosity indicates that the low fluidity of bitumen. Thus, harder bitumen will obtain higher value of viscosity.
Bitumen binder easily lubricates the aggregate particle at low viscosity while high viscosity does not able the bitumen to coat the entire surface of aggregate in the mixing. This show that sample P2 and Shell have high viscosity and it required higher mixing, compaction and laying temperature than sample P1.
0 0.5 1 1.5 2
0 1000 2000 3000 4000 5000 6000 7000 8000
Viscosity (pa*s)
Shear rate (1/s)
P1 P2 SHELL
28 4.2.7.2 Brookfield Rotational Viscometer Test
The result for Brookfield rotational viscometer test is tabulated in Table 4.9, Table 4.10 and Table 4.11.
Table 4.9 Viscosity for PETRONAS 1 bitumen
Test Run Viscosity (cP) Viscosity (Pa*s)
P1-1 350.0 0.3500
P1-2 362.5 0.3625
P1-3 362.5 0.3625
Average 358.3 0.3583
Table 4.10 Viscosity for PETRONAS 2 bitumen
Test Run Viscosity (cP) Viscosity (Pa*s)
P2-1 462.5 0.4625
P2-2 475.0 0.4750
P2-3 475.0 0.4750
Average 470.8 0.4708
Table 4.11 Viscosity for SHELL bitumen
Test Run Viscosity (cP) Viscosity (Pa*s)
S1-1 375.0 0.3750
S1-2 375.0 0.3750
S1-3 375.0 0.3750
Average 375 0.3750
The Strategic Highway Research Program (SHRP) binder specifications for pumpability require a maximum bitumen viscosity limit of 3 Pa.s when tested at 135oC. As shown in Table 4.9 through Table 4.11, each viscosity reading at specified temperature is well below the 3 Pa.s limit, thus meeting the SHRP binder performance specifications. Sample P2 exhibit highest viscosity while sample P1 exhibit lowest viscosity. The results show that it is in line with both penetration and softening point test result.
29 4.2.8 Water in Petroleum Test
The result for water in petroleum test is tabulated in Table 4.12.
Table 4.12 Water content (%) for all samples
Sample Mass (g) Trapped water (ml) Water content (%)
P1-1 104.090 7.7 0.192
P1-2 100.675 7.7 0.199
P1 Average Water Content (%) 0.20
P2-1 101.015 7.7 0.198
P2-2 102.542 7.6 0.098
P2 Average Water Content (%) 0.15
S-1 103.601 7.6 0.097
S-2 100.717 7.6 0.099
S Average Water Content (%) 0.10
From the result, it shows that all the sample of bitumen has achieved below 0.2 % of water content which is in agreement with the specified requirement. Sample S has a lowest water content while sample P1 shows a highest water content. In term of safety, bitumen should has low water content to prevent foaming of bitumen when it is heated above the boiling point of water.
4.2.9 Flash Point Test
The result for flash point test is tabulated in Table 4.13.
Table 4.13 Results for Flash Point Test for all samples
Sample ID P1 P2 S1
Visual Appearance Normal Normal Normal
Flash Point (DegC) 324.0 326.0 336.0
ASTM specification for 80/100 penetration bitumen for flash point is more than 225oC. From the test, all sample of bitumen has meet the minimum requirement for flash point. Sample S bitumen has the highest value of flash point, followed by sample P2 and P1. This result related to the hardening potential of bitumen. With the
30 high flash point, the bitumen likely to have a lower hardening potential in the field.
The minimum flash point requirement for bitumen because of safety reason. The sample of P1 and P2 likely to have high vapour content compared to Shell bitumen.
4.2.10 Loss on Heating Test
Sample with low volatile component expected to exhibit mass gain while sample with high volatile component expected to exhibit mass loss. The result for loss on heating test is tabulated in Table 4.14 and 4.15.
Table 4.14 Mass Loss/ Gain after RTOF for P1 and P2 bitumen
SAMPLE NUMBER P1 bitumen P2 bitumen
P1-1 P1-2 P2-1 P2-2
Mass of Specimen, g (A) 34.65 36.02 35.32 36.02 Mass of Specimen After RTFOT, g
(B)
34.55 35.91 35.25 35.96
Mass Loss, ( ) 100%
A B
A 0.289 0.305 0.198 0.167
Average, % 0.297 0.182
Table 4.15 Mass Loss/Gain after RTOF for SHELL bitumen
SAMPLE NUMBER SHELL bitumen
S1-1 S1-2
Mass of Specimen, g (A) 36.23 35.85
Mass of Specimen After RTFOT, g (B) 36.24 35.86
Mass Gain, ( ) 100%
A A
B 0.028 0.028
Average, % 0.028
The test results show that all sample tested is less than 1% in terms of its mass loss or gain due to heating as AASHTO requirement which indicate that this loss or gain is not significant. Sample S bitumen exhibit mass gain while sample P exhibit mass loss. The results are expected as the sample that has low volatile content will experience mass gain. This is in line with the result obtained from flash point test.
31 4.2.11 Atomic Force Microscopy (AFM) Test
The three dimensional (3D) images is form of the “bee” structure show protruding tubers from the surface indicative of concentration of asphaltene. Differences in these 3D images are indicative that the concentration of asphaltene may vary with different bitumen from different crude sources. Figure below show that result of AFM test.
PETRONAS 1
PETRONAS 2
SHELL
Figure 6.3 Sample Petronas 1; 2D Phase Figure 7 Sample Petronas 1; 3D phase
Figure 8 Sample Petronas 2; 2D phase Figure 9 Sample Petronas 2; 3D phase
Figure 11 Sample Shell; 2D phase Figure 10 Sample Shell; 3D phase
32 The AFM image arises from changes in composition and stiffness across a sample surface. The greater the contrast between the domains in friction image, the greater is the difference in stiffness and composition (Baumgardner et al, 2006). The appearance of „bee-like‟ structure may be attributed to the crystallization of the wax or waxy molecules in asphaltene. Sample S indicates of higher asphaltene content while sample P1 indicates of lowest asphaltene content from the dense packing of the imaged obtained. High asphaltene content indicates that sample S may be difficult to ignite and burn.
The contrast between the dispersed phase and the matrix was increased as indicated through Figure 4.4, 4.6 and 4.8. It is reasonable to assume that the stiffness of the matrix in bitumen is increased according to the contrast changes, as a result, the whole stiffness of the bitumen is clearly increased, which leads to the hardening of bitumen.
4.2.12 Field Emission Scanning Electron Microscopy (FESEM) The structured of bitumen for all sample are shown in figure below for magnification at 1.00kx and 200x. The figure 4.9, 4.10 and 4.11 show the image of internal morphology of each samples.
Figure 12 The Internal Morphology of Sample P1
33 Based on the morphology structure result, sample S shows greatest compactness morphology phase of the bitumen. This could be related that sample S had a higher viscosity. While for sample P1 and P2, there are show quite similar phase for both sample which are less compact compared to sample S. Sample P1 shows least compactness as a result it has less viscous than others. This result may indicate greater amount of energy required to break down the Shell bitumen particle compared to PETRONAS bitumen.
Figure 13 The Internal Morphology of Sample P2
Figure 14 The Internal Morphology of Sample S
34 4.2.13 X-Ray Diffraction (XRD) Test
XRD diffractograms for bituminous sample from various sources are shown in Figure 4.12. The diffractograms of the samples show that only P1 bitumen has the intense peak compared to bitumen from sample P2 and Shell. The peak shows the crystalline phases that present in the sample. The crystalline phases of the samples can be identified by matching the peak position and relative intensities, comparing the chemical composition as well as the sample spectrum with the spectra of known crystalline substance. The width of the peak can vary depending on the crystalline size. Smaller size will result in widen peak due to the incomplete destructive interference.
From Figure 4.12, the diffractograms show the diffraction at 2θ = 26.29o (peak 1) which correspond to carbon hydrogen (C24H18), diffraction at 2θ = 37.57o (peak 2) correspond to carbon vanadium oxide (VCxOz) and diffraction at 2θ = 51.36o
s1
Operations: Smooth 0.150 | Import
s3 - File: s3_shell.raw - Type: 2Th/Th locked - Start: 2.000 ° - End: 80.000 ° - Step: 0.020 ° - Step time: 1. s - Temp.: 25 °C (Room) - Time Started: 11 s - 2-Theta: 2.000 ° - Theta: 1.000 ° - Chi: 0.00 ° - Operations: Smooth 0.150 | Y Scale Mul 1.167 | Import
s2 - File: s2_pet2.raw - Type: 2Th/Th locked - Start: 2.000 ° - End: 80.000 ° - Step: 0.020 ° - Step time: 1. s - Temp.: 25 °C (Room) - Time Started: 11 s - 2-Theta: 2.000 ° - Theta: 1.000 ° - Chi: 0.00 ° - Operations: Smooth 0.150 | Y Scale Mul 2.000 | Y Scale Mul 1.600 | Y Scale Mul 2.000 | Import
s1 - File: s1_pet1.raw - Type: 2Th/Th locked - Start: 2.000 ° - End: 80.000 ° - Step: 0.020 ° - Step time: 1. s - Temp.: 25 °C (Room) - Time Started: 14 s - 2-Theta: 2.000 ° - Theta: 1.000 ° - Chi: 0.00 ° -
Lin (Counts)
0 10 20 30 40 50 60 70 80 90 100 110 120 130 140 150 160 170 180 190 200 210 220 230 240 250 260 270 280 290 300 310 320 330 340
2-Theta - Scale
11 20 30 40 50 60 70
P1 P2 S1 Peak 1
Peak 2
Peak 3
Figure 15 XRD result for bitumen
35 (peak 3) correspond to carbon sulfide (CS2). The crystallite size for every peak was estimated from the XRD diffraction using Scherer‟s equation base on line broadening. Table 4.16 show the estimated crystalline size of the peak obtained in sample P1. The result shows that the crystallite size for all peaks is slightly same.
Peak 1 Peak 2 Peak 3
Element presents C24H18 VCxOz CS2
Intensity (counts) 213 186 93.6
FWHM, β 0.301 0.31 0.334
d-spacing (Å) 3.389 2.392 1.777
Crystallite size (nm) 4.945 4.949 4.817
Table 4.16 Intensity (counts), FWHM, d-spacing, and crystallite size of the obtained peaks
Any disturbance from the diffractogram obtained is indicated level of impurities in the bitumen. SHELL bitumen exhibit most stable condition during test. Sample P2 also exhibit a stable condition. Sample P1 exhibit least stable with 3 peaks indicate of possible impurities. The SHELL and P2 samples did not exhibit any intense peaks which portray them to be more amorphous and homogeneous.
4.2.14 Dynamic Shear Rheometer (DSR) Test
The result obtained from the specific gravity test is as detailed in Appendix 7 and summarized in Table 4.17.
Table 4.17 Summary of Dynamic Shear Rheometer Result
Sample |G*| in Pa G' in Pa G" in Pa δ in ° tan δ
P1-1 2024.4 54.017 2023.7 88.472 0.555958
P1-2 2053.9 46.797 2053.6 88.695 0.895648
P1-3 2014.5 73.067 2013.1 87.920 -0.04462
P1 2030.9 57.960 2030.1 88.362 0.420131
P2-1 3152.4 115.955 3150.2 87.890 -0.07473
P2-2 3372.5 145.790 3369.5 87.522 -0.47395
P2-3 3312.3 146.740 3309.1 87.461 -0.55098
P2 3279.1 136.162 3276.3 87.624 -0.35403
S-1 2361.4 34.603 2361.1 89.159 2.53015
36
S-2 2432.7 20.310 2432.6 89.522 74.67464
S-3 2250.4 12.478 2250.3 89.682 -6.77191
S 2348.2 22.464 2348.0 89.454 12.30992
The complex modulus (G*) can range from about 0.07 to 0.87 psi (500 to 6000 Pa), while the phase angle (δ) can ranges from about 50 to 90°. A δ of 90° is essentially complete viscous behavior. Polymer-modified asphalt binders generally exhibit a higher G* and a lower δ. This means they are, in general, a bit stiffer and more elastic than unmodified bitumen.
For all samples, the loss modulus G” is higher than the storage modulus G‟. This means than the material behavior are visco-elastic liquid. Tangent of phase angle (δ) is the measure of viscous over elasticity of a material, in other word, the loss modulus over storage modulus. G*/sin δ > 1.0 kPa is AASHTO requirement for virgin bitumen. G* reflects resistance to deformation of bitumen in service.
From the DSR test conducted to the three samples, P2 bitumen is found to have largest complex modulus, followed by SHELL and P1. The phase angle is highest in SHELL bitumen followed by P1 and P2. The larger the phase angle (δ), the greater is the viscous of material. Therefore, P2 bitumen is stiffer and more elastic than other samples. The sample exhibited best property against deformation.
4.2.15 Pressure Ageing Vessel (PAV) Test
The result of penetration before and after PAV test is shown in Table 4.18. The result of softening point before and after PAV test is shown in Table 4.19. The
corresponding result of rotational viscometer before and after PAV test is shown in Table 4.20.
Table 4.18 Average penetration before and after PAV Sample Before PAV
(dmm)
After PAV (dmm)
Penetration Difference
% Different
P1 91.4 25.9 65.5 71.7
P2 69.2 20.4 48.8 70.5
S 73.1 30.8 42.3 57.9
37 Higher values of penetration indicate softer consistency of bitumen. The penetration value after PAV test for sample P1 is 25.9 dmm, sample P2 is 20.4 dmm and sample S is 30.8 dmm. After PAV test has been conducted to the three samples, the penetration values decrease indicating the bitumen becomes harder by ageing. The hardest bitumen is PETRONAS 2 bitumen followed by PETRONAS 1 bitumen and SHELL bitumen. In RTFOT minimum retained penetration must be greater than 47%
(ASTM). This test shows that the ageing rate in PETRONAS bitumen is fastest as compared to SHELL bitumen which makes it more susceptible to deformation on a long term basis.
Table 4.19 Average Softening Point before and after PAV (°C)
Sample Before PAV After PAV Increase % Increase
P1 44.3 54.7 10.4 23.5
P2 47.2 60.2 13 27.5
S 46.6 52.0 5.4 11.6
The softening point value is the temperature in which bitumen change from solid to liquid. The lower the softening point of bitumen is the lower the temperature in which bitumen can be used in. After PAV test, the softening point of all samples increase, and the highest softening point after PAV is PETRONAS 2 bitumen with 60.2 °C followed by PETRONAS 1 bitumen which is 54.7 °C and SHELL bitumen is 52.0oC.
Table 4.20 Average reading of RV before and after PAV (cP)
Sample Before PAV After PAV Increase % Increase
P1 358.3 837.5 479.2 133.7
P2 470.8 1349.7 878.9 186.7
S 375.0 700.0 325.0 86.7
Viscosity shows how bitumen behaves at given temperature or over a temperature range. After PAV test, the viscosities for all samples increase. The highest viscosity is PETRONAS 2 bitumen with 1349.7 cP followed by PETRONAS 1 bitumen with 837.5 cP and SHELL bitumen with 700 cP.
38 From the retest of Penetration, Softening Point, and Rotational Viscometer test, it is concluded that ageing rate in PETRONAS bitumen is fastest as compared to SHELL bitumen which makes it susceptible to fatigue and cracking.