CERTIFICATION OF APPROVAL
The Effect ofConcentration ofSurfactant in Enhanced Oil Recovery (EOR):
Viscosity and pH
by
Rusilah Binti Mustakim
A project dissertation submitted to the Chemical Engineering Programme Universiti Teknologi PETRONAS in partial fulfillment of the requirement for the
BACHELOR OF ENGINEERING (Hons) (CHEMICAL ENGINEERING)
Approved by,
^4=
(Bawadi Bin Abdullah)
UNIVERSITI TEKNOLOGI PETRONAS
TRONOH, PERAK
PUSATJ&IUMBSeQ^KT.iiMAT UNIVERSITI TEKNOLOGI PLTRONAS
^ UNIVERSITI TEKNOLOGI PETRONAS
Information Resource Center IN
IPB184383
CERTIFICATION OF ORIGINALITY
This is to certify that I am responsible for the submitted in this project, that he original work is my own except as specified in the references and acknowledgements, and that the original work contained herein have not been undertaken or done by unspecified sources
or persons.
czj^S
RUSILAH BINTI MUSTAKIM
i n
ABSTRACT
Enhanced Oil Recovery or EOR is an advanced recovery methods used to recover more oil at the greater extent. Presently, the challenge in most oil companies is to find new methods and techniques to increase oil recovery or OIIP in their present
producing oil fields so that it would cater the ever increasing demand of the natural
resources.
Applications of engineering and technology are crucial in order to make the attempts possible, and the development of Enhanced Oil Recovery (EOR) techniques is one of study of interest to increase the current oil production efficiency. Chemical EOR is a derivative of the EOR methods and this technique is
considered successful as it applies the usage of surfactants in lowering the interfacial tension of the oil and the rock, thus boosts oil production capability.Thus, it is crucial for these surfactants to be studied and evaluated especially on its
physical-chemical properties so that they can be fully utilized and ultimately, able to
increase oil recovery rate.
In this study, experimental works was carried out at Universiti Teknologi
Petronas laboratory. The concentration of the surfactant is varied and the effect tothe phase behavior, viscosity and pH was observed. For the determination of phase
behavior, the method is carried out by simulating the surfactant samples in reservoirtemperatures in a specialized oven and it is left by a specified time. The
classification results are done by physical observation of the samples. As forviscosity determination, viscometer is used to obtain the results. For pH
determination, pH indicator was used.
For Phase Behavior identification, most of the samples yield type II-, a fair desirable results, and a few of samples managed to obtain type III. The viscosity
and pH ofthe solution is increased as the concentration ofthe surfactant increase. In overall, the experimental works yield desirable phase behavior results and verified
the increment of viscosity and pH.
IV
ACKNOWLEDGEMENTS
First and foremost, I would like to express my gratitude towards God, with the mercy and blessings; I manage to complete my Final Year Research Project
successfully.
This research project is not possible without productive contributions and guidance
of individuals and experts. I would like to express my sincere thanks to supervisor, Mr. Bawadi Abdullah for giving me the opportunity for assigning me to this projectand gave a lot of guidance in this research. I also like to thank Dr. D.M Anwar Raja
that has contribute to me a lot of information regarding this research. Special thanks to the PRSS staff, ultimately to Pn. Fauziyah, EOR Senior Chemist and En. Zaimin,
EOR technician for giving full cooperation, guidance and support to me through the research completion. My thoughtful appreciation also goes to the lecturers that have also gave useful guidance and advice during the preparation ofthis research project.
Finally, to my colleagues and friends, who also has given a great deal of
contribution and moral support in terms of references and useful information.v
TABLE OF CONTENTS
CERTIFICATION ii
ABSTRACT iv
ACKNOWLEDGEMENTS v
CHAPTER1: INTRODUCTION 1
1.1 Background of the Study 1
1.2 Problem Statement 4
1.3 Objectives and Scope of Study 4
CHAPTER 2: LITERATURE REVIEW AND THEORY 5 2.1 Surfactants: Basic Principles 5 2.2 Surfactants in Enhanced Oil Recovery 8 2.3 Physical Properties of Surfactants 11
CHAPTER 3: METHODOLOGY AND PROJECT WORK 17
3.1 Project Flow Cycle 17
3.2 Chemicals 19
3.3 Experimental Procedures 19
CHAPTER 4: RESULTS AND DISCUSSION 21
4.1 Phase Behavior Identification 21 4.2 Viscosity and pH Determination 27
CHAPTER 5: CONCLUSION AND RECOMMENDATION 32
5.1 Conclusion 32
5.2 Recommendations 33
REFERENCES 34
APPENDIX A 35
APPENDIX B 39
VI
LIST OF FIGURES
Figure 1 Structure of Surfactant Molecule Figure 2 Surfactant in oil-water system
Figure 3 Oil Drop Stuck in a Capillary (Before Adding Surfactant) Figure 4 The addition of surfactants enables the oil droplets to elongate
Figure 5 Chemical Flooding Process
Figure 6 Ternary Phase Diagrams on Evaluating Phase Behavior ofSurfactants Figure 7 The resistance to flow of a fluid and the resistance to the movement ofan
object through a fluid
Figure 8 Viscosity-Temperature Profile of 6% Surfactant in
3% KC1 Brine
Figure 9 Phase Behavior Result (Sample A) Figure 10 Phase Behavior Result (Sample B) Figure 11 Phase Behavior Result (Sample C) Figure 12 Phase Behavior Result (Sample D) Figure 13 Phase Behavior Result (Sample E) Figure 14 Optimal Packing at Interface Figure 15 Phase type III
Figure 16 Viscosity versus Concentration Figure 17 pH versus Concentration
Figure 18 Recovery Methods Available in Petroleum Industry
Figure 19 ASP Flooding Illustrationvii
Figure 20 Schematic Diagram of SteamFlooding
Figure 21 Schematic Diagram of C02 Miscible Flooding Figure 22 Cross Section of Typical Surfactant Flood
Figure 23 Ternary Diagram Representation of Surfactant Phase Behavior
Figure 24 Phase Behavior Surfactant - Brine - Oil
LIST OF TABLES
Table 1 Tertiary Recovery Methods
Table 2 Surface Phase Type Description of Surfactant Table 3 Preparation Sample
Table 4 Phase Behavior Results
Table 5 Performance Division of Phase Behavior Result Table 6 Results of viscosity and pH
v i n
CHAPTER 1 INTRODUCTION
1.1 Background of the Study
Primary methods recover approximately 10- 20 % of oil production, while water flooding can increase recovery factor up to 40 - 60%. Even though 100% recovery is not conceivable, there is apparently considerable scope for improving the recovery efficiency through enhanced oil recovery (EOR) technology [1]. The industry interest in chemical flooding is evidenced by the number of field
applications initiated in the last decade. It is observed that chemical flooding have
yield between 5 - 16% additional oil recovery worldwide [2].The technical success factors for any chemical EOR projects are governed by the ability of injected chemicals to mobilize residual oil and stabilize flood front. The
primary investigation of this study is to focus on observing the phase behavior
between the oil and the flood for every different concentration and also others parameter such as viscosity and pH.A reservoir can be defined as subsurface, porous, and permeable rock body in which
hydrocarbon (oil and gas) is found. It is confined by impermeable rock and rock
barriers that functions to trap the hydrocarbon reserves. A typical reservoir isnaturally confined within elevated temperatures and pressures, and this serves as the potential energy mechanism when the reservoir is drilled. It is the ultimate interest
for the oil to be recovered, and basically the recovery mechanisms that are used areprimary or natural methods where oil can flow naturally to the surface, secondary
methods where water flooding take place, and tertiary or enhanced oil recovery
methods.
Technically, the factors of the unrecoverable oil within the reservoir is due to poor mobility control or arising from heterogeneity, or is trapped by capillary forces, as a
1
result from the high interfacial tension between the reservoir crude oil and water.
Realizing the challenges and constraints faced, EOR remained the main interest to improve the oil recovery up to its maximum capability. Chemical Flooding is one
of the effective methods used for EOR. Chemicals enhanced oil recovery (EOR)
includes processes in which chemicals are injected to improve oil recovery.
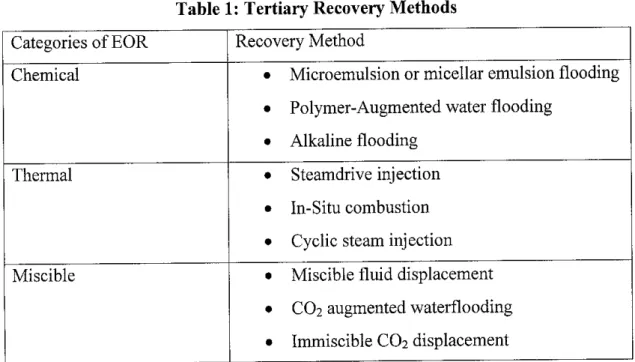
Chemical methods are one of three categories of EOR, the others being thermal and miscible. Table 1 shows the different processes in these categories. It applies the usage of surfactants, in which of its capability to reduce the interfacial tension
between the oil and water. In contrast to other EOR methods, Chemical EOR
(CEOR) processes are applicable to a wide range of reservoir conditions, with small dependence of temperature and pressure property changes.
Table 1: Tertiary Recovery Methods Categories of EOR Recovery Method
Chemical • Microemulsion or micellar emulsion flooding
• Polymer-Augmented water flooding
• Alkaline flooding
Thermal • Steamdrive injection
• In-Situ combustion
• Cyclic steam injection
Miscible • Miscible fluid displacement
• CO2 augmented waterflooding
• Immiscible C02 displacement
Surfactants can be defined as a compound that spreads along surfaces, materials,
particles, or droplets, that would lead changes of the surface properties.
Classification of surfactants can be divided to two, which is ionic and cationic.
Applications of these surfactants rely on specific usage in industries such as
detergents, soaps, personal hygiene care products, and even chemical processes.
Development of surfactant technology has made it feasible to be applied in EOR
methods.
In EOR, the mechanism of surfactant is initiated by injection with solution
containing low concentration of surfactant. The surfactant is dissolved in either
water or oil and is in equilibrium with aggregates of the surfactant known as micelles. Large pore volumes of the solution are injected into the reservoir to reduce interfacial tension between oil and water and thereby, increase of oilrecovery.
Surfactants are primarily used in CEOR and it is normally associated with polymer to function as the mobility control. Apparently, surfactants are not only applied in CEOR methods, but to other industrial applications as well, especially in producing
detergents, household cleaning products, and hygiene care products. This can be explained by its unique molecular structure and characteristics, which involves hydrophilic and hydrophobic properties. In its role for EOR, the usage of
surfactants is essential in order to reduce the interfacial tension (IFT), and ability to
alter the physico-chemical properties between the oil and the water within the reservoir. This explains why the physico-chemical properties are the main focus in evaluating and analyzing surfactants. Such properties that are studied are IFT, Critical Micelle Concentration (CMC), Phase Behavior, Kraft Point, Cloud Point, and Adsorption Level.
1.2 Problem Statement
Explicitly, the concern of this project is to conduct experimental work and analysis of the selected surfactant used in EOR. The study is aimed to understand the phase behavior of oil and water at the presence of surfactants. In detail, the concern is to determine the phase behavior, viscosity and pH at various concentrations. Thus, in order to acknowledge the task, it is fundamental to equip basic knowledge of Enhanced Oil Recovery and Surfactants in the petroleum industry.
1.3 Objectives and Scope of Study
The main objectives of the project are:
• To perform an understanding of Enhanced Oil Recovery (EOR)
• To understand about surfactants and its applications in EOR.
• To observe the effect of surfactant concentration on phase behavior, viscosity and pH value.
The scopes of the study are:
• Observe the phasebehavior at various surfactant concentrations.
• Observe the viscosity at various surfactant concentrations.
• Observe the pH value at various surfactant concentrations.
CHAPTER 2
LITERATURE REVIEW AND THEORY
2.1 Surfactants: Basic Principles
Surfactants are wide used and find a very large number of applications because of their remarkable ability to influence the properties of surfaces and interfaces.
Surfactants may be applied or encountered at all stages in the petroleum discovery
and processing industry, from oil well drilling, reservoir injection, oilwell production and surface plant processes, to pipeline and seagoing transportation of
petroleum emulsions.
A surfactant is a polar compound, consisting of an amphiphilic molecule, with a
hydrophilic part (anionic, cationic, amphoteric or nonionic) and a hydrophobic part.
Addition of surfactant to oil-water mixtures reduces interfacial tension and/or alters wettability. Depending upon the nature of the hydrophilic group, the surfactants are
classified as:
1. Anionic - the surface-active portion of the molecule bears a negative charge (e.g.,RC6H4S03-Na+, alkyl benzene sulphonates).
2. Cationic - the surface-active portion bears a positive charge (e.g., RNH3+C1-, salt of a long chain amine).
3. Amphoteric (or) zwitterionic - both positive and negative charges may be present in the surface-active portion (e.g., RN+H2CH2COO-, long chain
amino acid).
4. Nonionic - the surface-active portion bears no apparent ionic charge (e.g., RCOOCH2CHOHCH2OH, monoglyceride of long chain fatty acid).
Anionic surfactants are the mostly applied chemical type in chemical enhanced oil recovery. This class in itselfcontains a very wide range in molecular structure and functional groups, and therefore a wide range of properties can be identified.
Anionic surfactants as a class are the least adsorbed onto common negatively
charged solid surfaces like reservoir rock, which has the advantage in CEOR that it minimizes adsorption losses. Certain types of anionic surfactant can be manufactured relatively and inexpensively, and this explains it is economically feasible for it to be applied in chemical flooding.
Surfactant is contraction of the term "surface active agent," which generally
describes their primary attribute. These chemicals tend to spontaneously
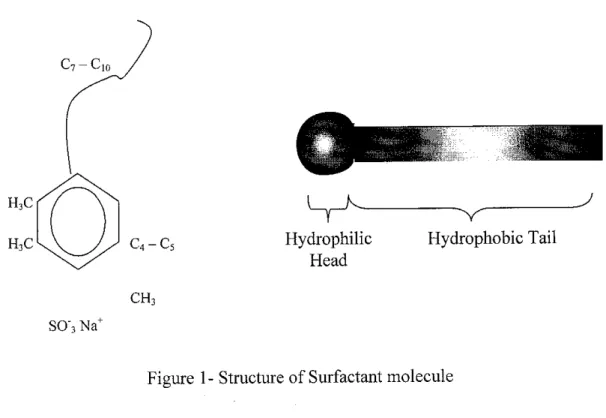
concentrate at the interface or "surface" between immiscible fluids or between a fluid and solid due to their unique chemical structure. The surfactant molecule will have a portion that is attracted to one fluid or solid phase which termed as hydrophilic, and another portion that repels the phase (hydrophobic). Figure 1 illustrates an example of a surfactant molecule.
H,C
HiC
SO"3 Na+
C4 - C5
CHi
Hydrophilic
Head
Hydrophobic Tail
Figure 1- Structure of Surfactant molecule
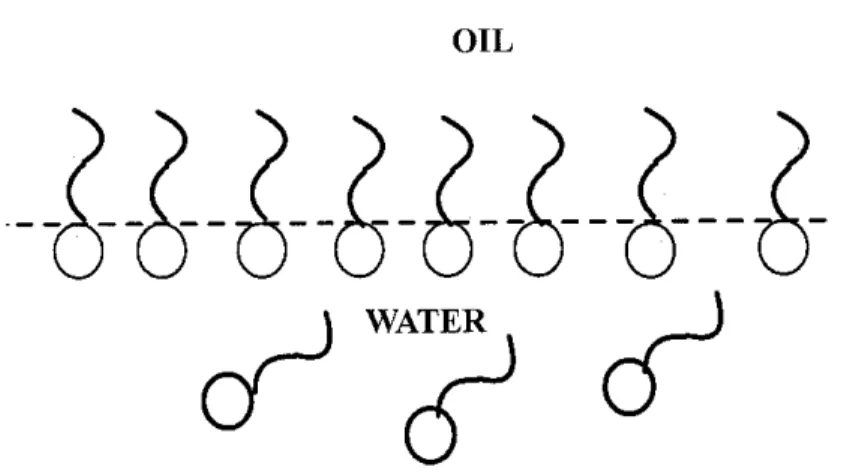
As explained initially, the molecule of a surfactant comprises of hydrophilic and hydrophobic structure. The jargon hydrophilic can be referred as the "head" and deemed as water loving portion that contains polar and ionic characteristics that would readily dissolve in water. Meanwhile, the hydrophobic structure is referred as the 'tail' of the surfactant, in which they will repel water. These types of structure causes the molecules to orient themselves so that the hydrophilic structure is within the solvent and the hydrophobic structure is away from it, thus concentrating at an interface (Figure 2).
OIL
Figure 2 - Surfactant in oil-water system
When a surfactant is dissolved in oil, the solvent molecules in the bulk solution (oil and water) interact within similar molecules within the solvent, but at the interface, they interact with dissimilar molecules, causing those at the surface to have higher potential energy. The surfactant molecules at the interface reduce this force imbalance or surface tension. Consequently, as the surfactant molecules concentrate at the interface, longer work is required to move a molecule of solvent from the bulk solution to the interface than for moving a surfactant molecule. The surfactants then increase the free energy of the system, or referred as the Gibbs free energy. The association of free energy with the interfacial phenomena is advantageous because
the total free energy change can be attributed to the sum of contributions of free energy change by individual molecular structural groups.
2.2 Surfactants in Enhanced Oil Recovery
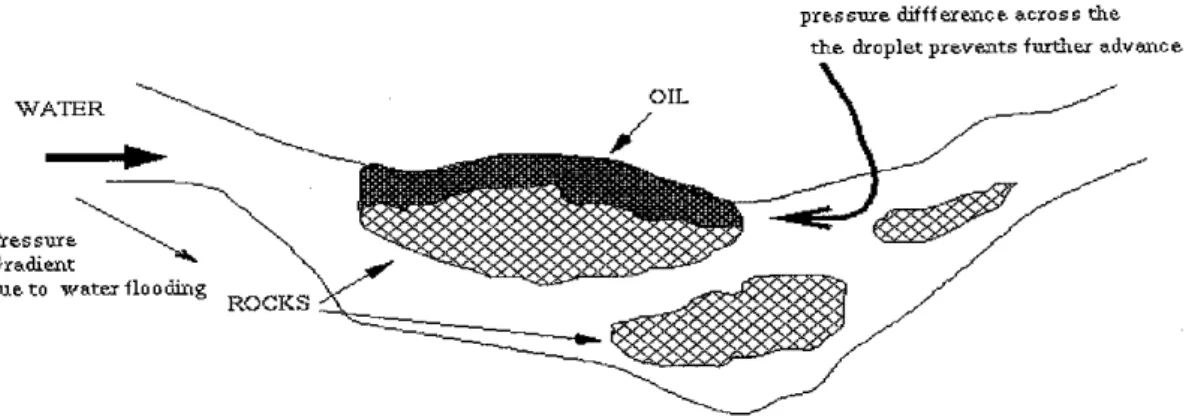
Some 40-60% of the original oil in a field typically remains trapped (Figure 3) in the reservoir after primary and secondary recoveries. Enhanced oil recovery is the attempt to recover this remaining oil reserves through different techniques like surfactant flooding. It is important economically to recover as much of the remaining oil as possible.
WATER
Pres sure Gradient due to water flo
pressure difference across the the droplet prevents further advance
Figure 3 - Oil Drop Stuck in a Capillary (Before Adding Surfactant)
Oil canbe recovered in the initial primary process by using the natural energy of the reservoir. This is followed by the secondary process of water injection into the porous rocks to maintain the pressure and facilitate oil displacement.
Most of the oil remaining after these processes is left behind in the pores of the rocks - capillary retention force is essentially responsible for resistance to further
recovery displacement by these techniques.
Aquick calculation of the pressure gradient across the hemispherical meniscus in the capillary for typical values of pore radius and interfacial tension before the addition of surfactants gives us values that are at least a couple of orders of magnitude greater than typically maintainable in an oil reservoir - hence the oil drop
gets stuck in the capillaries.
Therefore reduction of the interfacial tension using surfactants becomes the most practical way of recovering the oil left after water-flooding.
Two major techniques to do so are:
. Microemulsion flooding: A fluid which under normal circumstances is immiscible in oil but the addition of sufficient concentration of a surfactant to causes the fluid and oil to become miscible (this requires lowering of the interfacial tension to values less than 0.001 dynes/cm). Once the two are
miscible the oil flows with the injected water without getting trapped further and can be recovered once it comes out of the well.
. low concentration micellar surfactant flooding: this method reduces the oil/water interfacial tension (without making them miscible). Areduction m
the capUlary retention force becomes typically icss than the pressure gradren maint inable by water-flooding hence the droplets do not get stuck mthe
Zlies anylre. Prgure 4illustrate addltion of surfactants capillar, no
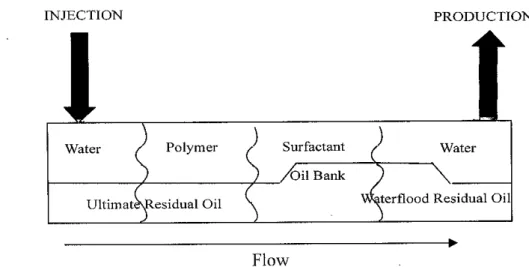
fluid production rate remains unchanged, the increase in oil cut is proportional to the increase of oil production rate.
INJECTION PRODUCTION
Water / Polymer / Surfactant / Water 'Oil Bank
UltimateXResidual Oil aterflood Residual Oil
Flow
Figure 5 - Chemical Flooding Process
2.3 Physical Properties of Surfactant: Phase Behavior, Viscosity and pH
2.3.1 Phase Behavior
Phase Behavior in surfactant property evaluation is normally represented by phase diagrams. These diagrams are used to explain the behavior of surfactant systems. A typical diagram that is used is ternary phase diagram, which associates three different components, which are surfactant, brine and oil. In reservoir ternary diagrams, the components represented no longer true portray true thermodynamic components since they are in mixture forms. A crude oil contains hundreds of components, and the brine and surfactant pseudocomponents may also be complex mixtures. The ternary diagram shows the best representation of the phase behavior and it is reasonably accurate as long as each component has approximately the same composition in each phase. In evaluating phase diagrams, phase
11
behavior type descriptions are used. Usually, it is classified according to physical observation of the mixture and crude oil. The classifications of phase types are tabulated in the Table 2.
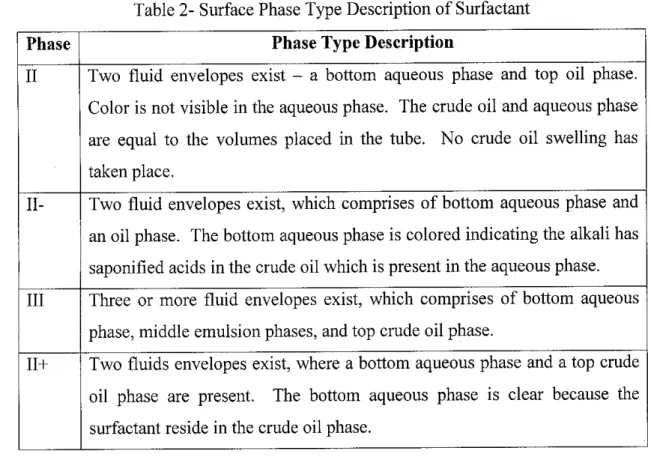
Table 2- Surface Phase Type Description of Surfactant
Phase Phase Type Description
II Two fluid envelopes exist - a bottom aqueous phase and top oil phase.
Color is not visible in the aqueous phase. The crude oil and aqueous phase are equal to the volumes placed in the tube. No crude oil swelling has
taken place.
II- Two fluid envelopes exist, which comprises of bottom aqueous phase and an oil phase. The bottom aqueous phase is colored indicating the alkali has saponified acids in the crude oil which is present in the aqueous phase.
III Three or more fluid envelopes exist, which comprises of bottom aqueous phase, middle emulsionphases, and top crude oil phase.
11+ Two fluids envelopes exist, where a bottom aqueous phase and a top crude oil phase are present. The bottom aqueous phase is clear because the
surfactant reside in the crude oil phase.
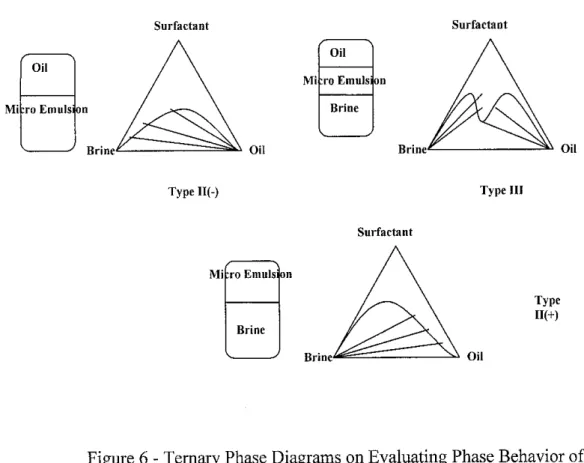
According to table 2, type III is the desired phase type to recover additional oil followed by type II-, 11+ and type II [3]. This is explained by the presence of interaction between the aqueous phase, crude oil and saponified acids. The relation to ternary phase diagrams in Figure 6 explains the equilibrium interaction between the three major components. Type II- phase behavior refers to the lowest salinity or lowest brine content in the solution. This is because most of the brine water is dissolved in the surfactant, interpreting that the surfactant is water soluble. Should the salinity increases, the surfactant would be more oil soluble, making the phase behavior to be in the type
12
Ill region, where the phases are distinguished by the top oil phase, middle emulsion phase, and bottom aqueous phase. Increasing the salinity changes the phase behavior, and transforming the solution to be in the region of type II+. Here, it can be concluded that the surfactant is oil soluble, where most oil is dissolved in surfactant and in form of microemulsion followed by brine water. From the phase behavior explanations, type III verifies as the most desired phase behavior that the evaluations trying to achieve because it shows balanced interaction with the brine and the oil. It is also the target characteristics within the chemical flooding, where the main target is to minimize surfactant losses, and minimize oil solubility to the surfactant so that separation between the oil and the surfactant is easier and economically feasible.
For surfactant adsorption in porous media, this phenomenon can be described as the electrostatic interaction, van der Waals interaction,
hydrogen bonding and salvation and desolvation of adsorbate and adsorbant species. Normally it is a common effect for the surfactant to be adsorbed onto solid surfaces specifically to the porous media, either on the walls of pores or fine particles in rock pores. In EOR, adsorption constitutes a loss of valuable surfactant and it is directly
affects the economic success of the flooding process.
Thus, adsorption study is considered important so that the factors that influence adsorption and its consequences can be identified and acknowledged. From there, preventive measures by altering the properties or introduce inhibition of the surfactant could be done to minimize adsorption on the porous rocks, while maintaining its recovery efficiency. Through analysis, factors that influence adsorption are temperature, brine salinity and hardness, solution pH, rock type, wettability, and the presence of a residual oil phase.
13
Surfactant
Brine
Type II(-)
Mi to Emulsion
Brine
Oil
Mi ro Emulsi on
Brine
Brine
Surfactant
Brine
Surfactant
Type HI
Type II(+)
Figure 6 - Ternary Phase Diagrams on Evaluating Phase Behavior of
Surfactants
2.3.2 VISCOSITY
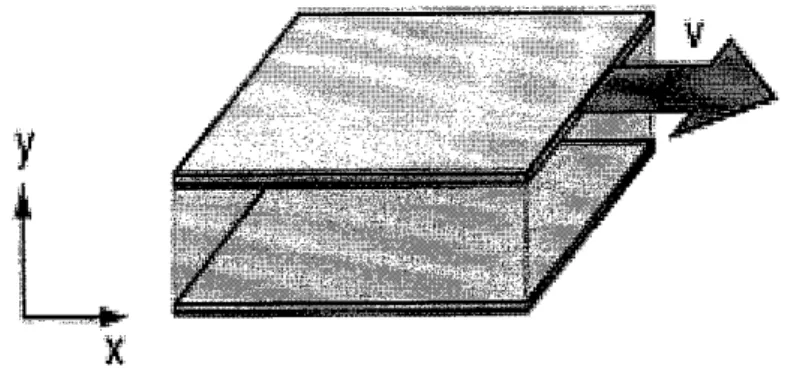
The resistance to flow of a fluid and the resistance to the movement of
an object through a fluid are usually stated in terms of the viscosity of the fluid. Experimentally, under conditions of laminar flow, the force required to move a plate at constant speed against the resistance of a fluid is proportional to the area of the plate and to the velocity gradient perpendicular to the plate. The constant of proportionality is called the
viscosity.
14
25[
im
iQQO
¥
Figure 7 - The resistance to flow of a fluid and the resistance to the movement of an object through a fluid
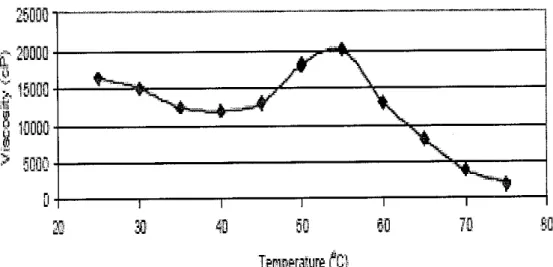
The viscosity and degree of viscoelasticity obtained is dependent upon the conditions employed (surfactant concentration, brine or electrolyte concentration and temperature) and will range from 1000 cP to 20,000 cP [4]. According to Akzo Nobel Surface Chemistry LLC, as shown in Figure 8, a representative gel (6% Surfactant in 3% KC1 brine) reaches
a maximum viscosity at about 55 °C (131 °F), then the gel loses
viscosity as temperature increases.
§0 70 SO
TeFipsralure fC)
Figure 8 - Viscosity-Temperature Profile of 6% Surfactant in
3% KC1 Brine
15
2.3.3 pH
The acid or alkali state of a solution is measured in pH values. pH is basically a measure of the degree of acidity or alkalinity of a solution.
A pH of 7 is neutral. Working down from this point, the figures indicate weak acids with a pH of 6 on to strong acids with a pH of 1.
Working up from a pH of 7, the figures indicate weak alkalis with a pH of 8 to strong alkalis with a pH of 14.
The pH values are numbered on a logarithmic scale. From 0 through 6, each number indicates a degree of acidity 1/10 as strong as the preceding number, but 10 times stronger than the next succeeding or higher number. A solution with a pH value of 4, for example, has a degree of acidity 10 times stronger than a solution with a pH value of 5, but only 1/100 the strength of a solution having a pH value of 2.
When determining the degree of alkalinity of a solution, figure it in an opposite manner. From 8 through 14, each number represents a degree of alkalinity 10 times as strong as the last preceding number, but 1/10 the strength of the next higher number; for example, a solution having a pH value of 11 indicates that the solution has an alkalinity 1,000 times stronger than a solution having a pH value of 8, but it would be only 1/100 as alkaline as a solution having a pH value of 13.
16
CHAPTER 3 METHODOLOGY
3.1 Project Flow Cycle
Several stages have been done and structured in order to complete the research project. All the stages are planed before start the project to keep consistence and
efficiencies work.
3.1.1 Literature Review and Data Gathering
• Gathered books and journal describing surfactant and enhanced oil recovery from Universiti Teknologi Petonas (UTP) Library.
• Surfing internet to get the information to enhance understanding regarding the research.
• All the information gathered was revised and rearrange accordance to sequence of understanding in this project.
Information gathered is useful to complete the experimental
work and report.
3.1.2 Experimental work
During first phase of research duration, a discussion was made with
Senior EOR Chemist at Petroleum Research and Scientific Services
(PRSS). The discussion was about experimental work to determine the interfacial tension between surfactant and oil using Vapor Liquid Equilibrium Equipment. Unfortunately the equipment was not available, therefore a sample of crude oil was took from PRSS in
17
order to conduct experiment at UTP laboratory. From the discussion with Senior EOR Chemist, these experiments will be conducted:
• Preparation of experiment solution
• Phase behavior determination
• Viscosity and pH determination
3.1.3 Results Gathering and Analysis
Once the result of the experiments was obtained, discussion with the Petroleum Engineer, EOR technician and lecturers was done in collaboration for interpretation and analysis. The results are tabulated and illustrated in graphical forms to display relationships with one parameter variable to another. Most of the results gathered are compared relatively to the governing theory, and at the same time recommendations are proposed in order to improve the experimental
works and results.
3.1.4 Report Preparation
The report was prepared in accordance withthe research and also for the course requirements. Consequence, the result that obtained would be the study basis for student that will do the same research or experiments in future.
3.2 Chemicals
Three main chemicals are used in the experiment, which are:
• Surfactant
• Sea Water
• Crude oil
The surfactant used is Dodecylbenzenesulfonic, this is anionic type of surfactant. The crude oil used is obtained from PRSS, taken from one of the oil field in Malaysia.
3.3 Experimental Procedures
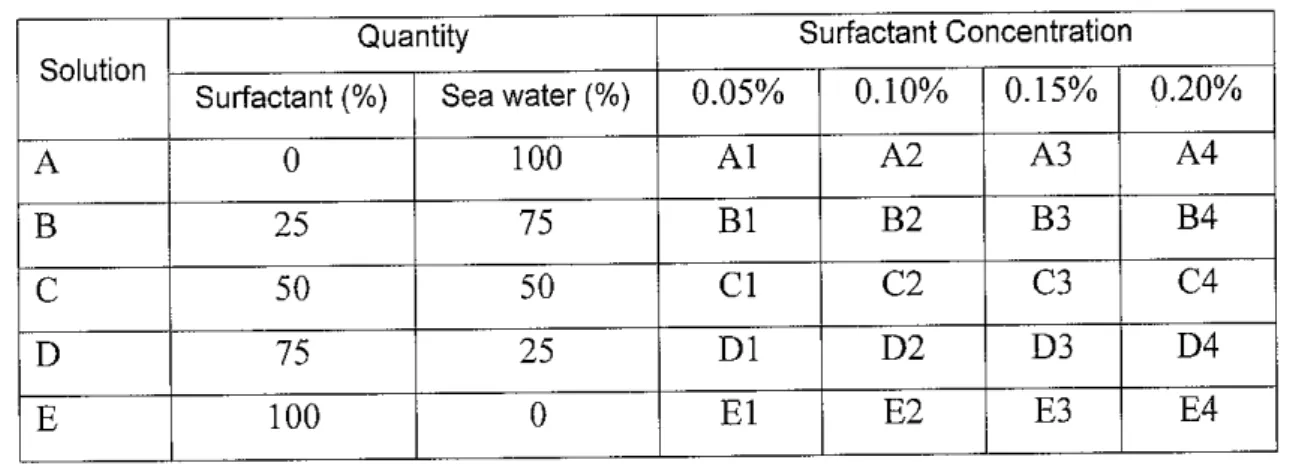
Preparation of surfactant samples in four different concentrations were done, which are 0.05%, 0.10%, 0.15% and 0.20%. Each concentration sample was mix with sea water for 40ml with five different amounts, namely 0%
Surfactant-100% sea water, 25% Surfactant-75% sea water, 50% Surfactant- 50% sea water,75% Surfactant-25% sea water and 100% Surfactant-0% sea water. The entire sample is labeled and summarized as in Table 3.
Table 3 - Sample Concentrations and Coding
Solution
Quantity Surfactant Concentration
Surfactant (%) Sea water (%) 0.05% 0.10% 0.15% 0.20%
A 0 100 Al A2 A3 A4
B 25 75 Bl B2 B3 B4
C 50 50 CI C2 C3 C4
D 75 25 Dl D2 D3 D4
E 100 0 El E2 E3 E4
19
Crude oil is added to the surfactant-sea water sample to create 40mL solution of mixture. Plug top of test tubes and shake vigorously for about 1 minute to mix crude oil and surfactant solutions. All the test tube then placed on the test tube rack and allowed to stabilize. After the mixture had stabilized, the mixture should be in two phases ie top oil phase, bottom aqueous phase, and middle emulsion phase (if any). Observe characteristics of each phases and the color of aqueous phase. The viscosity and pH for every sample then taken using viscometer and pH detector.
20
c:
P
— :/:7i rrt O TO
— 5*
3 C
>
CHAPTER 4
RESULTS AND DISCUSSION
4.1 Phase Behavior Identification
The identification of Phase Behavior of surfactant samples is achieved after
the sample is left to stabilize. The classification results are done by physical
observation of the samples that are heated and kept for duration of 2 weeks.Following are the physical observations of the surfactant samples:
.**'
Figure 9 - Phase Behavior Result (Sample A)
m i
• t'»**»* ,. j „
Figure 10 - Phase Behavior Result (Sample B)
21
•in Eg - **
Figure 11 - Phase Behavior Result (Sample C)
•w
•*
Figure 12 - Phase Behavior Result (Sample D)
i n
•.•43*
Figure 13 - Phase Behavior Result (Sample E)
22
All the specification of phase behavior is done based on evaluation on Table 3. The detailed results for every sample are tabulated in Table 4.
Table 4 - Phase Behavior Results
Surfactant
Solution
Equilibrated-irTase^Vplffrn^
..- "Phase.jss'if"- "
f_hase
•Description
Code - bottom Middle Top
A1 75 25 II- LY.C
A2 80 20 II- LY, C
A3 70 30 II- LY,C
A4 65 35 II- LY, C
B1 80 20 II + C,T
B2 35.0 15.0 50.0 II! Y, T
B3 45.0 5.0 50.0 Ill LY, C
B4 85 15 II- LY, C
j .
C1 70 30 II + M
C2 75 25 II + C
C3 85 15 II- M
C4 90 10 II + M
•
D1 65 35 II- Y, T
D2 70 30 II- Y, T
D3 75 25 II- Y, T
D4 80 20 II- Y, T
•• \ :
E1 75 25 II- B, T
E2 75 25 II- B, T
E3 70 30 II- B, M
E4 85 15 II- B, M
B = brown C = clear G = grey M = milky
W = white PPT = precipitate
23
Y = yellow
L = light
D = dark T = translucent 0 = opaque
4.1.1 Discussion and Recommendation
For experiment involving phase behavior, the strategy is to classify the samples in terms of types. As explained in theory, the desired phase behavior of a good surfactant is to have phase type III, where three or more fluid envelopes exist, which comprises of bottom aqueous phase, middle emulsion phases, and top crude oil phase.
This can be done via physical observation, and later it is tabulated so that the performance of the samples can be viewed in overall. The fundamental concept of having the phase behavior analysis is to provide the interaction of surfactants with the oil and water so that an effective flooding design can be designated to meet the specific reservoir conditions for CEOR. Ranking performance of the following phase behavior types are type II-, type II, and type II+.
Based on the Table 4, it can be concluded that most of the samples are type II-. Results for type III and type 11+ is tabulated below:
Table 5 - Performance Division of Phase Behavior Result
Type Surfactant Sample
III B2,B3
11+ B1,C1,C2,C4
From Table 5, there are two samples yield type III for surfactant 6- 79, while for three samples for surfactant 6-66. These samples are considered the ideal samples that satisfy the desired phase type.
24
Unlike type II+, the samples gathered are likely to be retested and
may subject to short listing.
The two anchoring points and large size, in particular the length of
the two hydrophobic groups, provide steric stabilization at the
emulsion interface and also resistance to inversion, in comparison with "classic" small size emulsifiers. As polymeric surfactants
irreversibly absorb at the interface very stable water-in-oil emulsions
are obtained. Figure 14 shows the optimal packing at the interface.The significance having type III Phase Behavior is to provide clear
distinction of all three fluid phases.
Figure 14 - Optimal Packing at Interface
25
In a chemical flooding design, the goal is to minimize the chemical
reaction between the oil and the surfactant, while at the same time maintains its recovery performance by lowering the IFT and maximizing mobility control by usage of polymer solution. By having phase type III as in Figure 15, less oil is solubilized in a form of emulsion and this is important when the oil is transported to the production tube and undergoes refining process. Logically, by presence of emulsions, it makes separation of oil, water, and surfactant difficult because the goal is to recover back the surfactant that is to be reused again in CEOR. As surfactants are highly expensive chemicals, most flooding designs aim to minimize the surfactant losses; so that the chemical treatment still maintains economic viability of the CEOR.
Crude Oil
Emulsion
Aqueous
Figure 15 - Phase type III
One of constraints faced in phase behavior discussion is its complex chemistry fundamentals. In detail, the true compositions of the reservoir are heterogeneous, and the fluids within the reservoir do not behave as absolute true components. Phase diagram is one
26
alternative to describe the phase behavior of the reservoir oil, but the explanation is merely an estimate and may subject to several ambiguities. The only option to study the phase behavior is to continuously conducting experiments, so that more information regarding the surfactant's nature in phase behavior can be extracted.
This complex chemistry can only be done withthe collaboration with highly expert chemists and reservoir engineers, which is specialized
in EOR processes.
The experiment conducted involving phase behavior is done in a pilot scale, where the experiments are done for the first time. Thus, the results gathered during the experiment may deviate from true results, and one of the best options in order to improve the experimental results is to redo the experiments so that the accuracy and the consistency can be achieved. As phase behavior classification is done by physical observation, this type of method is subjective, and the classification results may differ due to different kinds of interpretation. The alternative to compensate this ambiguity is to conduct together along with other EOR chemists or reservoir engineers, so that the observation results agree with one sample to
another.
4.2 Viscosity and pH Determination
The determination of viscosity and pH is achieved after the phase behavior was observed. Viscosity reading obtained by using viscometer. Viscosity is a measure of the "flowability" of oil. More specifically, it is the property of an oil to develop and maintain a certain amount of shearing stress dependent on flow, and then to offer continued resistance to flow. Thicker oils generally
27
have a higher viscosity, and thinner oils a lower viscosity. Oil with too low a viscosity can shear and loose film strength at high temperatures.
pH reading can be achieved by using pH detector. Basically, pH reading
shows whether the mixture is more acid, neutral or alkali phase. For this
experiment, as the surfactant, which is alkali behavior was introduced to the
oil; therefore the pH should be on alkali (8-14).
Table 6 summarized the results of viscosity and pH measurements at different surfactant concentrations.
Table 6 - Results of viscosity and pH
1
Solution Phase Type
j Viscosity
(mPa.s)
A1 II- 1.42 10.5
A2 II- 1,45 10.3
A3 II- 1.40 10.7
A4 II- 1.56 11.2
B1 II + 1.36 10.3
B2 III 1.45 10.5
B3 III 1.48 10.7
B4 II- 1.53 10.9
C1 II + 1.40 9.8
C2 II + 1.45 10.2
C3 II- 1.48 10.3
C4 II + 1.55 11.3
D1 II- 1.46 10.2
D2 II- 1.48 9.9
D3 II- 1.54 10.3
D4 II- 1,55 11.2
.
E1 II- 1.43 10.4
28
E2 II- 1.45 9.9
E3 II- 1.49 10.5
E4 II- 1.55 11.3
4.2.1 Discussion and Recommendation
4.2.1.1 Effect of surfactant concentrations on viscosity value
The main characteristics that need to observe is how the viscosity
and pH changes due to different concentration of surfactant in the mixture. It is important as viscosity indicates the ability of the fluid to flow in the reservoir rock. Low viscosity shows that the fluid will flow easier and smoother, and vice versa. From the results, viscosity of the mixture has an almost identical reading at different concentration of the surfactant but have slightly increment as in Figure 16.
1.6
Viscosity versus Concentration
0.05 0.1 0-15
concentration (wt%)
•10 0%SW -25%SW, 75%Surf
-75%SW, 25%3urf -100%Surf
50%SW. 50%Surf 0.25
Figure 16 - Viscosity versus Concentration
As the mixture is at very high concentration of surfactants, the viscosity will have a significant increment; fluid becomes more viscous. Thus, for an effective chemical flooding in enhanced oil recovery, low concentration of surfactant will be preferred. The same
29
behavior was observed in alkaline flooding. It is found that as the alkali concentration is increase, the viscosity increased [5].
The experiment was taken out at temperature around 19 C to 20 C due to the air conditioner. This temperature is slightly lower than
normal room temperature, which is at 25°C. Thus, error might occur
as viscosity measured is fluctuated. Therefore, the experiment should be conducted at room temperature to obtain more accurate result.
4.2.1.2 Effect of surfactant concentrations on pH value
The strength of an acid or an alkali can be measured by the concentration of hydrogen ions in it. The more hydrogen ions it contains, the more concentrated it is. The effect of surfactant concentration on pH values are shown in Figure 17. It was found that consequences to the increment of concentration, the pH also increase in the range between pH 9.8 to 11.3. This is explicable as the
surfactant has an alkali behavior, which has range between pH 8 to
14. Even though the increment is minor, but it is fairly enough to
show the trend of the alkali behavior of the solution.
30
x Q.
11.4 11.2
11 H 10.8 10.6 10.4 - 10.2 - 10 - 9.8 - 9.6 -
pH versus Concentration
y
, /
y' /
\ /
0.2 0.25
0 0.05 0.1 0.15
Concentration (wt%)
—♦ 100%BW
—44.— 25%SW, 75%Surf
•75%Ws, 25%Surf 50%SW, 50%Surf
~* 100%Surf
Figure 17- pH versus Concentration
By having more concentrated surfactant solution, the hydrogen ions (H+) contains that indicates acidic pH is less. Thus, as hydrogen ions
contain decrease, the pH gives higher value. The study onpropagation and adsorption of an anionic surfactant in Berea
sandstone cores and reported dramatic surfactant loss and slowerpropagation as sodium chloride concentration increased was conducted [6]. Increasing the pH of the surfactant slug from 6 to 12
reduced the surfactant loss by nearly thirty percent at a given sodium chloride and surfactant concentration, surfactant loss decreases as the injection flow rate increases.31
CHAPTER 5
CONCLUSION AND RECOMMENDATION
5.1 Conclusion
Consequence of research objectives, enhanced oil recovery (EOR) is an interesting and valuable topic as it potential to increase the oil production as the production rate depleted from secondary recovery. Chemical flooding is
one of the EOR mechanisms that use surfactants to recover more oil besides
polymer and alkali. Its capability to lower the interfacial tension between
the crude oil, water and rock due to its hydrocarbon and hydrophilic structure has become the major interest of research and studies about itsphysical chemistry so that its properties can be very well understood. One of the properties that it is studied in this research is the Phase Behavior, viscosity and pH. Thus, for experimental works, it was observed that:
1. For Phase Behavior identification, most of the samples yield type II- , a fair desirable results, and a few of samples managed to obtain
type III. Type III is desirable result as it yield three phases consist
of oil, emulsion and aqueous phase.
2. Viscosity of the solution is increased as the concentration of
surfactant increased.
3. pH of the solution is increased as the concentration of surfactant is
increased.
32
5.2 Recommendation
In order to improve the quality of this research, the experiments should be repeated for a number of times so that the consistency and the accuracy of
the results can be achieved. This research environment involves a lot of
qualitative experimental works, errors are mostly evident and these upset the results' accuracy and reliability. This can be resolute by improving the experimental methods such as revising the methods used, and if possible, other experimental methods can be used so that the results of the alternative method agree with the current methods and strengthens the results credibility. Plus, the equipments used must be at its optimum condition with good calibration history so that the results calculated are accurate and
consistent.
Since this research project involves analysis of the fluid-fluid evaluation of
the surfactants, it is recommended that this research be continued by future researcher so that the study of surfactant properties can be intensified. Asthis project plays a huge impact to the development of CEOR, this research is proved valuable in terms of economic impact to oil industries in the race
of recovering more oil.
33
CHAPTER 6 REFERENCES
[1] W.B. Gogarty, 1983. Enhanced Oil Recovery Through the Use ofChemicals,
Society of Petroleum Engineers Journal, 147-156
[2] Bradly, 1987, Petroleum Engineers Handbook, Society of Petroleum
Engineers
[3] Laurier L. Schramm, 2000, Surfactants: Fundamental and Applications in
the Petroleum Industry, Cambridge; Cambridge University Press
[4] Norman Alban and Jorge Gabitto, 1990, Surfactant-Polymer Interaction in
Enhanced OilRecovery, Prairie View A&M University
[5] Mansor S. Almalik, Attia M. Attia, Lary K. Jang, 1996, Effect ofAlkaline
Flooding on The Recovery of Safaniya Crude Oil of Saudi Arabia, KingSand University, Riyadh
[6] Kwok Ling Chang, \992, Analysis ofSurfactants, MDI Publications
[7] K.R. Lange, 1999, Surfactants: APractical Handbook, Hanser Publications
34
Appendix A
35
Enhanced Oil Recovery Method
RESERVOIR RECOVERY MECHANISMS
GAS CAP DRIVE
WATERFLOOD
NATURAL DRIVES
SOLUTION GAS DRIVE
WATER INFLUX
ENGINE iRED DRIVES
GRAVITY DRAINAGE
GAS INJECTION
PRESSURE MAINTENANCE
HORIZONTAL WELLS MULTI- LATERAL WELLS INFILL WELLS
EXTENDED REACH
GAS
Hydrocarbon
(miscible, immiscible) CO2, Nitrogen, Flue Gas Foam, WAG Cycling Depressurization
IMPROVED OIL
AND ENHANCED RECOVERY
FACILITY UPGRADES DUMP FLOODING
CHEN [ICAL
Surfactant
Polymer modified waterflood Polymer gel (flow diversion)
caustic
THEIMAL
Steam
In situ combustion Electrical heating
Figure 18 - Recovery Methods Available in Petroleum Industry
36
EXPANSION
COMPACTION
HYDRAULIC &
THERMAL FRACTURING'
OT iERS
Mining Leaching Vibration Microbial
Figure 19- ASP Flooding Illustration
Figure 20 - Schematic Diagram of Steam Flooding
37
wall -"^
Figure 21 - Schematic Diagram of CO2 Miscible Flooding
38
Appendix B
39
Surfactant Flooding
-*- Cksw Taper Mobility Slug Preflush
Water Buffer
Figure 22 - Cross Section of Typical Surfactant Flood
Surfactant
Brine
Figure 23 - Ternary Diagram Representation of Surfactant Phase Behavior
40
Microemulsion Inferior Phase Behavior (II-)
Microemulsion Media Phase Behavior (III)
Microemulsion Superior Phase Behavior (11+)
Figure 24 - Phase Behavior Surfactant - Brine - Oil
41