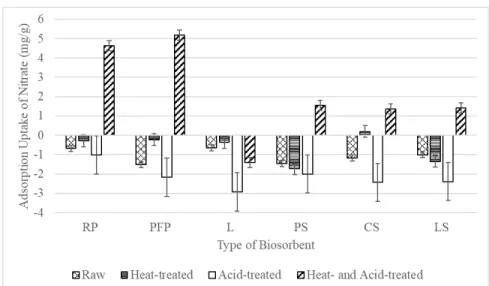
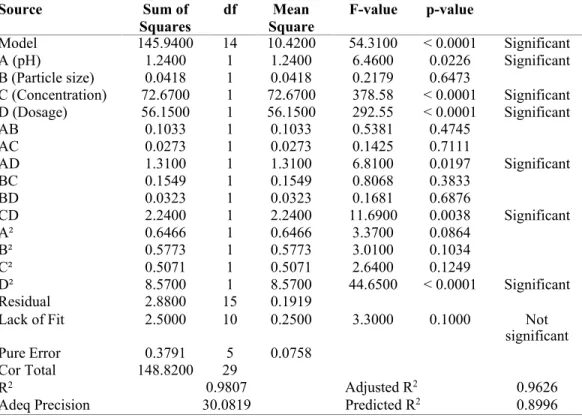
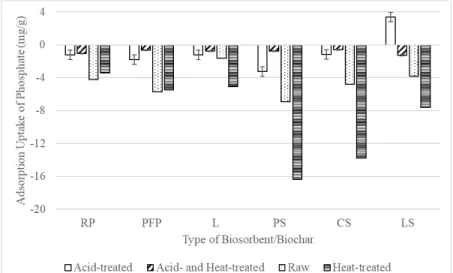
Analysis of variance (ANOVA) for adsorption uptake of nitrate using acid-treated PFPBC isotherm data for nitrate biosorption. Adsorption uptake of phosphate (mg/g) against type of biosorbent with different derivatives FTIR spectra of all derivatives of pre-sorption and post-sorption LS samples: (a) Raw LS; (b) Heat treated LS, (c) Acid treated LS; (d) Heat and acid treated LS; (e) Heat and acid treated LS (after phosphate sorption).
Background
Nevertheless, these methods often have a typical disadvantage in the cost of operation and maintenance, the generation of hazardous sludge, as well as procedural complexity in stages of treatment (Mohsenipour et al., 2014). Apart from shortages in publications reporting on derivatives and dry mass, there were major problems with the direct comparison of data from different sorbents, mainly due to irregularities in the data presentation (Shilpi et al., 2018).
Problem Statement
Their purpose is to ensure that wastewater or water conforms to the standards based on appropriate classes, except for the threshold concentration standards of nitrate and phosphate designated by other official organizations (Huang et al., 2015). This has also prompted the demand for environmentally friendly and cost-effective resources such as raw and waste materials, which could be available adsorbents containing specific functional sites for nitrate and phosphate (Kanamarlapudi et al., 2018).
Aims and Objectives
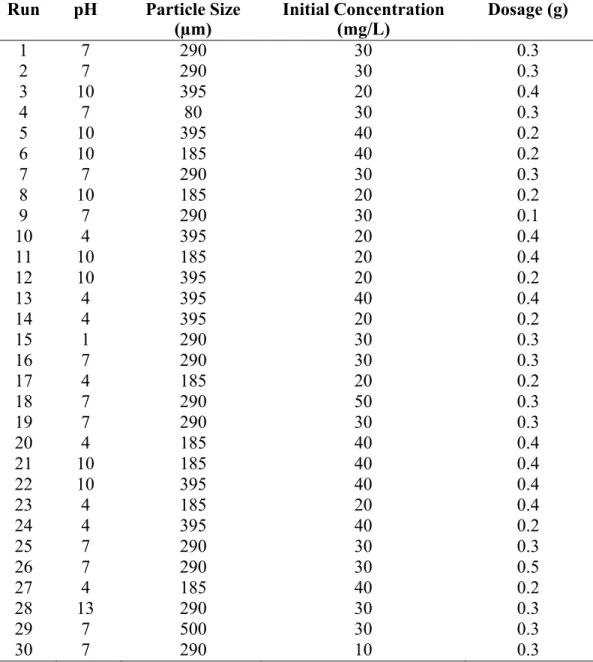
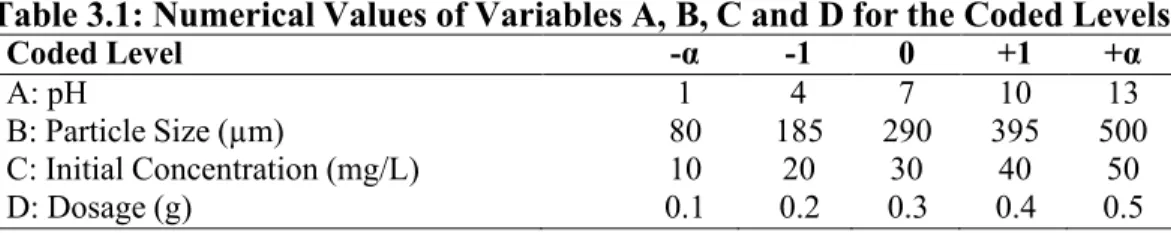
To investigate the effects of operating parameters, namely initial solution pH, initial nitrate and phosphate concentration, biosorbent particle size, and biosorbent dosage on biosorption performance. To study the effect of nitrate and phosphate ions on competitive biosorption, as well as the reuse of biosorbents through desorption and regeneration studies.
Scope of Study
LS), chia seeds (CS), papaya seeds (PS) and luffa (L), as well as their derivatives in the elimination of nitrate and phosphate from water.
Significance of Study
Based on several literature surveys, the researchers analyzed the potential of various biosorbents for the removal of dyes, heavy metal ions and complexes from polluted water. Nevertheless, data on the use of fruit peels, seeds and vegetable waste as biosorbents for the removal of nitrates and phosphates from polluted water are very limited (Shakoor et al., 2015; Kumar et al., 2019).
Dissertation Outline
The concentration limits of nitrate and phosphate in water are compared between different regulations designated by different environmental agencies and authorities. Next came the single-factor study, the interaction effects study, the response surface methodology, isotherm and kinetic modelling, as well as the study of competitive adsorption between nitrate and phosphate.
Nitrates
As a result of disrupted nitrogen and phosphorus cycling, eutrophication destroys aquatic life and causes decomposition of the remaining corpses, which degrades water quality and makes the affected water bodies habitable for other aquatic organisms (Loganathan et al., 2014). There have been discharge limits for biogenic matter in the water bodies that are set and reviewed by numerous environmental, health and welfare authorities and organizations.
Phosphates
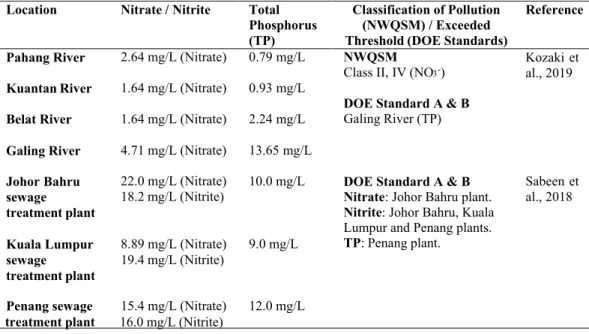
In addition, as phosphate concentrations increase in surface waters, excessive growth of phosphate-dependent organisms such as algae and duckweed is promoted (Loganathan et al., 2014). Pollution level classification is based on total phosphorus concentrations below 0.2 mg/L, and effluent concentration thresholds set at 5.0 and 10.0 mg total.
Extent of Nitrate and Phosphate Water Pollution
This helps to determine the quality of the water and its suitability for various purposes, and also determines the need for treatment to extract phosphorus from the water before it is reused or released into the environment.
Conventional Methods of Removal of Nitrate and Phosphate from Water .1 Nitrate
Phosphate
Biological phosphate removal methods introduce phosphorus into the cellular components of the microbes used in the biological water treatment process. The main advantages of biological phosphate treatment methods are the reduction of chemical costs and lower sludge production than chemical precipitation.
Biosorption
One of the strengths of biosorption in the elimination of pollution is the feasibility of biological processes in situ at the site of contamination (Kanamarlapudi et al., 2018). In addition, the abundance and accessibility in the study regions, high economic and practical values, as well as the regenerability and reusability are also equally critical features to look for in a potential biosorbent (Kanamarlapudi et al., 2018).
Biomaterials for Biosorption
Microbial Biosorbents
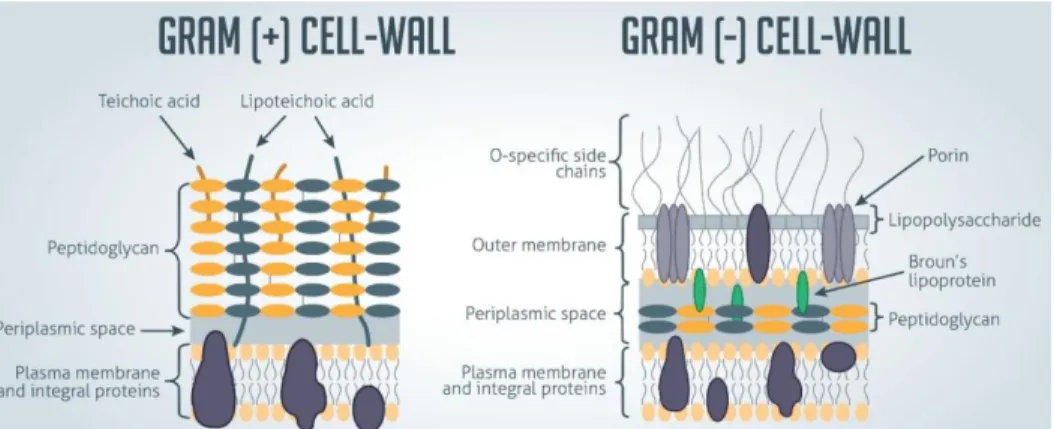
- Bacteria
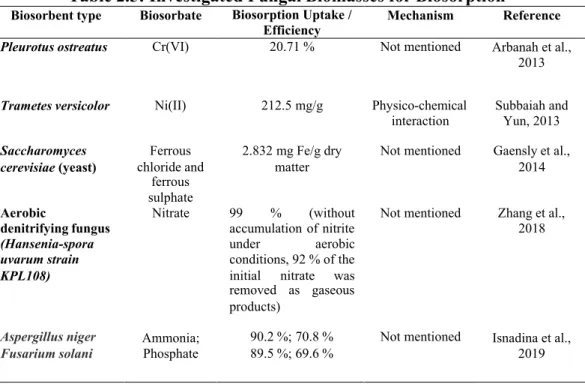
- Fungi
- Algae
This may be because the exact adsorption mechanism is not yet fully understood (Velkova et al., 2018). They can be easily separated by simple techniques such as filtration, due to their filamentous nature (Gaensly et al., 2014).
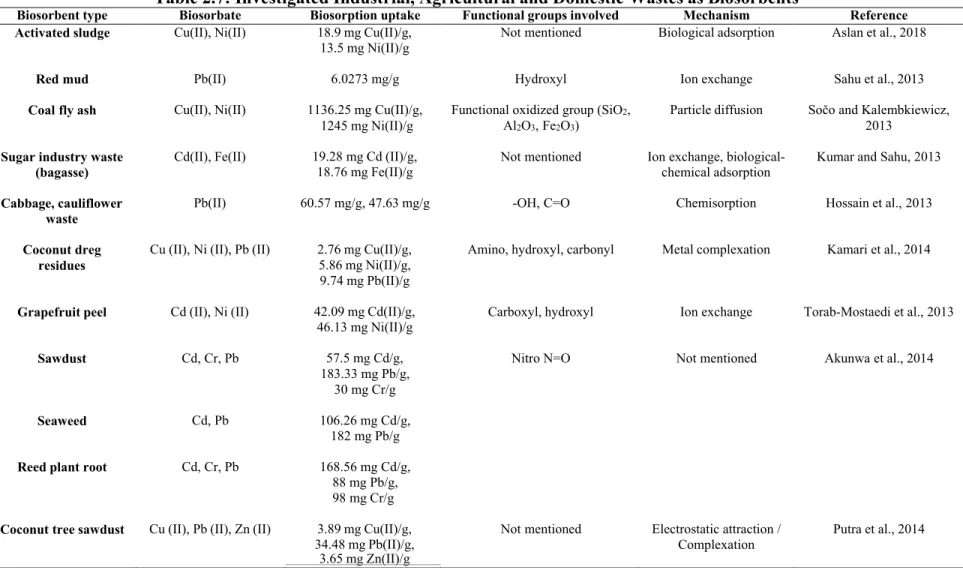
Agricultural, Domestic and Industrial By-products
Excellent characteristics of contaminant binding are also observed among agricultural wastes with abundant cellulose, lignin and polar functional groups such as alcoholic, amino, carbonyl, ether and phenolic groups (Akunwa et al., 2014). They have a relatively higher biosorption performance towards heavy metal ions than nitrate and phosphate ions.
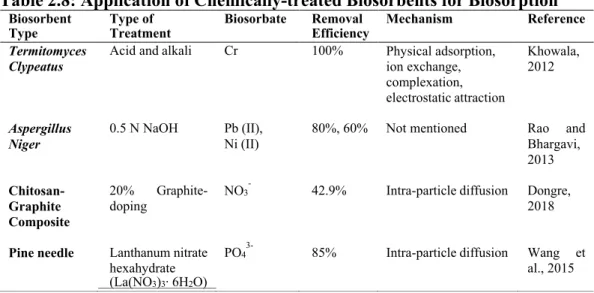
Factors Affecting Biosorption
- Effect of Pre-treatment
- Effect of Initial Concentration of Nitrate and Phosphate
- Effect of Particle Size of Biosorbent
- Effect of pH
- Effect of Dosage of Biosorbent
The process of nitrate and phosphate biosorption is highly dose-dependent (Soumya et al., 2015; Alagha et al., 2020). This is due to the increased surface area, which increases the number of available binding sites (Soumya et al., 2015; Alagha et al., 2020). This was well observed in the study by Soumya et al. 2020) on the biosorption of nitrate and phosphate.
Summary
This was mainly due to the insufficient solute for complete distribution on the available binding sites, as well as possible interaction between binding sites, the ratio of adsorbate to binding site becomes lower (Soumya et al., 2015; Alagha et al., 2020). Instead, it stabilized at higher doses of biomass due to the formation of aggregates that lower the effective surface area for biosorption (Soumya et al., 2015: Alagha et al., 2020). In this study, passion fruit peel (PFP), rambutan peel (RP), longan seeds (LS), chia seeds (CS), papaya seeds (PS) and luffa (L) are the biosorbent candidates categorized as agricultural and household waste become is locally abundant and easily available (Kanamarlapudi et al., 2018).
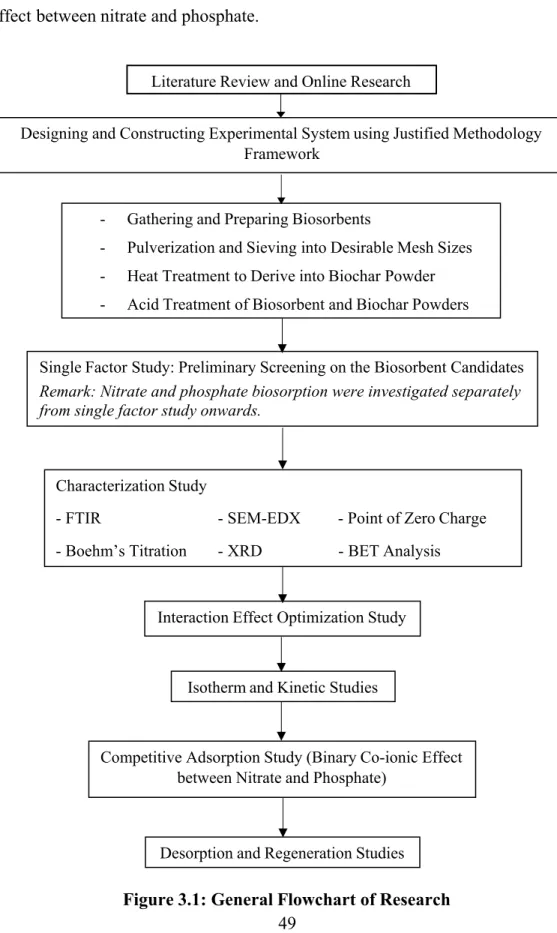
Research Flowchart
Finally, before the desorption and regeneration studies, the competitive adsorption study was performed to investigate the binary co-ionic effect between nitrate and phosphate. Single-factor study: Preliminary screening of the biosorbent candidates Note: Nitrate and phosphate biosorption were studied separately from the single-factor study onwards.
Materials
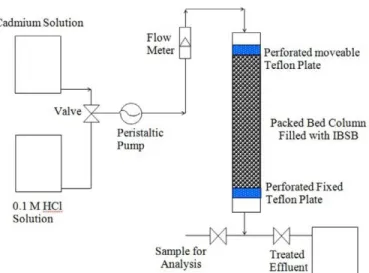
Experimental Procedures
- Preparation of Stock Solution
- Preparation of Biosorbents
- Heat Treatment of Biosorbents
- Acid Treatment of Biosorbents and Biochars
- Preliminary Screening of Biosorbent Candidates
- Interaction Effect Study
- Isotherm Model Study
- Langmuir isotherm
- Freundlich isotherm
- Temkin isotherm
- Dubinin-Radushkevich Isotherm
- Kinetic Model Study
- Pseudo-second Order Kinetic Model
- Elovich Equation
- Intra-particle Diffusion Kinetic Model
- Competitive Adsorption Study
- Desorption and Reusability Studies
- Detection of Nitrate and Phosphate
- Characterization Study
Subsequently, the response was predicted and the suitability of the model within the experimental design was investigated (Mahalik et al., 2010; Behera et al., 2018). Subsequently, with more adsorption, if the considered number of ions is smaller than that of the oppositely charged ions, the electrostatic energy of the surface decreases (Nakahara, 1996; Ayawei et al., 2017). In the liquid adsorption on a solid surface without desorption of the adsorbates, the reaction rate decreases over time as the surface coverage increases (Wu et al., 2009; Zhu et al., 2014).
Nitrate Biosorption
Preliminary Screening of Biosorbent
- FTIR Analysis of Passion Fruit Peel Based Biosorbents
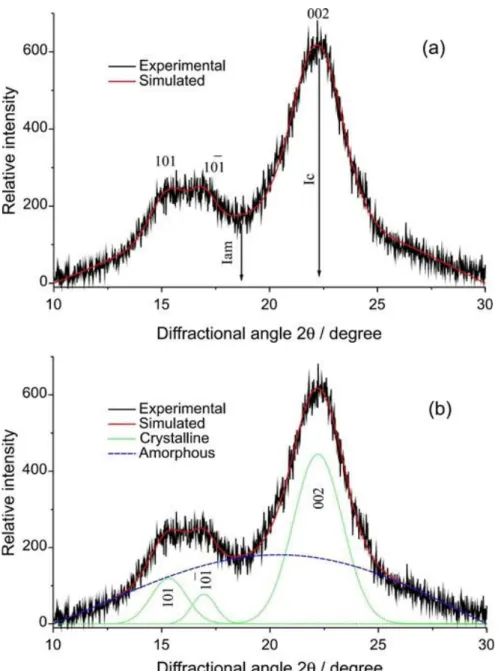
- XRD Analysis of Passion Fruit Peel Based Biosorbents
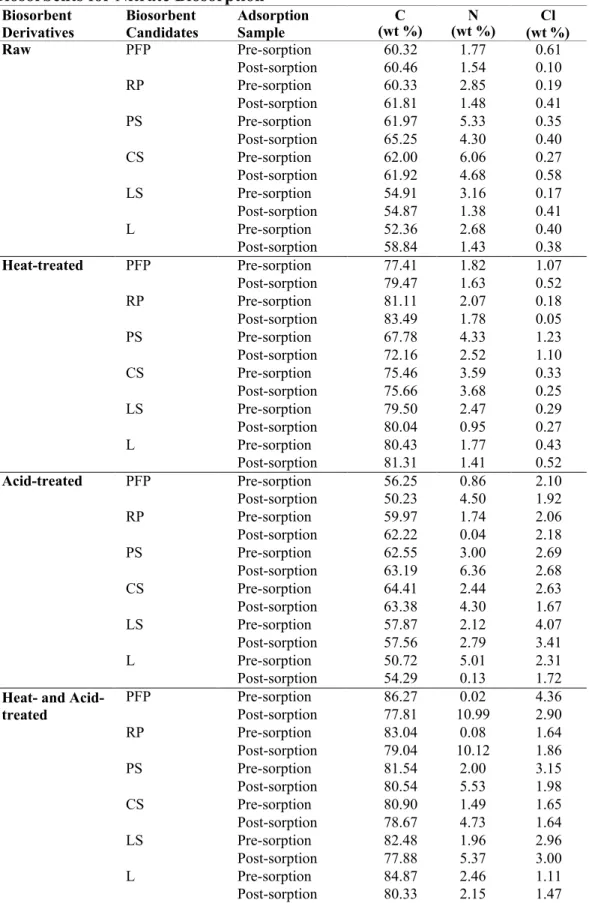
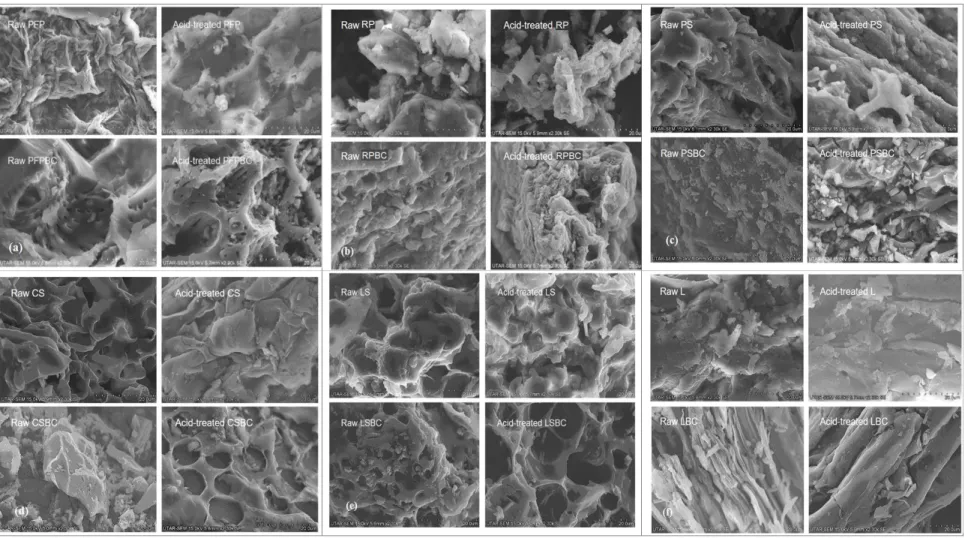
After acid treatment, the surface layers of crude biosorbent tissues were removed to varying degrees (Daffalla et al., 2020). In contrast, the remarkable effect of acid treatment was related to the pH of zero charge, which is crucial for indicating the acidity and net surface charge of the biosorbents and biochars in the aqueous solution (Farnane et al., 2018). This detection had led to greater availability of both N-H and O-H surface functional groups (Iriarte-Velasco et al., 2016).
Interaction Effect of Operating Conditions on Nitrate Biosorption .1 ANOVA Analysis
- Interaction Effects between Operating Parameters
- Optimization of Operating Parameter Values
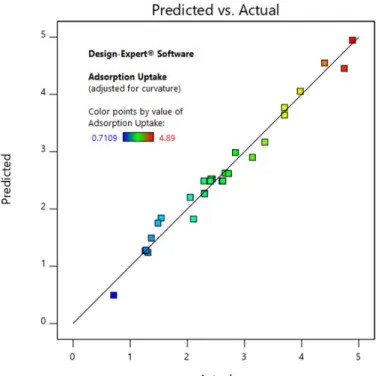
Additionally, Figure 4.6 compares the predicted and actual values for nitrate ion sorption using acid-treated PFPBC, respectively. Maximum nitrate biosorption uptake was recorded at low initial pH and biosorbent dose. The effect of initial nitrate concentration on biosorption uptake was similar to that of biosorbent dose.
Biosorption Isotherms of Biosorbents and Biochars
The maximum adsorption uptake of nitrate was obtained at 8.9858 mg/g acid-treated PFPBC with an error of 0.8726% from the predicted theoretical value at 9.0649 mg/g acid-treated PFPBC. This also suggests that homogeneous, monolayer adsorption was primarily involved in the nitrate biosorption on the surface of acid-treated PFPBC, with each nitrate ion/acid-treated PFPBC adsorption having the same adsorption activation energy (Thi et al., 2020). Based on the results, the theoretical maximum sorption capacity (qmax) was found to be 21.1864 mg NO3/g acid-treated PFPBC.
Biosorption Kinetics of Biosorbents and Biochars
Moreover, the Langmuir constant, KL value evaluated from this study was 0.8076 for nitrate biosorption, which fell within the range of 0 – 1, making the biosorption process favorable (Dada et al., 2012). On the other hand, the slow reaction may be due to the diffusion of nitrate ions in the biosorbents. Thus, to summarize, the pseudo-second-order model can be employed to predict the adsorption kinetics for nitrate adsorption as the chemisorption-dominated rate-limiting step.
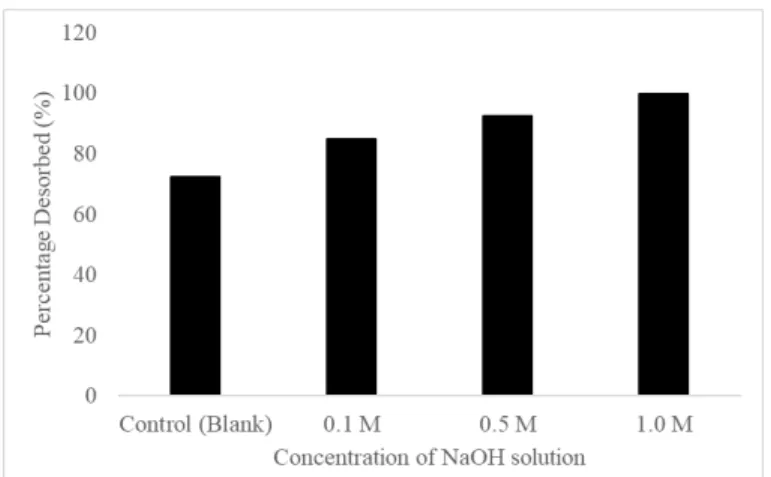
Desorption and Regeneration Studies
This mechanism can be attributed to the fact that the pHPZC for acid-treated PFPBC is 4.4. Therefore, the surface of acid-treated PFPBC has a net negative charge at pH values higher than 4.4. The almost complete desorption of nitrate indicates an almost reversible process, where nitrate ions are weakly adsorbed on the acid-treated PFPBC.
Phosphate Biosorption
Preliminary Screening of Biosorbent
- FTIR Analysis of Longan Seed Based Biosorbents
- XRD Analysis of Longan Seed Based Biosorbents
Also, the number of available active sites is slightly reduced and a small amount of nitrate ions accumulate in the bulk of the biosorbent (Marković-Nikolić et al., 2018). This is due to the decrease of both N–H and O–H surface functional groups (Iriarte-Velasco et al., 2016). The leaching of phosphate from biomass can be explained by the abundance of polyphosphate granules adjacent to or trapped in the vacuoles (Yang et al., 2017).
Interaction Effect of Operating Conditions on Phosphate Biosorption .1 ANOVA Analysis
- Interaction Effects between Operating Parameters
- Optimization of Operating Parameter Values
The predicted and actual adsorption uptake of phosphate ions using acid-treated LS are compared in Figure 4.13, respectively. In Figure 4.14(a), the adsorption uptake of phosphate fell to the minimum with approximately 0.4 g of acid-treated LS as the dosing dose increased from 0.1 g to 0.5 g. When the initial phosphate concentration increased from 10 mg/l to 50 mg/l, the adsorption uptake of phosphate gradually increased.
Biosorption Isotherms of Biosorbents and Biochars
The maximum adsorption uptake of phosphate was obtained at 5.0 mg/g acid-treated LS with 2.2495% error from the predicted theoretical value at 4.89 mg/g acid-treated LS. Each phosphate ion/acid treated LS adsorption had the same adsorption activation energy (Thi et al., 2020). Based on the results, the theoretical maximum sorption capacity (qmax) was found to be 5.8858 mg PO4/g acid treated LS.
Biosorption Kinetics of Biosorbents and Biochars
The Langmuir constant, KL value evaluated in this study was 0.6107 for phosphate biosorption, which fell within the range of 0–1, making the biosorption process favorable (Dada et al., 2012). In summary, the pseudo-second-order model could thus be used to predict the adsorption kinetics for phosphate adsorption.
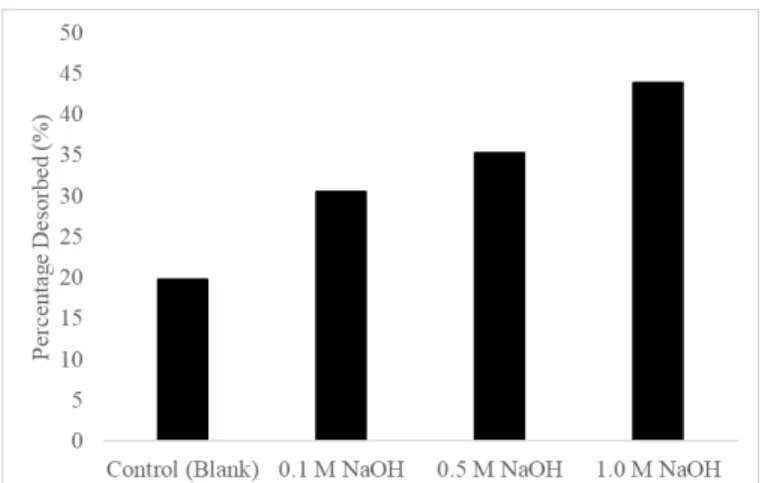
Desorption and Regeneration Studies
This observation is consistent with the previous analysis by Bhatti et al., (2018), where the desorption of phosphate ions from mango stone biocomposite approached 82% using 1.0 M NaOH. 2018) also demonstrated that phosphate ions were completely removed from iron ore acid leach liquor using 1.0 M NaOH after 5 cycles of adsorption-desorption. In this study, the partial phosphate desorption indicates that some phosphate ions are strongly adsorbed to acid-treated LS. Also, the number of available active sites is slightly reduced and a small amount of phosphate ions is accumulated in the biosorbent mass (Marković- Nikolić et al., 2018).
Competitive Adsorption between Nitrate and Phosphate
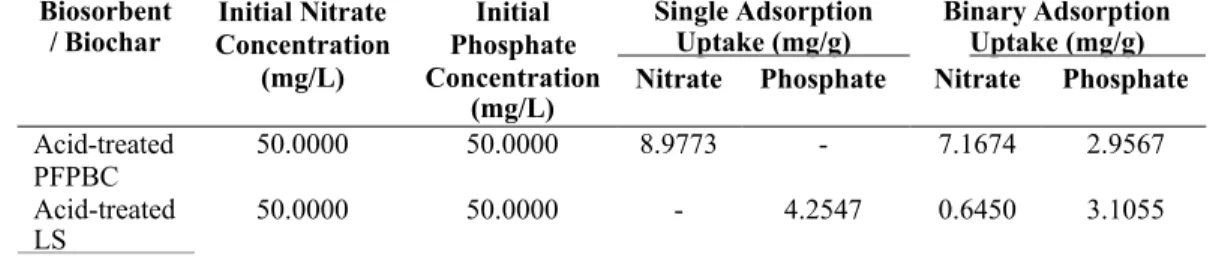
Based on the results, it was found that acid-treated PFPBC and acid-treated LS exhibited significant selectivity for nitrate and phosphate, respectively. This may be due to its higher ionic charge and charge density properties and its ability to form both inner and outer spheres (Katal et al., 2012; . Berkessa et al., 2019). In addition, the relatively greater decrement of adsorption uptake of nitrate ions in the presence of coexisting phosphate ions in acid-treated PFPBC may be due to non-specific nitrate adsorption sites or insufficient surface area for high anion concentration (Katal et al., 2012; Berkessa et al., 2019).
Comparison of Nitrate and Phosphate Biosorption Performance of Different Biosorbents
Comparison of Biosorption Performance of PFP and LS on Different Biosorbates
Nitrate Biosorption
Phosphate Biosorption
Competitive Biosorption between Nitrate and Phosphate
Recommendation
Kinetics of Adsorption on Carbon from Solutions, Journal of the Sanitary Engineering Division American Society of Civil Engineers, 89(2), pp.