Furthermore, the models were trained under different transaction cost settings to identify the effect of transaction costs on the performance of the models. Moreover, the results also showed that the best transaction cost setting should be equal to or higher than the actual transaction cost.
Introduction
- Overview
- Research Objectives
- Research Scope
- Impact, Significance and Contribution
- Report Organisation
In addition, reinforcement learning can also be applied to the optimization of robotic control according to [15] or even autonomous driving according to [16]. The reinforcement learning algorithms that were applied include Advantage Actor-Critic (A2C) [ 19 ], Proximal Policy Optimization (PPO) [ 19 ], Soft Actor Critic (SAC) [ 20 ], and Twin Delayed Deep Deterministic Policy Gradient (TD3) [ 21 ].
Literature Review
Financial Trading
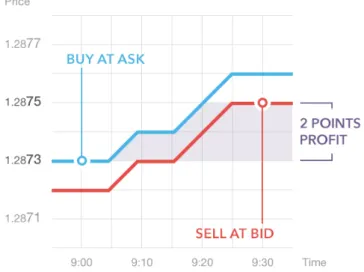
- Bid Price and Ask Price
- Candlestick Chart
- Technical Indicators
- Evaluation Metrics
Rate of Change (ROC) indicator represents the percentage change of the price compared to the price of n time steps ago. Simple return and log return are two of the most commonly used formulas for calculating return.
![Figure 2.2 as referred by [1] shows an example of a candlestick. In this case, the increasing candlestick is represented by white while the decreasing candlestick is represented by black.](https://thumb-ap.123doks.com/thumbv2/azpdforg/10215959.0/24.892.227.724.512.839/referred-candlestick-increasing-candlestick-represented-decreasing-candlestick-represented.webp)
Reinforcement Learning
- Markov Decision Process (MDP)
- Markov Property
- Policy
- Return
- State-Value Function and Action-Value Function
- Types of Reinforcement Learning Algorithms
- Advantage Actor-Critic (A2C)
- Proximal Policy Optimisation (PPO)
- Twin Delayed Deep Deterministic Policy Gradient (TD3)
- Soft Actor Critic (SAC)
The θ parameters can then be updated to maximize the objective function in Equation 2.29 as reported in [19] by performing a gradient ascent on the θ parameters. The objective function A2C is shown in Equation 2.32 as reported in [19], while the gradient of the objective function is shown in Equation 2.33.
![Figure 2.4 and 2.5 as referred from [34] shows diagram of Bellman equation for V π ( s ) and d iagram of Bellman equation for Q π ( s , a )](https://thumb-ap.123doks.com/thumbv2/azpdforg/10215959.0/32.892.318.606.883.1066/figure-referred-diagram-bellman-equation-iagram-bellman-equation.webp)
Related works
The authors proposed to maximize both the mean return and the Sharpe ratio in the objective function. The authors also added a deep neural network for feature learning before the recurrent neural network. However, the authors did not take into account the position held by each agent during the fusion of the agents' decisions.
The authors used an attention mechanism at the output of a Gated Recurrent Unit (GRU) layer to weight features extracted from historical time steps. In addition, the authors also included future price forecasts as an additional output to provide more feedback signals for faster convergence. The authors compared the performance of different feature extraction networks, including multilayer perceptron (MLP), convolutional neural network (CNN), GRU, and CNN-GRU.
The authors also compared the performance using only candlestick prices from the last time step and the performance using a range of previous candlestick prices. Although each model achieved a larger profit compared to the buy and hold strategy, the authors did not consider transaction costs in the work.
Research Methodology
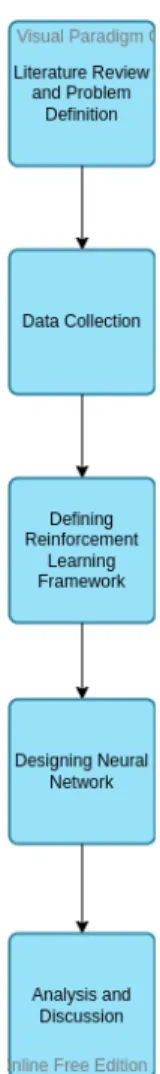
Methodologies and General Work Procedures
- Literature Review and Problem Definition
- Data Collection
- Defining Reinforcement Learning Framework
- Designing Neural Network
- Analysis and Discussion
More literature review was done regarding various reinforcement learning algorithms and their applications in financial trading. Data from the foreign exchange (FOREX) markets, equity indices and commodities were selected for use in this research. The collected data was then pre-processed such as removing flat values and calculating technical indicators.
Upon completion of data collection and data preprocessing, a reinforcement learning framework was defined based on the problem statements and research objectives. This includes defining the state representation, the actions to be performed by the reinforcement learning agent, and the reward function. During this process, technical indicators such as Simple Moving Average (SMA) and Exponential Moving Average (EMA) were selected based on previous works to be included in the state presentation.
A suitable neural network is designed according to the reinforcement learning framework that is defined. This involved choosing appropriate neural network modules such as InceptionTime [43], which is a type of Convolutional Neural Network (CNN) and Long Short Term Memory (LSTM) for the task.
Research Design
- Data Acquisition and Preprocessing
- Markov Decision Process Formalisation
Market variables consisted of closing price of normal candlesticks, closing price, low price and high price of Heikin-Ashi candlesticks, volume. This was to provide information to the agent about his position at that time to avoid frequent changes of position that could lead to large amount of transaction costs being incurred. This reinforcement learning agent would then be able to determine whether to take profit or stop the loss.
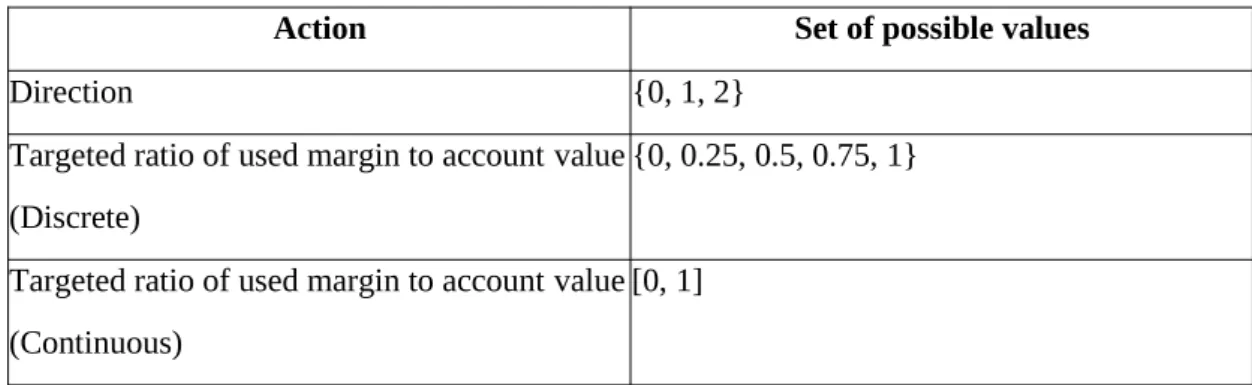
The fourth private variable was the volatility of the last 60 time steps of the 1-minute data. For the double-delay DDPG (TD3), the action space was a single value with the range [-1, 1] representing the target position. Each action for Advantage Actor Critic (A2C), Proximal Policy Optimization (PPO), and Soft Actor Critic (SAC) was a set of size 2, as shown in Table 4.1.
Therefore, the reinforcement learning agent will not be able to generate sufficient returns from future moves to overcome the transaction costs charged when a position was closed. However, this will cause the reinforcement learning agent to often close the positions due to the lack of transaction fees.
Reward Input
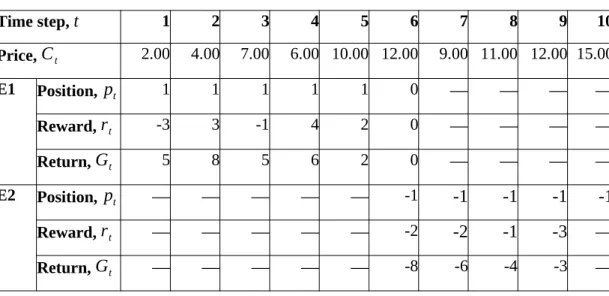
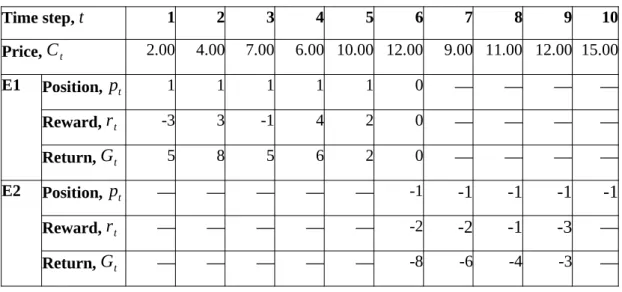
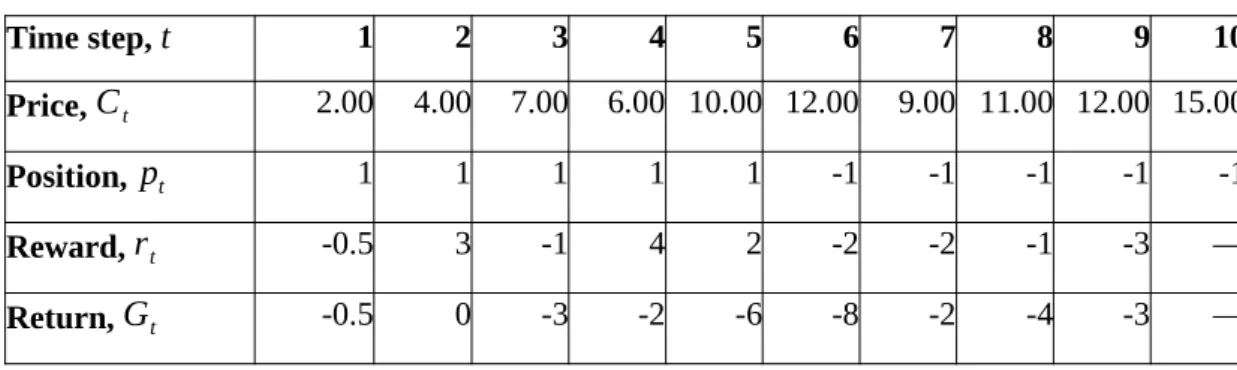
In this research, a new approach was proposed for the agent to interact with the trading environment. As shown by line 1 to line 5, the reinforcement learning agent was not allowed to switch from the long position to the short position or vice versa directly. If the direction is changed as evaluated in line 1, the time step t ' will remain unchanged as t.
By doing so, the agent can choose an action again to go long or short. Finally, as shown in line 17, if the condition in line 1 evaluated to true, the episode will end. The motivation for this approach was to prevent the discounted return from influencing the outcome of the subsequent trade.
Step function for environment Input
- Model Framework
- Output Layers and Types of Distribution
- Algorithms
This was because the direction of the position has changed from 1 to -1 at time step 6. In comparison, table 4.3 shows that the entire return of the first episode was non-negative despite the fact that time steps 7 to 9 have made a losing trade. Each of the InceptionTime-LSTM codes was trained on a dataset with different intervals which were 1 minute, 5 minutes and 30 minutes.
For A2C, PPO and SAC there were 2 additional heads at the last part of the neural network. The corrupted input is then passed into the encoder network and the final LSTM layer of the encoder generates an output vector. After that, the output vector is then iterated and passed into the decoder to reconstruct the input of the encoder.
This is also known as the recurrent vector, which is shown in Figure 4.3 as referenced by [45]. As shown in Figure 4.4 and Figure 4.5 that were referenced by [46] show an example of standard two-layer convolution block with kernel size 3 while Figure 4.5 shows an example of two-layer causal convolution block with kernel size 3.
Advantage Actor Critic (A2C) Input
Proximal Policy Optimisation (PPO) Input
Soft Actor Critic (SAC) Input
Twin Delayed DDPG (TD3) Input
- Hardware Setup
- Software Setup
- Setting and Configuration
- Trading Environment Setting
- Trading Agent Setting
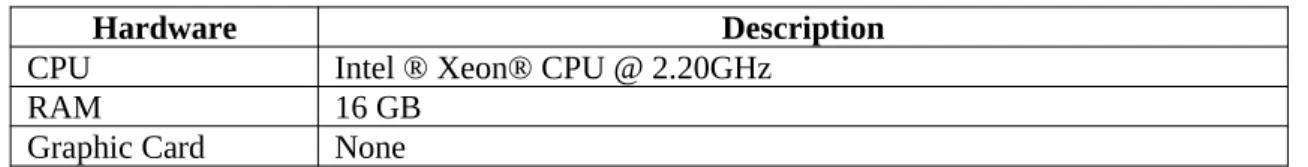
This section discusses the hardware setup, the software setup, and all the hyperparameter values for the trading environment and reinforcement learning algorithms. The hardware used in this research is provided by Kaggle, the platform on which the models were trained. The experiment was conducted using the Python programming language and PyTorch as the deep learning library.
The models were trained and tested on EUR/USD, USA500.IDX/USD and GAS.CMD/USD. For EUR/USD and GAS.CMD/USD, any change in position size must be at least 1000 units.
Analysis and Discussion
Experimental Result
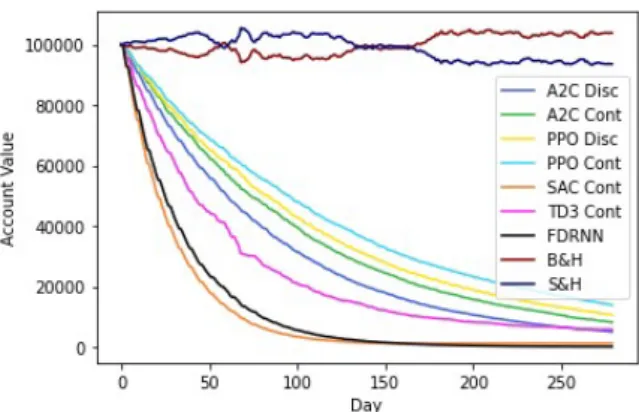
This is mainly due to frequent position changes leading to high transaction costs. This is because the transaction cost of GAS.CMD/USD was higher compared to other data sets. In Figure 6.1 and 6.2, it shows that the proposed models performed slightly better than the basic FDRNN method.
The performance of the model has also been tested using different transaction costs in the reward functions than the actual transaction costs. This shows that using a constant factor lower than 1 can negatively affect the performance of the model, as the gain learner tends to underestimate the transaction costs incurred and thus leads to greater losses. Figure 6-6 shows that the transaction costs of GAS.CMD/USD were too high.
All transaction cost settings, including the use of 0.5 constant factor, did not help to encourage the exploration of the reinforcement learning agent. Therefore, it can be concluded that setting the constant factor of the transaction cost at 1 in reward function is the most appropriate as it has shown better performance than other institutions.
Research Challenges
Conclusion
Hassabis, “A general reinforcement learning algorithm that masters chess, shogi, and goes through self-play,” Science, vol. Dresp-Langley, “Deep Reinforcement Learning for Robotic Manipulation Control: A Focused Mini-Review,” Robotics, vol. R, “Autonomous driving using deep reinforcement learning in an urban environment,” International Journal of Trend in Scientific Research and Development, vol.
Dai, “Direct deep reinforcement learning for representing and trading financial signals,” IEEE Transactions on Neural Networks and Learning Systems, vol. Levine, “Soft actor-critic: Maximum entropy deep reinforcement learning outside politics with a stochastic actor,” arXiv [cs.LG], 2018. Gao, “Application of the deep reinforcement learning on automated stock trading,” 2019 IEEE 10th International Conference on Science209S.
Shen, “Time-driven feature-aware joint deep reinforcement learning for financial signal representation and algorithmic trading,” Expert Systems with Applications , vol. Safabakhsh, "A Reinforcement Learning-Based Encoder-Decoder Framework for Learning Stock Trading Rules," arXiv [q-fin.ST], 2021.
FINAL YEAR PROJECT WEEKLY REPORT
Poster
Form Title: Supervisor Comments on Originality Report Generated by Turnitin for Final Year Project Report Submission (for Undergraduate Programs). The required originality parameters and limitations approved by UTAR are as follows:. i) the total similarity index is 20% or less, and. ii) Matching of individual cited sources must be less than 3% each and (iii) Matching of texts in a continuous block must not exceed 8 words. Based on the above results, I declare that I am satisfied with the originality of the final year project report submitted by my students as mentioned above.
UNIVERSITI TUNKU ABDUL RAHMAN FACULTY OF INFORMATION & COMMUNICATION
TECHNOLOGY (KAMPAR CAMPUS)
All references in the bibliography are cited in the thesis, especially in the literature review chapter. Include this form (checklist) in the thesis (Bind together as the last page) I, the author, have checked and confirmed that all the points listed in the table have been included in my report.
![Figure 2.3 Comparison between traditional candlestick chart vs Heikin-Ashi candlestick chart [22]](https://thumb-ap.123doks.com/thumbv2/azpdforg/10215959.0/25.892.163.843.502.726/figure-comparison-traditional-candlestick-chart-heikin-ashi-candlestick.webp)
![Figure 2.4 Diagram of Bellman equation for V π ( s ) [34]](https://thumb-ap.123doks.com/thumbv2/azpdforg/10215959.0/33.892.296.628.259.443/figure-diagram-bellman-equation-v-π-s.webp)